Analysis of Travel Choices and Scenarios for Sharing Rides
| |||||||||||||||||||||||||||||||||||||||||||||||||||||||||||||||||||||||||||||||||||||||||||||||||||||||||||||||||||||||||||||||||||||||||||||||||||||||||||||||||||||||||||||||||||||||||||||||||||||||||||||||||||||||||||||||||||||||||||||||||||||||||||||||||||||||||||||||||||||||||||||||||||||||||||||||||||||||||||||||||||||||||||||||||||||||||||||||||||||||||||||||||||||||||||||||||||||||||||||||||||||||||||||||||||||||
| Variable | Example 1: Private Transportation Network Company (TNC) Users | Example 2: Shared TNC Users | ||||
|---|---|---|---|---|---|---|
| Option 1 (Observed) | Option 2 | Option 3 | Option 1 (Observed) | Option 2 | Option 3 | |
| Price | $25 | $16 | $13 | $16 | $22 | $24 |
| Time | 30 min | 35-39 min | 44-47 min | 39 min | 32-34 min | 27 min |
| Mode | Private | Shared TNC | Shared TNC | Shared TNC | Shared TNC | Private |
| Private Transportation Network Company (TNC) Users | Shared TNC Users | ||||||
|---|---|---|---|---|---|---|---|
| Card | Price Relative to Observed | Time Relative to Observed | Mode | Card | Price Relative to Observed | Time Relative to Observed | Mode |
| 1 | 100% | 100% | Private | 1 | 150% | 70% | Private |
| 2 | 65% | 100% | Shared | 2 | 100% | 100% | Shared |
| 3 | 50% | 100% | Shared | 3 | 100% | 81-91% | Shared |
| 4 | 15% | 100% | Shared | 4 | 100% | 91-102% | Shared |
| 5 | 65% | 115-130% | Shared | 5 | 120% | 100% | Shared |
| 6 | 50% | 115-130% | Shared | 6 | 120% | 81-91% | Shared |
| 7 | 15% | 115-130% | Shared | 7 | 120% | 91-102% | Shared |
| 8 | 65% | 125-150% | Shared | 8 | 135% | 100% | Shared |
| 9 | 50% | 125-150% | Shared | 9 | 135% | 81-91% | Shared |
| 10 | 15% | 125-150% | Shared | 10 | 135% | 91-102% | Shared |
| 11 | 65% | 145-165% | Shared | 11 | 120% | 70% | Private |
| 12 | 50% | 145-165% | Shared | ||||
| 13 | 15% | 145-165% | Shared | ||||
In addition to the TNC users' anonymized survey responses, the TNC provided the research team with the following data on respondent behavior for each survey response:
The first three items were provided as the quantile in which the data fell for the distribution of that measure in each of the 15 markets. The TNC partner appended the following variables from the Environmental Protection Agency's (EPA's) Smart Location Database to describe the built environment surrounding the pick-up and drop-off locations of each survey response:
The TNC did not attach the exact value for these variables to each survey response, but rather categorized quantiles for each variable: less than 50 percent, 50 to 80 percent, 80 to 90 percent, 90 to 95 percent, and greater than 95 percent. These quantiles refer to the relative density of locations within a given market, rather than relative density at a national level.
The complete dataset included 5,373 unique survey responses. To ensure validity and applicability of the data collected for the research questions, the research team, in conducting its analysis, removed invalid or inapplicable responses and weighted the remaining responses to the surveyed population. The following filters were used to limit records used for further analysis:
This filter resulted in the removal of 625 responses, for a sample size of 4,748. In addition to the filters above, responses were tested for logical consistency in preferences between the ridehailing options presented. The checks identified users who chose an option that was strictly inferior to another in terms of both travel time (i.e., slower) and cost (i.e., more expensive). To ensure users completed the survey with attention and thoughtfulness, responses failing two or more checks were removed.
Screening responses with these filters resulted in removing an additional 383 responses (for a total of 1,008) and produced a final dataset of 4,365 responses. While this process resulted in the removal of a high number of screened responses (approximately 18.8 percent), this level is similar to other online surveys of TNC users.19
To produce generalizable findings, survey samples must match the characteristics of the population surveyed. For this reason, the research team applied data weighting techniques to the survey sample to make it more representative of the population of TNC users across the markets studied. The team weighted responses in a two-step process: within TNC markets and between TNC markets.
Within each of the 15 markets studied, responses were weighted to match five characteristics: users' sharing opt-in rate, users' number of TNC trips taken, trip distance, trip day of the week, and trip time of day. This approach required the appended quantile information described above as well as data on the share of trips within each market by day of the week and time of day and appended day-of-week and time-of-day information for the survey anchor trip. The team applied an iterative proportional fitting model to the survey data distributions to calculate weights that matched distributions of these five characteristics in the survey responses to the population distributions of each market as closely as possible. The team trimmed weights to prevent the outsized influence of specific responses. After weighting within each market, the team used data from the TNC on the number of active users within each market to weight responses between markets.
Weighted data on respondents and their trips was then used to conduct the market segmentation analysis described in the following section. Before turning to that analysis and results, a final data preparation step for the choice analysis warrants description.
In the discrete choice analysis, the unit of analysis is not the observed trip, but each choice of a private or shared TNC ride presented in the trip alternative portion of the survey. Because each respondent answered many triplet questions and each question represented two preferences (the selected card over two unselected cards), the 4,365 valid responses produced 110,320 choice observations.
Because of the structure of the choice question triplets, each observation represented one of three choice types: private over shared, shared over private, or one shared option over another. The last choice type was discarded from analysis (although later revisited) because it did not represent the choice between sharing and not sharing, but rather preferences for time and cost in shared TNC rides (additionally, some shared options were strictly preferable to others in terms of both time and cost). The result was 79,667 usable observations. These choice observations were associated with the full data for each respondent and weighted appropriately.
The research team used the dataset of 79,667 choice observations to build several discrete choice models. In each model, the dependent variable is the binary shared–private product choice. The mode used for the observed trip on which the choice survey was based was not used as a dependent or predictor variable in these models.
As a first step in the discrete choice analysis, the research team created a series of univariate models that estimated correlations between trip and user characteristics (i.e., predictor variables) and the choice of mode (private or shared) for each observation. These univariate models considered the following predictor variables:
Trip distance, cost savings, and travel time penalties were treated as continuous variables. Cost savings and travel time penalties (per trip and per mile) are particularly important predictor variables in this project. These variables were calculated as the cost and time difference between the preferred and the rejected travel alternative (in all cases, one alternative was a private TNC trip and the other a shared TNC trip). Because travel times were presented as a range for shared TNC trips, the travel time penalties were calculated based on the midpoint of the range presented. Although the uncertainty implied in the range may have affected each respondent's decision, the design of the survey did not allow for consideration of this uncertainty, so midpoints were used for the analysis instead. It is possible, though, that users focused on the longest time presented for each trip option, in which case using that time instead of the midpoint would make sense, but we lack evidence of this and thus chose to use the midpoint values.
The team treated all other predictor variables as discrete variables or multiple binary variables in the various univariate logit models. Annual income, for example, was classified according to five levels (e.g., less than $50,000, $50,000 to $75,000, etc.). Household composition, on the other hand, was classified as a set of binary examples (e.g., one child, no children, many children).
Because the dependent variable in each of these models is a binary outcome variable (whether a user selected the shared option for the hypothetical choice), the team used logistic regression for the discrete choice models of the logit form. Logit models estimate the log-odds of an outcome as a linear combination of predictor variables that can have positive or negative effects on the probability of sharing. The logit model is specified by a set of coefficients and the ability to calculate standard errors and associated p-values for each predictor variable. These values can indicate whether the variable has a significant effect on the dependent variable. The coefficients describe the change in the log-odds outcome for a one unit increase in the predictor variable. Using exponentiated coefficients, it is possible to observe the impact of each of the above predictor variables on the probability of sharing.
The research team tested various combinations of predictor variables in a series of multivariate models. Initial models were constructed based on predictor variables shown to have significant effects in the univariate models and refined in order to identify the combinations of variables that best predict choice, measured using the Akaike information criterion, a measure of logit model fit. The team explored nine logit models in depth as listed below:
Furthermore, the research team divided the data into subsets in various ways to calculate these effects according to population segments of interest from a policy perspective. For each segment, the models above were estimated for the specific population of interest.
These segments include:
Calculating coefficients for each of these segments allowed the research team to observe how population-level characteristics affect willingness to use a shared TNC and to identify the market segments where an intervention (for example, via a targeted incentive) would have the greatest effect.
While this chapter describes differences between private (i.e., ridehailing) and shared (i.e., ridesharing) rides, it is worth noting that private rides often have a passenger occupancy of greater than 1. Some ridehailing vehicles, for example, have the capacity for up to 6 passengers in one private party. Shared ride parties, meanwhile, are restricted to either a single passenger (most common) or a single passenger and 1 companion (which typically requires payment of a small additional fee that reduces the price difference between private and shared rides).
The survey data gathered by the TNC allowed for analysis of passenger occupancy in private rides. Doing so requires a slightly different dataset than the one used in the rest of the analysis described in this chapter. Specifically, the data were re-filtered to include only private trips and to include party sizes greater than two riders (which had been previously omitted to account for the fact that such parties are not eligible for ridesharing). This re-filtering produced a new dataset with 3,518 observations.
In the survey, respondents described their party size as "On my own," "1 other person," or "2 or more other people." Table 4 summarizes party size according to these three levels. Because the level "2 or more other people" includes parties of 3 or more, it is not possible to calculate average occupancy precisely. However, knowing that all users traveling with "2 or more other people" represents party sizes of at least three, then the average occupancy of a private ride (not including the driver of course) is at least 1.462. If, as is more likely, it is assumed that parties greater than 2 have an average occupancy of 3.1, then the average occupancy increases to 1.475.
| Party Size | Share of Observed Trips (Weighted) |
|---|---|
| "On my own" | 64.2% |
| "1 other person" | 21.5% |
| "2 or more other people" | 13.0% |
This estimate is compatible with findings from other research. Henao and Marshall found, for example, an average occupancy of 1.37 using data collected from 416 ridehailing rides (private and shared).21 While this estimate is somewhat lower than the occupancy presented above, Henao and Marshall include shared rides in their survey, which counterintuitively lowers the average occupancy per party-trip by restricting party size to 2.
This average occupancy makes even private ridehailing rides more favorable from an occupancy perspective than personal vehicle trips, but it is also worth noting that these estimates do not account for the miles that a driver spends without a passenger between rides (i.e., deadheading miles). Balding et al. estimate the share of TNC VMT without a passenger to be 42 percent. Using this estimate, factoring the miles in which the passenger occupancy of a TNC vehicle is zero into occupancy results, leads to an effective occupancy for private ridehailing trips of approximately 0.855 (assuming that parties greater than 2 have an average occupancy of 3.1).22 For comparison, Henao and Marshall used an estimate of 40.8 percent deadheading miles, which reduced their average vehicle occupancy from approximately 1.4 to approximately 0.8.23
Using our broad sample of 4,365 ridehailing users living in areas where on-demand ridehailing is available, this research shows (1) which market segments in our weighted sample opted in to shared and private modes more or less frequently, and (2) how differences in price and travel time may affect ridesharing behavior. Before presenting these findings in greater detail, several limitations to the methodological approach warrant attention.
First, the data presented here are only a snapshot in time of a TNC user base that is growing and changing rapidly, with a 37 percent increase from 2016 to 2017 in passengers transported.24 As this user base evolves and TNCs alter their services, this analysis will need to be updated to reflect the point-in-time reality of travel behavior. Longitudinal/panel research would support an understanding of how sharing behavior changes over time.
Second, regarding the scenario evaluation and the supporting discrete choice analysis, results are limited by trip alternative questions asked in the TNC's survey. That is, this study does not have data to evaluate the effects of price and time differences that exceed those presented in table 3 (i.e., maximum shared/private TNC price differential of 75 percent). It is not possible, for example, to analyze the effects of free shared TNC trips on the rate at which people choose to use shared TNCs. Also, because cards were generated based on set levels of discount relative to the observed trip, data are not granular enough to truly calculate non-linear effects that might exist even within the range tested.
Third, the survey results do not address interactions across all modes. For that reason, this study can estimate how price and time affect a user's choice between a private and shared TNC ride, but it cannot estimate how price and time affect a user's choice between TNCs, transit, driving, carpooling, walking, bicycling, or any other mode. This research provides previously unavailable detail on shared versus private TNC rides but does not analyze how changes to shared or private rides might affect, for example, transit use. Similarly, the study has no data to consider how TNC characteristics affect a user's decision to take a trip in the first place. Naturally, TNC users face many travel decisions beyond whether to share a TNC ride. Nonetheless, the results presented below focus narrowly on this one decision by assuming, for the sake of analysis, that travelers make decisions between personal cars, TNCs, transit, and active transportation before making decisions about shared versus private for-hire vehicles. If price and time differentials change between private and shared ridehailing in such a way that average ridehailing trip costs and travel times do not change significantly, it is likely that the overall TNC mode share will not change significantly either.
Finally, although this anchored stated preference approach provides unique insights into choices to share, caution is still recommended when relying on reported preferences (even though "anchored") rather than observational or experimental data. There is no guarantee that respondents' reported choices would have matched their real-world choices had each of the options been available; the TNC's survey did not fully replicate customers' in-app decision-making process. Furthermore, the survey relied on respondents' memories of the observed trip and some customers may have forgotten any number of factors that influenced their actual decision, such as weather, peer pressure, or the urgency of their trip, despite the trip having taken place only within the previous 24 to 48 hours.
With these limitations in mind, the results presented in the following two sections seek to shed light on how travelers chose to take shared or private TNC trips.
The weighted survey data supported the division of respondents into market segments with different propensities to choose ridesharing products. Dividing up market segments allows identification of segments with greater opportunity for mode shift. The research team sought to (1) identify, using personal characteristics, meaningful segments of people who share or show a willingness to share at different frequencies across their total trips, and (2) identify, using trip and built environment characteristics, meaningful segments of trips that are shared or where there is a willingness to share at different frequencies.
The research team selected the following segments for their policy relevance and observed impact on behavior:
Regarding the origin and destination sub-bullets under "Trip characteristics" above, data were derived from questions asking respondents to describe their origin and destination according to one of the following types: "Your home or current residence"; "A workplace, worksite, professional meeting, or school"; "An entertainment, recreation, or social venue"; "Another location for personal business"; or "An airport, inter-city bus terminal, or train station."
The research team divided respondent data into the respective segments. For each segment, the team summed the weights for respondents at each opt-in level (for personal characteristics) or for private/shared trips (for trip characteristics and built environment characteristics). These sums were divided by the total of respondents in each category. The resulting shares are plotted as histograms in the following sections. The research team used the Pearson's Chi-squared test for the absolute counts of the segmented populations to test whether the distributions of each population (users who frequently, sometimes, or rarely share; shared and private trips) were statistically different. All segments listed above were significant at the 95 percent confidence level except for trip distance.
The administrative data for this research contains three levels of long-term sharing behavior among users: rarely (less than 10 percent of trips), sometimes (10 to 50 percent of trips), or frequent (greater than 50 percent of trips). These frequency levels are based on all trips that a user took through the ridehailing app between July and November 2018. Those who rarely share account for 30 percent of the weighted data; those who sometimes share, 45 percent; and those who frequently share, 25 percent. The research addresses five dimensions through which statistically significant and interesting differences in sharing can be identified: gender, vehicle ownership, transit use, annual income, and age.
Figure 1 summarizes the respondents' frequency of opting in to ridesharing according to these five user characteristics. Females, representing 58.5 percent of the weighted survey responses, represent about 66 percent of users that choose shared products more than 50 percent of the time, making them far more likely to be "frequent" or "sometimes" sharers than the men in the sample.
Frequent sharers are most likely to be from zero-car households than from households with one vehicle or multiple vehicles. Respondents who share less than 10 percent of the time are most likely to have two or more vehicles. Riders who share more often also tend to use transit more. Over half of riders who frequently share also use transit more than three times a week. For riders that rarely share, over 50 percent of them responded that they use transit zero times per week.
A significantly larger proportion of frequently-sharing respondents comes from households with under $50,000 of annual income. Sometimes- and rarely-sharing respondents are much more likely to have annual incomes over $100,000 per year. Users with annual income between $50,000 and $100,000 are more equally divided among those who rarely share, those who sometimes share, and those who frequently share.
Riders who share frequently in the sample tend to be younger. The majority of all users, including from all three sharing groups, are 25 to 45 years old. The proportion of frequent sharers under 25 is nearly twice the proportion of rarely sharing users under 25.
Just as respondents' characteristics affect respondents' willingness to share across trips, details of their surveyed trip were expected to influence their choice for the specific trip surveyed. Shared trips accounted for 28 percent of the weighted sample, while private trips accounted for 72 percent. While many trip characteristics were found to be statistically significant, trip distance was not found to have a significant effect. Figure 2 summarizes the distribution of observed trips according to the product used: shared or private.
The weighted sample demonstrated a greater proportion of shared trips in several market segments. Examples include solo trips, weekend trips, trips from work, trips home, and trips to entertainment or personal business.
Conversely, the study observed a greater proportion of private trips in several market segments. Examples include trips by parties of 2, weekday trips, morning trips, short distance trips (less than 5 miles), trips to work, and trips to or from intermodal travel nodes (i.e., airports, train stations, and bus terminals). The study also observed less sharing for trips paid for by an employer and found that respondents taking employer-paid trips are much less price sensitive than those who pay for their own travel.
Three built environment characteristics measure different forms of density: residential, office/industrial employment, and retail/entertainment employment. As noted previously, these density measures were calculated individually for the 15 markets, so that the 10th percentile zone in New York is much denser than the 10th percentile zone in Nashville or Portland. These density measures were studied for both trip origins and destinations to understand if there were specific markets, such as trips to work, for which sharing was more common. Of the six distributions, four are statistically significant; end-of-trip residential density and beginning-of-trip retail/entertainment density are not. Like figure 2, figure 3 summarizes the distribution of observed trips according to the product used and the built environment of trip origins and destinations.
The densest areas (90th to 100th percentile of the metropolitan area) account for disproportionately large shares of trip origins and destinations across all three measures, for shared and private trips. The skewing is especially high toward employment with around 45 percent of all trips coming from the densest 10 percent of retail/entertainment and office/industrial zones. About 30 percent of trips end or start in the densest 10 percent of zones by residential population. These findings support the conclusion that TNC use is greatest in the densest parts of metropolitan areas, but many trips connect dense employment areas to less dense residential areas (likely outside urban cores).
In the weighted sample, a greater proportion of shared trips is observed for trips starting or ending in the least dense office/industrial and retail/entertainment employment areas (0 to 50th percentile). This finding may be correlated to trip length; longer trips are more likely to be shared and trips traveling through less dense areas are likely to be longer. It could also be related to the types of employment and travelers in these areas if they are lower-income jobs or less expensive retail and entertainment establishments. These interactions could be studied further in future work.
In the weighted sample, a greater proportion of private trips started in the least dense residential areas (0 to 50th percentile) and the densest residential areas (95th to 100th percentile) than in the intermediate density categories. These differences are statistically much greater than random, showing that there are multiple factors of sharing propensity at work for residential travel, and probably other area types as well. Differences in built environment characteristics capture a variety of factors, such as supply and demand factors related to trip density that could affect the efficiency and pricing of sharing as well as interactions with the type of travelers and purposes associated with traveling to these areas. These area density quantiles provide initial insights into how place type may affect sharing and opportunities to increase sharing, but additional work would be necessary to understand in greater detail what really leads to higher use of sharing and to untangle the different factors at play.
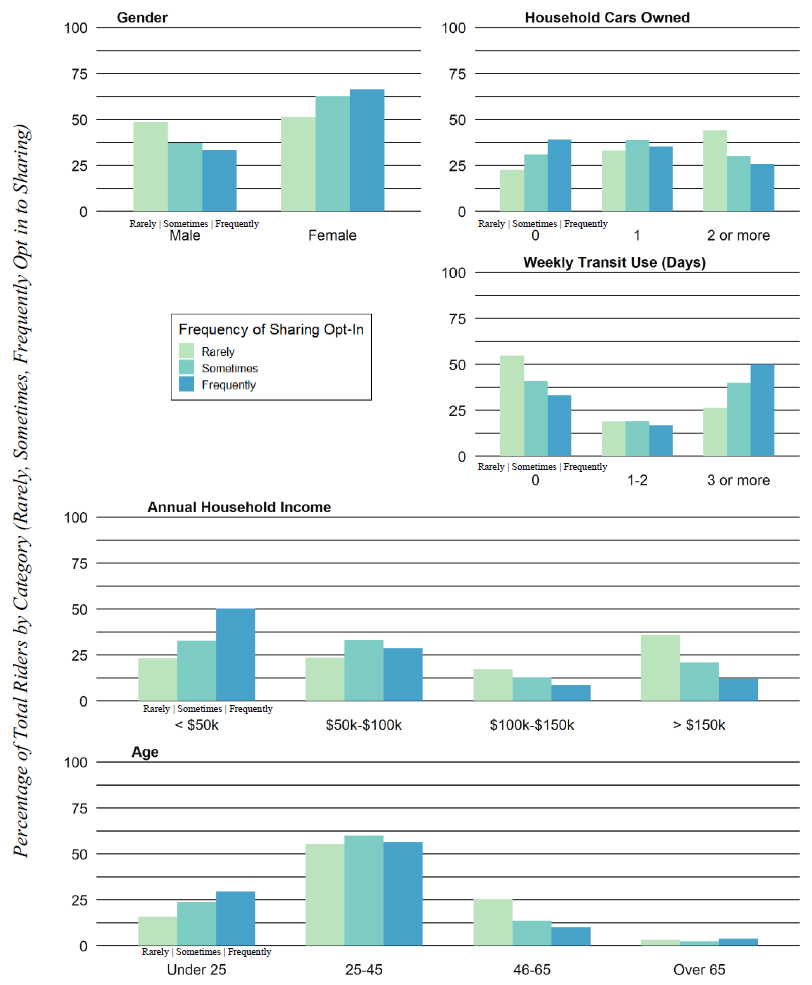
Figure 1. Graph. Distribution of observed frequency of sharing according to user characteristic. Bars of the same frequency level sum to 100 in each panel (n = 4,365).
(Source: Federal Highway Administration)
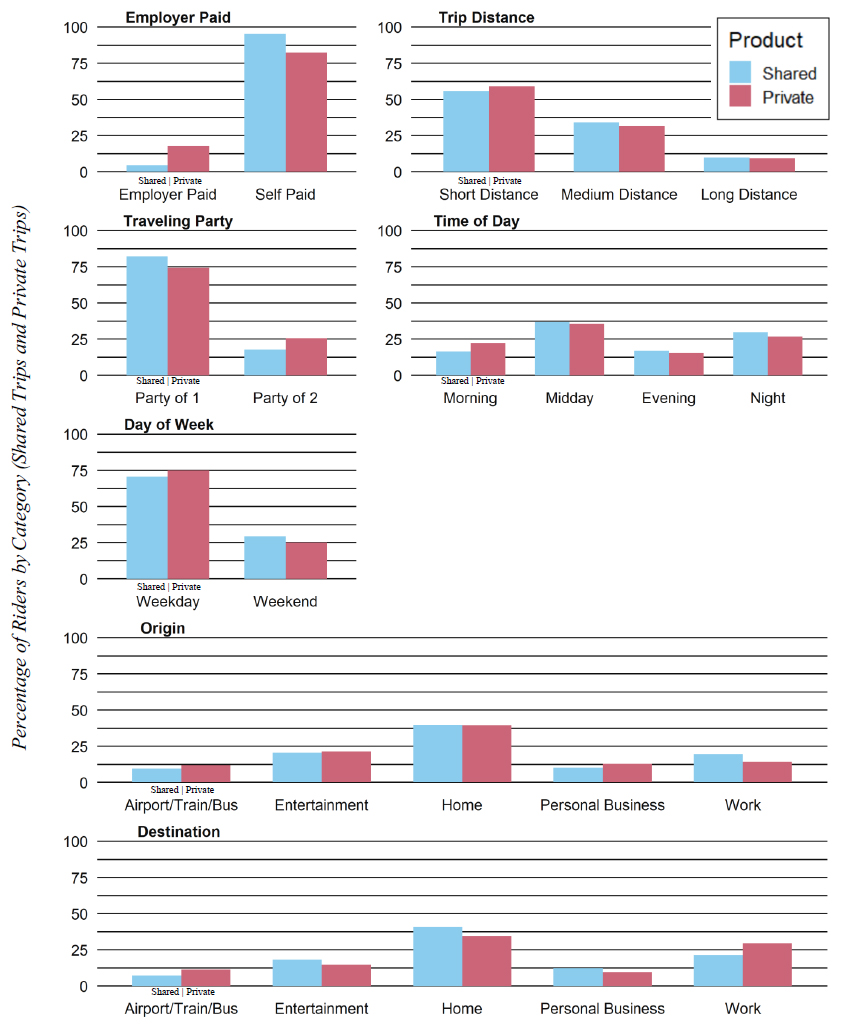
Figure 2. Graph. Distribution of shared and private trips according to trip characteristics (n = 4,365).
(Source: Federal Highway Administration)
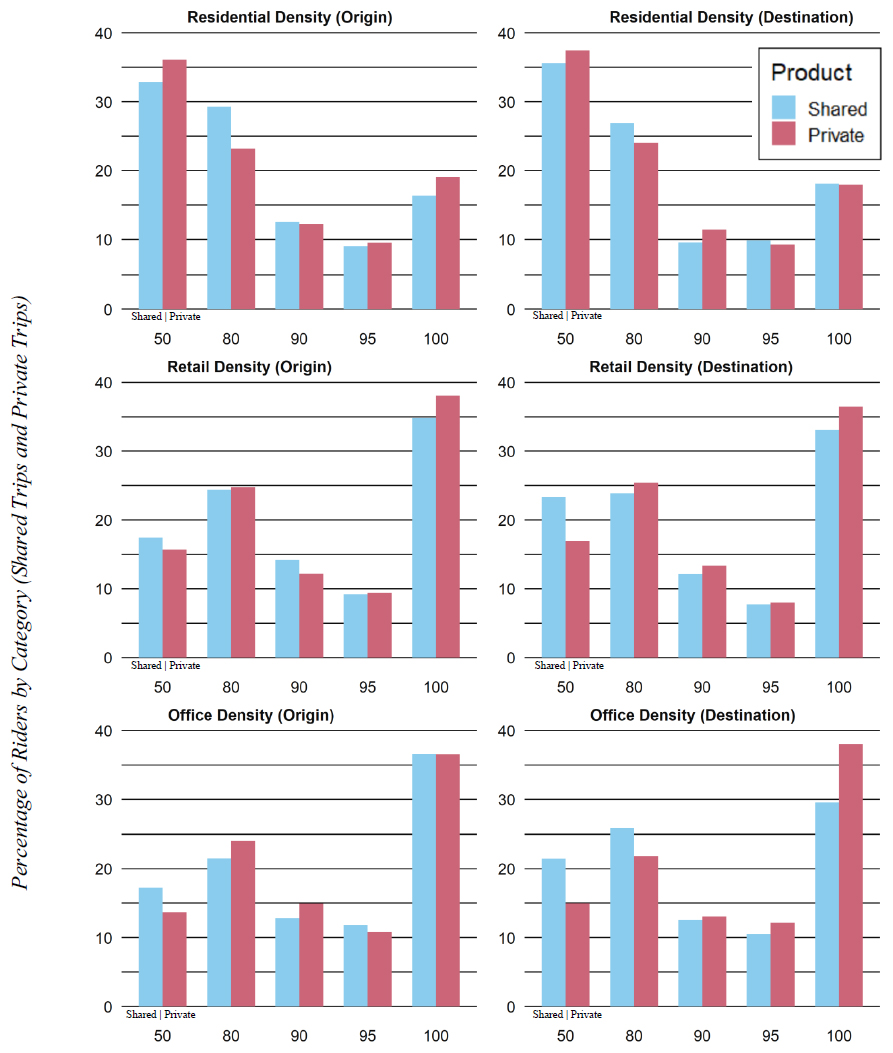
Figure 3. Graph. Distribution of shared and private trips according to the built environment characteristics. Categories on the x-axis represent percentiles (n = 4,365).
(Source: Federal Highway Administration)
The discrete choice models developed as described in the Survey Approach and Data Preparation section enabled the research team to evaluate how shared product use would change in scenarios where respondents experienced different price and travel time options for shared trips relative to private trips. The scenarios studied were changes in (1) the dollar per mile relative cost differences between shared and private TNC trips, and (2) the minute per mile travel time relative differences between shared and private TNC trips.
To evaluate the effect of these relative differences (by population segment), the research team extracted coefficients from the discrete choice models to estimate the impacts of a change in price or travel time on the probability of sharing. Exponentiating the coefficients results in an estimate of the effect of an additional dollar of cost or minute of travel time on the probability that a user selects a shared TNC product over a private TNC product for a specific trip. The analysis used coefficients from model 8 for cost and travel time savings per mile. When analyzing market segments, coefficients corresponding to the market segment were removed from the model because the segment variables had uniform values.
The discrete choice modeling approach can be used to explore changes in mode choice that might occur as a result of changes in the relative travel time and price of TNCs. These changes are not intended to represent specific policy mechanisms since there might be any number of ways for relative cost and travel time scenarios to come about, especially considering local context factors for travel. As such, these results do not test the impact of specific policies, but rather model the mode choice implications that could result from potential policy outcomes, particularly relative price difference increases between private-party and shared TNC trips.
The effect of price can be understood in two manners based on survey data and based on administrative data, both provided by the TNC. The first is by describing the responses riders reported or were observed to choices presented directly (i.e., descriptive analysis), and the second is by using the discrete choice models to ask how TNC users would respond to options generalized from the choice sets presented if they were made available.
Relying on descriptive analysis, figure 4 shows the share of private TNC users that switched from private to shared TNC trips at each of the three levels of price differences offered in the study. These three alternatives represent shared trips with identical travel times to the observed private trip. The figure shows that holding travel time "constant" (i.e., shared and private alternatives have the same estimated travel time), higher discounts for shared rides correspond to greater shares of the population willing to use sharing, indicating some amount of price sensitivity. This relationship presents a roughly linear pattern; increasing the price differential from 35 percent to 50 percent (an average $2.24 additional discount) increases the user's willingness to share by 7.5 percent, while increasing the price differential from 50 percent to 75 percent (an average $3.44 additional discount) increases the user's willing to share by 11.0 percent. The increase in sharing per dollar price differential between these tiers is quite similar: 3.3 and 3.2 percentage points per dollar. Figure 4 also shows that over 30 percent of users rejected a shared trip that cost 75 percent less than the observed private trip, even when the presented travel time is identical, reflecting the fact that unwillingness to share is not only related to price and time.
Figure 4 presents this summary for all TNC users (solid orange) and for TNC users with reported annual income under $50,000 (dotted orange) and over $100,000 (striped orange). These segments were chosen in order to represent a more and less price-sensitive group, respectively, of the TNC user population. As expected, a greater share of lower-income users chose the shared option at each of the three price differentials. The opposite is true for higher-income users.
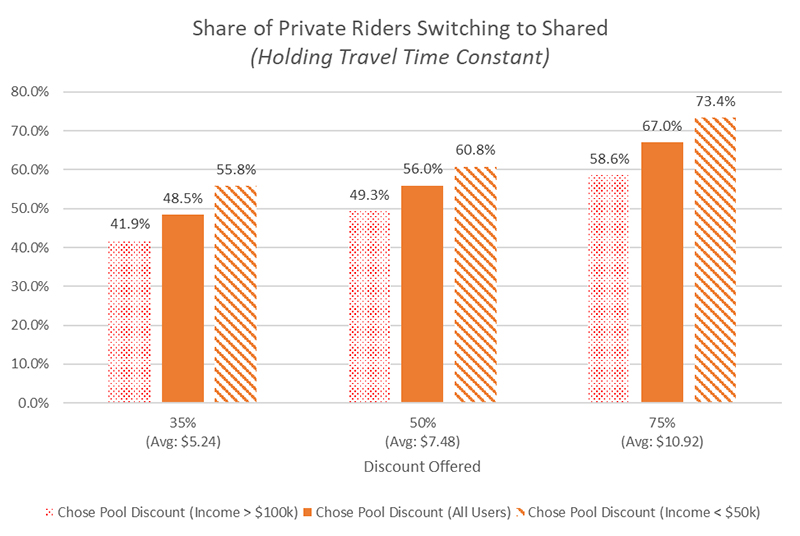
Figure 4. Graph. Share of private transportation network company users that switched to shared travel. Users in dataset that switched from private to shared travel at three levels of price differences offered (with average price differential shown in parentheses). These three alternatives represented shared trips with identical travel times to the observed private trip.
(Source: Federal Highway Administration)
As noted in the Survey Approach and Data Preparation section, the research team broke down the data into various subsets for its analysis to calculate price and time effects according to population segments of interest from a policy perspective. Segments are relevant to policy discussions if it is possible to design a policy that would affect only that segment through a realistic mechanism such as geographic cordons or an income verification procedure. These segments included annual income (less than $50,000 and greater than $50,000), relative office and industrial employment density for the market at the origin and destination, regional centrality index by transit at the origin and destination, and trips to and from airports or other intermodal hubs.
Table 5 presents exponentiated coefficients of model 8 for the market segments analyzed below (as well as control variables representing market segments not analyzed in depth). Table 6 presents the initial sharing rates for these same segments. The dependent variable in this model is the probability that a respondent opted into the shared ride option (regardless of whether the resulting ride was actually shared). All variables presented in Table 5 were significant with p-values less than 0.05, except where noted. These coefficients differ slightly in the segmented models as those models are derived from different (segmented) populations with different characteristics. Coefficients greater than 1 indicate that a unit change in that variable (most are binary, indicating a true or false case) would increase the probability of sharing. Coefficients less than 1 indicate the opposite. The coefficients in Table 5 indicate, for example, that the model predicts that users with annual incomes under $50,000 are 49.7 percent more likely to select a shared ride, "all else equal" (and the initial sharing rate confirms that lower-income users did indeed select a shared ride more frequently in the observed data). However, table 6 shows that the initial sharing rate for users with annual incomes under $50,000 is not exactly 1.497 multiplied by 29.9 percent because "all else" is not equal; the users in this category also have different trip purposes, origins, destinations, trip lengths, and other trip characteristics that distinguish them from the average user. Like riders with annual income under $50,000, the model also found that riders whose origin was a relatively dense office district were more likely to share. The opposite was true for trips ending in dense office districts and trips starting in competitive transit districts.
| Variable Type | Variable | Coefficient |
|---|---|---|
| Market Segment (see figure 5 and figure 7) |
Annual Income: Under $50,000 | 1.497 |
| Annual Income: Over $100,000 | 0.667 | |
| Dense Office District (Begin Only) | 1.111 | |
| Dense Office District (End Only) | 0.953 | |
| Competitive Transit (Begin Only) | 0.859 | |
| Competitive Transit (End Only) | Not Significant | |
| To/From Airport | 0.949 | |
| Price and Time | Shared Cost Savings ($/mile) | 1.086 |
| Shared Time Penalty (min/mile) | 0.666 | |
| Control Variables | Age: Under 25 years old | 1.470 |
| Age: Over 65 years old | 0.759 | |
| Transit Use: 1 or more days/week | 1.316 | |
| Household Car Ownership: Owns car | 1.031 | |
| Gender: Male | 0.924 | |
| Visitor | 1.138 | |
| Employer Paid for Trip | 0.464 | |
| Size of Traveling Party: 1 | 1.208 | |
| Trip Start Time: Morning | 0.812 | |
| Trip Start Time: Evening | 0.934 | |
| Trip Distance (miles) | 1.009 | |
| Home-based Work | 1.211 | |
| Home-based Social | 1.071 |
Table 5 shows that Model 8 also presents price and time differences between shared and private rides as a linear explanatory variable for sharing. As noted in the descriptive analysis in the previous section, increasing price differentials for shared rides correlates to a roughly linear increase in users' probability of sharing. Applying the market segmentations from table 5 to the discrete choice model, figure 5 presents the coefficient of this price difference for various population segments. The segments presented are not exclusive of one another, so that a trip could be made by a rider with annual income below $50,000, starting in a dense office district and ending in a transit competitive area. The two triplets of location segments are exclusive within their characteristics (as shown by use of three bars of the same color).
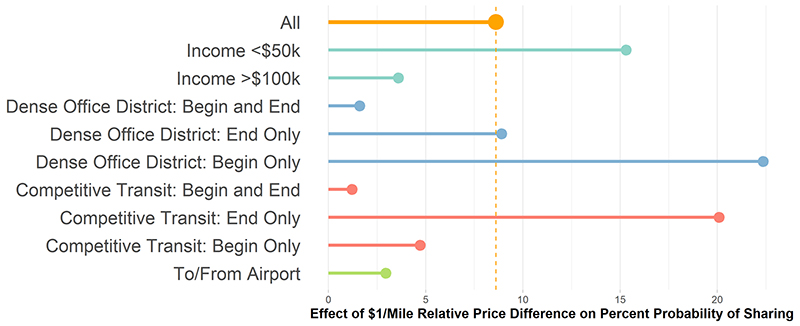
Figure 5. Graph. Effect of $1 per mile relative price difference on a user's percent probability of sharing rides.
(Source: Federal Highway Administration)
The values in figure 5 can be interpreted as the effect of an incremental increase in the price differential between shared and private TNC trips on an individual's probability of opting into the sharing option. Figure 5 presents this effect on a per-mile basis to normalize price and time considerations by trip length. For example, a $4/trip discount on a $6, 1-mile ride would likely have a much greater influence than a $4/trip discount on a $25, 10-mile ride.
| Market Segment | Initial Sharing Rate |
|---|---|
| Annual income Under $50,000 | 39.0% |
| Annual income Over $100,000 | 24.4% |
| Dense Office District (Begin Only) | 30.4% |
| Dense Office District (End Only) | 25.7% |
| Competitive Transit (Begin Only) | 30.8% |
| Competitive Transit (End Only) | 28.7% |
| To/From Airport | 23.5% |
| All Trips | 29.9% |
The research finds that the overall effect of a $1/mile per trip greater price difference is an 8.6 percentage point increase in the probability of sharing. This indicates that, for all users, an additional $1/mile price difference increase the probability of sharing from 29.9 percent (see initial sharing rates in table 6) to 38.5 percent. The effect of increasing price differences is even greater for the following segments:
This finding is related to the coefficients observed in table 5, in which these three segments are correlated with higher probabilities of sharing. This finding suggests that for each of these segments, riders are more price sensitive and therefore choose lower cost options more often when they are made available. Both past research and economic theory are consistent with lower- income travelers exhibiting higher price sensitivity.
One explanation for differential responses to price differences at different locations is that time sensitivity differs for various trip purposes. For instance, trips to employment districts are likely more time-sensitive because employees need to arrive at the office at a fixed time, but leaving offices, workers enjoy a more flexible schedule and are less concerned about travel time. Considering trips that start in dense office districts, there is considerable overlap with trips originating at work; more than half of all trips with a work origin also begin in the densest office districts. This overlap explains why riders originating in dense office districts appear less price sensitive (i.e., more willing to accept a discount to share). The effect of each additional $1/mile price difference is similar in trips starting at work (a 19.8 percentage point increase in the probability of sharing) and trips starting in dense office districts (a 22.4 percentage point increase; see figure 5).
The higher sharing propensity for trips ending in areas with competitive transit is harder to explain, but the greater effect of price for these trips may be related to statistically significant correlations with weekly transit use (i.e., this group includes riders who use transit more frequently each week), trip length (i.e., these trips are longer), or time of day (i.e., this group includes more late-night weekend trips). Each of those segments also demonstrates greater willingness to respond to a given price for shared rides, indicating that trips ending in areas with competitive transit are taken by riders who are less time sensitive, more price sensitive, and/or more open to sharing.
Conversely, the effect of greater price differences is much less than average for these other segments:
For trips to long-distance terminals, time sensitivity is very high as riders need to catch a plane or train. Because of this, riders are less likely to choose lower cost and slower or less time-certain shared rides. Additionally, airport/train station trips are highly correlated with employer reimbursement, lowering price sensitivity (employers paid for 10.2 percent of non-airport trips versus 34.5 percent of airport trips).
For the location-based price insensitive segments, these are very short trips on average. Trips that start and end in transit competitive areas, for example, are 3.2 miles long on average, compared to 7.4 miles for trips that don't fall into this category. Trips that begin and end in dense office districts are 5.4 miles long on average, compared to 7.0 miles for trips that don't fall into this category. The effect of each additional $1/mile price difference is much higher for longer trips. For example, for trips over 5 miles, each $1/mile price difference results in a 16.5 percentage point increase in the probability of sharing, compared to 8.6 percentage points for all trips.
Because a large share of these trips stays within the region's core (the most transit-competitive portion of most cities) or other business districts, even steep per-mile discounts are not very meaningful in convincing respondents to choose a shared trip. Furthermore, the private trip cost might already be low enough that price sensitivity does not play a major role. On short trips, the schedule risk of sharing could be perceived to be a higher share of total travel time, despite the survey offering the same percentage-based time penalties.
As with price, the effect of time can be analyzed in two manners: by describing the responses riders reported or that were observed to choices presented directly and by using the discrete choice models to ask how TNC users would respond to a different set of choices if they were made available.
The descriptive analysis is shown in figure 6, which reports the share of private TNC users in the dataset that chose a shared option at each of the four levels of travel time differences and price differences offered. The rightmost column matches the values from figure 4, while the other columns add new information. Within each price differential level, lowering travel time penalties has a similar effect on increasing willingness to share. Additionally, the willingness to share increases with increasing discount, as also shown in figure 4.
Over 30 percent of users rejected a shared trip with no time penalty that is 75 percent less expensive than the observed private trip. Once even the lowest tested amount of travel time uncertainty is introduced, this number rises to more than 50 percent of respondents being unwilling to share at a 75 percent discount. This value is even higher at lower levels of discount.
The values in figure 6 may be even lower than expected at lower levels of discount and higher travel time differences, because this analysis includes only users who used a private TNC product for the survey anchor trip. Compared with the population of all TNC users, these users share less in general; 33.1 percent of shared TNC anchor trip users fell within the top quintile for opting in to shared TNC trips in their city, with just 21.3 percent of observed private TNC anchor trip users falling into that group of frequent sharers.
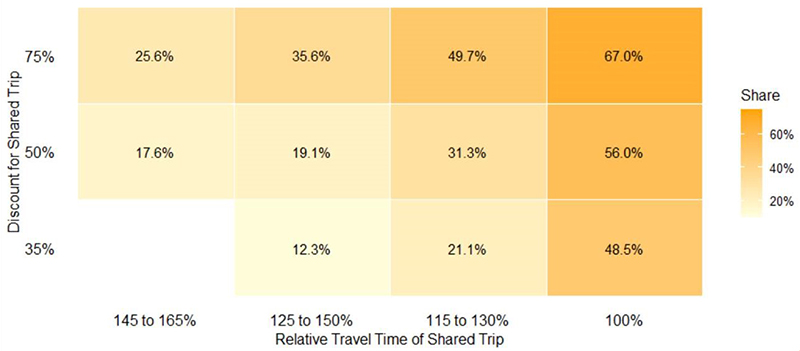
Figure 6. Graph. Share of private transportation network company users in dataset that switched from private to shared travel at each level of travel time difference and price difference offered.
(Source: Federal Highway Administration)

Figure 7. Graph. Effect of 1 minute/mile reduction in relative travel time difference on the percent probability of sharing.
(Source: Federal Highway Administration)
Using the linear results of the discrete choice model, figure 7 presents the effect of an incremental decrease in the travel time differential between shared and private TNC trips on an individual's probability of opting in to the sharing option for various population segments. As with price, this effect is presented on a per-mile basis to normalize for differences in trip length.
According to figure 7, the overall effect of reducing the travel time penalty for shared rides by 1 minute per mile is a 33.25 percentage point increase in probability of sharing. That is, travel time savings of 1 minute per mile increase the probability of sharing for all users from 29.9 percent to 63.2 percent (see initial sharing rates in Table 6). Although it is difficult to compare the relative effects of time and money, it is obvious the effect of a 1-minute savings per mile greatly exceeds that of a one dollar per mile savings for all segments (discussed in greater detail in the following section on Relative Effect of Price and Time).
In a dense urban environment, a minute-per-mile travel time improvement may be difficult to achieve. For instance, if average speeds were 15 miles per hour (including stoplights, etc.), each mile would take 4 minutes to travel. Improving this speed by a minute-per-mile would raise average speeds 33 percent to 20 miles per hour. In a less urban context, average speeds of 30 miles per hour would need to be increased to 60 miles per hour to achieve the 1-minute-per-mile improvement—an impossibility under almost any plausible scenario. As such, travel time differentials would be more likely to come from changes in waiting time or matching time for shared versus private rides.
Although the overall effect of a 1 minute-per-mile decrease in the shared ride travel time penalty is quite large, the effect of decreasing travel time penalties is even greater for the following segments:
Of the segments chosen for reporting in figure 5 and Figure 7, only the lower-income segment exhibits lower effects of reducing time differentials between shared and private products than the average response. The lower effect shows that this segment is less time sensitive than the average survey respondent, although they would still be 20 percentage points more likely to share if the time difference was reduced 1 minute per mile.
The other segments place a higher than average value on travel time. If the travel time difference between shared and private trips was reduced by 1 minute per mile, these findings suggest these groups would be willing to change products at a rate even higher than by 33 percentage points.
The tables and figures presented point to the finding that, in general, riders appear to place a very high value on their travel time (and presumably on travel time reliability although it was not tested directly through the choice questions). This finding is not surprising in light of the survey responses summarized in table 7, which showed that the risk of delay is the most common deterrent to using the shared TNC option. Nearly half of all private TNC users surveyed indicated that they chose a private ride because of the risk that a shared ride would take longer, while only a quarter of private TNC users indicated that they were motivated by price. Other literature has also shown time to be a more powerful motivator than price in sharing rides; a recent study of Waze™ users by Cohen et al. found that saving commute time was more effective than compensation in encouraging affinity to carpool.27
A simple example helps illustrate the relative effect of price and time changes, as shown in table 8. According to figure 5, a $1/mile per trip price difference corresponds to an 8.6 percentage point increase in the probability of sharing. A price difference of $1.16 per mile would increase the probability of sharing for general trips by 10 percentage points (from roughly 30 percent of trips to roughly 40 percent).28 With an average price per mile of $3.30, this additional price difference represents a 35.1 percent reduction in the price of shared rides.
| Reasons I chose a private ride over a shared ride | Percent |
|---|---|
| There was a chance that it was going to take a lot longer and that uncertainty is too risky | 49.5% |
| The shared option was too much slower than the private option | 29.2% |
| The discount was not big enough | 24.6% |
| I prefer not to share my trip with a stranger | 21.7% |
| I didn't see the shared option in the app | 6.5% |
| I don't understand what the shared option is | 0.0% |
Considering travel time, figure 7 shows that the overall effect of reducing the travel time penalty for shared rides 1 minute per mile is a 33.25 percentage point increase in probability of sharing. A travel time difference of 0.30 minutes (18 seconds) per mile would also increase the probability of sharing for general trips by 10 percentage points (again, from roughly 30 percent of trips to 40 percent). With an average trip speed of 23.8 mph (or 151 seconds per mile), this represents an 11.9 percent reduction in relative travel time for shared rides.
| Factor | Price | Time |
|---|---|---|
| Unit of change | Dollar/mile | Minute/mile |
| Unit effect on sharing | 8.6% | 33.3% |
| Initial level of sharing | 30% | 30% |
| Desired level of sharing | +10% (to 40%) | +10% (to 40%) |
| Required change to increase sharing | $1.16/mile | 18 s/mile |
| Initial price and travel speed | $3.30/mile | 151 s/mile (23.8 mph) |
| Percent change to price and travel speed | 35.10% | 11.90% |
According to this example, the findings of the discrete choice model imply a relative effectiveness of changes in travel time and price differences. Specifically, comparing the change necessary to increase sharing by 10 percentage points is either a $1.16 per mile price differential or 18 seconds per mile time differential increase. Comparing these values results in a ratio of $3.86 per minute, which is equivalent to $231.97 per hour. This number is not equivalent to a value-of-time measure, but rather a simple comparison of the changes in price and travel time necessary to produce equivalent changes in sharing.
This measure has several limitations, particularly the complicating factor of the lived experience of sharing a ride with a stranger possibly detracting from user satisfaction, separate from the time penalty. By comparing the effect of price differential and travel time penalties, this ratio represents the amount that respondents were willing to pay to reach their destinations more quickly (and privately). Because all price and time differentials were presented relative to the private trip as part of a shared product option, the desire for privacy (which might also have a per-mile value) is not separable from the desire for faster arrival. Because shared choices were presented with fixed uncertainty bands at the different travel time penalty levels, the effect of uncertainty and delay can also not be separated in the TNC's choice survey. These limitations are discussed more in the earlier subsection, Limitations of Approach.
To place this value ($231.97) in context, it is also useful to consider an otherwise unused element of the dataset collected: the choice of one shared ride option over other shared ride options, particularly in the case where riders preferred a shared ride with a longer travel time and a lower price to a shared ride with a faster travel time and a higher price. This data holds mode constant, as all choices are between different shared options. Thus, it is possible to compare the savings a user accepted (i.e., the rejected higher cost minus the preferred lower cost, or $3.26 on average) by the delay that they also accepted (i.e., the preferred longer travel time minus the rejected slower travel time, or 3.16 minutes on average), or vice versa. The resulting ratio represents a ceiling on the user's willingness to pay to avoid additional travel time in a shared ride because a user with a higher willingness to pay would have chosen the faster, higher cost ride. A user with a lower willingness to pay would still have selected the cheaper, longer ride. In the choice data, this ratio amounts to a ceiling of $83.37 per hour—the average minimum discount needed for users to switch to a shared ride. Like the value $231.97, this estimate also has its limitations because no discounts smaller than 35 percent were tested in the study, meaning that users may have a lower willingness to pay than the study observed. It is also possible to analyze this data by considering each of the "pairwise" choices between different shared ride options presented to survey respondents.29 Considering the average trip cost and average travel time, it is possible to calculate the implied value of time for each of these pairwise choices. Depending on which of the two options the respondent selected, this value of time is either a floor or a ceiling (i.e., one choice may offer the user the chance to pay $14 per hour to save time; if a user rejects that offer, then the user's value of time is below that threshold and vice versa).
Considering value-of-time ceilings, table 9 and table 10 show the percentage of respondents that accepted the lower-cost, longer-travel option in each pairwise choice (for respondents whose last trips were private and shared, respectively). According to Table 9, a small share of respondents (18.9 percent) have low values of time (below a ceiling of $14.24), and a large share have ceilings below $139.19 (70.1 percent). Implied values of time are generally lower in Table 10, with more than half of respondents implying a value of time under $10.62 and 91.8 percent implying a value of time under $57.82. These findings are consistent with the expectation that customers whose last TNC trip was private would on average have a higher VOT.
Because this choice data controls for mode (i.e., private or shared TNC), it enables further exploration of consumer preferences among shared options. Exploration of this data could help guide service offerings and encourage more customers to make a shared ride choice (e.g., offering service standard guarantees that limit delay as a higher-priced shared-ride product option, where those paying more for their shared rides are promised a more direct trip).
However, this dataset carries three major limitations. First, different alternatives were presented to users whose last trip was private versus shared, so the results are not precisely comparable between these two types of respondents. Second, over multiple survey questions, users were presented shared options reflecting different time and price tradeoffs, and user preferences were not always consistent. That is, sometimes respondents accepted a time delay implying a lower value of time than rejected when presented a different choice set. Third, survey questions were typically presented as a triplet that included one private trip option and two shared trip options. As a result, the stated preference of one shared trip option over another only applies to cases where a respondent chose one of the shared options (over both one other shared option and one private option). Respondents who chose a private trip in every triplet of questions, for example, would not be represented in this data at all, which would skew downward the average implied value of time.
| Pair | Discount (Accepted) | Discount (Rejected) | Travel Time Penalty (Accepted) | Travel Time Penalty (Rejected) | Average Value of Time (VOT) Ceiling (Implied) | Percent of Responses |
|---|---|---|---|---|---|---|
| 1 | 50.0% | 35% | 55.0% | 0.0% | $14.24 | 18.9% |
| 2 | 75% | 50% | 55.0% | 0.0% | $23.73 | 22.9% |
| 3 | 50% | 35% | 22.5% | 0.0% | $34.80 | 36.6% |
| 4 | 75% | 50% | 55.0% | 22.5% | $40.15 | 40.0% |
| 5 | 50% | 35% | 55.0% | 37.5% | $44.74 | 55.7% |
| 6 | 50% | 35% | 37.5% | 22.5% | $52.20 | 53.2% |
| 7 | 75% | 50% | 22.5% | 0.0% | $58.00 | 47.2% |
| 8 | 75% | 50% | 55.0% | 37.5% | $74.57 | 59.1% |
| 9 | 75% | 50% | 37.5% | 22.5% | $86.99 | 59.3% |
| 10 | 75% | 35% | 22.5% | 0.0% | $92.79 | 58.6% |
| 11 | 75% | 35% | 37.5% | 22.5% | $139.19 | 70.1% |
| Pair | Cost Mark-Up (Accepted) | Cost Mark-up (Rejected) | Time Penalty (Accepted) | Time Penalty (Rejected) | Average Value of Time (VOT) Ceiling (Implied) | Percent of Responses |
|---|---|---|---|---|---|---|
| 1 | 20% | 35% | 35% | 0.0% | $10.62 | 55.7% |
| 2 | 0% | 20% | 35% | 0.0% | $14.16 | 57.3% |
| 3 | 20% | 35% | 20% | 0.0% | $18.58 | 92.3% |
| 4 | 20% | 35% | 35% | 20.0% | $24.78 | 73.2% |
| 5 | 0% | 20% | 20% | 0.0% | $24.78 | 69.0% |
| 6 | 0% | 35% | 35% | 0.0% | $24.78 | 80.7% |
| 7 | 0% | 20% | 35% | 20.0% | $33.04 | 80.0% |
| 8 | 0% | 35% | 20% | 0.0% | $43.36 | 87.7% |
| 9 | 0% | 35% | 35% | 20.0% | $57.82 | 91.8% |
TNC trips continue to grow as a share of U.S. travel, with other emerging mobility paradigms suggesting more on-demand ridehailing in the future. The occupancy of on-demand vehicles will thus come to have an increasing impact on our streets. A shared-ride future could alleviate congestion, reduce VMT, lead to better air quality, and improve travel times for all road users.30 A future with primarily private ridehailing, by contrast, may result in far more VMT growth than one with a larger role for sharing. For that reason, it is critical to understand who is currently choosing shared TNC services and where demographic and trip characteristics may encourage greater sharing.
Using this broad sample of 4,365 ridehailing users living in areas where dynamic ridesharing is available, the analysis in this chapter demonstrates which market segments in the weighted sample selected shared and private modes more or less frequently. Multiple studies have found TNC users in general are younger, better educated, higher income, urban, and non-car owning. This chapter also finds that many of these characteristics are associated with higher rates of sharing among TNC users. For example, younger individuals are more likely to use ridehailing and, among ridehailing users, are also more likely to share.31 The opposite is true for annual income; higher-income individuals use ridehailing more, but among ridehailing users, those with lower incomes are more likely to share. The TNC's survey results confirm the conclusions of narrower ridehailing studies that younger riders who do not own cars appear to share with greater frequency. However, where Sarriera et al. found no relationship between income or gender and sharing, the TNC survey finds more sharing among lower-income riders and women.32
This research goes beyond existing literature in determining the sharing behavior of other population segments and trip types. Notably, the TNC survey finds more sharing among passengers who use transit more frequently and for weekend trips, trips from work, trips to home, and "going out" trips (i.e., trips to entertainment or for personal business). Conversely the TNC survey finds less sharing among two-person rider parties and for employer-paid trips, morning trips, shorter trips, trips to work, and trips connecting to long-distance modes.
These findings are compatible with other research findings and common expectations on travel behavior and preferences. Higher-income travelers, for example, have a corresponding higher value of time, and thus would be expected to prefer a private mode with faster travel times, even if it is more expensive. Riders traveling to the airport or to work in the morning are also less price sensitive, likely because their arrival time is important. On the other side of the issue, the data demonstrate that riders who use transit more frequently also share more frequently, possibly at least partially because they are both more price sensitive and more comfortable sharing public space with strangers. Riders without access to a vehicle—a trait correlated with transit use—also share more frequently, likely because they have lower income or because they are frequent TNC users in general and are looking to save money.
Beyond descriptive analysis of sharing rates by type of trip and user, the results presented in this chapter explore the impact of changing the relative modal characteristics of private and shared TNC trips, particularly price and travel time. This study finds that an increase in the relative price difference of $1 per mile increases an individual's probability of sharing by over 8 percentage points. A decrease in the relative travel time of 1 minute per mile has a much larger effect. On the scale of an entire metropolitan area, such a shift could have a noticeable impact on travel behavior and VMT. With an average trip length of 5.6 miles, an additional discount of over $5 per trip or a travel time savings of over 5 minutes represents a significant change in TNC operations and thus may seem hard to come by.
One valuable aspect of these findings is that they also provide planners and policymakers with the ability to identify which types of TNC trips and TNC users are likely to be more influenced by price- and time-based changes in ridesharing characteristics. While the market segmentation results show what trip types are already likely to be shared (e.g., social trips and weekend trips), the TNC scenario results shows what trip types could beconverted to shared trips with the least change in modal characteristics. For example, while riders to airports and other intermodal centers are relatively price insensitive, riders traveling from these centers may be more influenced by price-based incentives, even though these trips are currently more likely to be private rides, creating a unique opportunity for incentivizing sharing. (In the case of airports, though, the combination of passengers arriving in private TNCs and returning in shared TNCs might just lead to many TNCs—except the shared ones—returning empty after airport drop-offs.)
The TNC's survey results also show that a sizeable portion of private TNC trips (approximately 35 percent, as shown in figure 6) will be difficult or even impossible to convert to shared rides through a price-based incentive. That is, for some trips, even a 75 percent discount—the greatest offered in the survey—is not enough to convince some riders to switch from a private to a shared ride, even when they are told the travel time would match the private option. This study's cross-tabulations show that these riders are more likely to be older, higher-income, and infrequent transit users. Price incentives also appear to be less effective for shorter trips, likely because such trips are already low-cost relative to longer trips and the overall levels of discount in dollar terms are small even if the per mile rates are not. For these price-insensitive trips and users, travel time-based policies, such as enforced delays for private TNC pick-ups or dedicated travel lanes for shared TNCs, are likely to be more effective in encouraging sharing.
This research offers important opportunities and challenges to planners and policymakers seeking to increase the occupancy of vehicles on the road and thereby optimize the use of the existing transportation network. To that end, chapter 4 uses the results from this chapter to estimate the effect of a wide range of scenarios on the use of shared rides.
Through the use of smartphone applications, stated preference surveys anchored off of real trips can likely provide more accurate results than typical stated preference surveys because they incorporate the genuine context of trips. Taking advantage of that strength, the discrete choice modeling approach used in this study explored changes in mode choice that might occur as a result of changes in the relative price of TNCs. However, despite the strength of the stated preference methodology, we note several limitations to this work and suggest possible avenues for future research.
First, our data are only a snapshot in time of a TNC user base that was growing rapidly during the study period, with a 37 percent increase from 2016 to 2017 in passengers transported. As this user base changes and TNCs alter their services, our descriptive analysis will need to be updated to reflect the point-in-time reality of travel behavior.
Further longitudinal/panel research would support an understanding of how sharing behavior changes over time. Second, the study does not attempt to explain why TNC users do or do not share in response to price, time or any number of other factors. We do not assert any causal relationships between market segments and observed sharing behavior. Although it is beyond the scope of this study to draw conclusions as to whether these characteristics explicitly cause sharing, this research points the way for further experimentation with price- and time-based ridesharing incentives in controlled environments.
1 Schaller, B. (2018). The New Automobility: Lyft, Uber, and the Future of American Cities. [ Return to Note 1 ]
2 Conway, M.W., Salon, D., and King, D.A. (2018). "Trends in Taxi Use and the Advent of Ridehailing, 1995–2017: Evidence from the U.S. National Household Travel Survey." [ Return to Note 2 ]
3 Henao, A. (2017). Impacts of Ridesourcing–Lyft and Uber–on Transportation Including VMT, Mode Replacement, Parking, and Travel Behavior. [ Return to Note 3 ]
4 Rayle, L., Dai, D., Chan, N., Cervero, R., and Shaheen, S. (2016). "Just a Better Taxi? A Survey-Based Comparison of Taxis, Transit, and Ridesourcing Services in San Francisco." [ Return to Note 4 ]
5 Schaller, B. (2018). [ Return to Note 5 ]
6 Clewlow, R.R. and Mishra, G.S. (2017). Disruptive Transportation: The Adoption, Utilization and Impacts of Ride-Hailing in the United States. [ Return to Note 6 ]
7 Young and Farber (2019). [ Return to Note 7 ]
8 Kooti, F., Grbovic, M., Aiello, L.M., Djuric, N., Radosavljevic, V., and Lerman, K. (2017, April). "Analyzing Uber's Ride-sharing Economy." [ Return to Note 8 ]
9 Moody, J. and Zhao, J. (2019). "Adoption of Private and Shared Ridehailing in Singapore and the U.S." [ Return to Note 9 ]
10 Dias, F.F., Lavieri, P.S., Garikapati, V.M., Astroza, S., Pendayala, R.M., and Bhat, C.R. (2017). "A Behavioral Choice Model of the Use of Car-sharing and Ride-sourcing Services." [ Return to Note 10 ]
11 Alemi, F., Circella, G., Handy, S., and Mokhtarian, P. (2017). "What Influences Travelers to Use Uber? Exploring the Factors Affecting the Adoption of On-Demand Ride Services." [ Return to Note 11 ]
12 Amirkiaee, S.Y. and Evangelopoulos, N. (2018). "Why Do People Rideshare? An Experimental Study." [ Return to Note 12 ]
13 Sarriera, J.M., Álvarez, G.E., Blynn, K., Alesbury, A., Scully, T., and Zhao, J. (2017). "To Share or Not to Share: Investigating the Social Aspects of Dynamic Ridesharing." [ Return to Note 13 ]
14 Moody, J., Middleton, S., and Zhao, J. (2019). "Rider-to-Rider Discriminatory Attitudes and Ridesharing Behavior." [ Return to Note 14 ]
15 Liu, Y., Bansal, P., Daziano, R., and Samaranayke, S. (2018). "A Framework to Integrate Mode Choice in the Design of Mobility-on-Demand Systems." [ Return to Note 15 ]
16 Alonso-González, M., Cats, O., Van Oort, N., Hoogendoorn-Lanser, S., and Hoogendoorn, S. (2019). "Willingness to Share Rides in On-demand Services for Different Market Segments." [ Return to Note 16 ]
17 Hou, Y., Garikapati, V., Weigl, D., Henao, A., Moniot, M., and Sperling, J. (2020). "Factors Influencing Willingness to Share in Ride-Hailing Trips." [ Return to Note 17 ]
18 Hou et al. found that median shared rides in Chicago cost approximately 66 percent the cost of a private ride. [ Return to Note 18 ]
19 Moody, J., Middleton, S., and Zhao, J. (2019). "Rider-to-Rider Discriminatory Attitudes and Ridesharing Behavior." [ Return to Note 19 ]
20 This value is the ratio of the EPA's Smart Location Database's Regional Transit Centrality Index (D5dei) to the Regional Automobile Centrality Index (D5cei). Both D5dei and D5cei represent a Census Block Group's modal destination score relative to the maximum score for the core-based statistical area. [ Return to Note 20 ]
21 Henao, A. and Marshall, W.E. (2018). "The Impact of Ride-Hailing on Vehicle Miles Traveled." [ Return to Note 21 ]
22 Balding, M., Whinery, T., Leshner, E., and Womeldorff, E. (2019). "Estimated TNC Share of VMT in Six US Metropolitan Regions (Revision 1)." [ Return to Note 22 ]
23 Henao, A. and Marshall, W.E. (2018). [ Return to Note 23 ]
24 Young and Farber (2019). [ Return to Note 24 ]
25 Defined as relative office and industrial employment density for the market at the origin and/or destination (greater than 90th percentile of the metropolitan area). [ Return to Note 25 ]
26 Defined according to the EPA's Smart Location Database's regional centrality index by transit, relative to automobile centrality at the origin and destination (less than 90th percentile of the metropolitan area). The EPA defines regional centrality as proportional accessibility to regional destinations by auto and transit, respectively. Kevin Ramsey and Alexander Bell, EPA Smart Location Database Version 2.0 User Guide. March 14, 2014. https://www.epa.gov/sites/production/files/2014-03/documents/sld_userguide.pdf. [ Return to Note 26 ]
27 Cohen, M., Fiszer, M., Ratzon, A., and Sasson, R. (2019). Incentivizing Commuters to Carpool: A Large Field Experiment with Waze. [ Return to Note 27 ]
28 The actual portion of observed trips that were shared was 29.9 percent, but 30 percent is used here for the simplicity of illustrating the concept. [ Return to Note 28 ]
29 Respondents whose last trip was private were presented with 11 different choices. Respondents whose last trip was shared were presented with nine different choices. [ Return to Note 29 ]
30 Schaller, B. (2018). [ Return to Note 30 ]
31 Hou, Y. et al (2020). [ Return to Note 31 ]
32 Sarriera, J.M. et al (2017). [ Return to Note 32 ]
|
United States Department of Transportation - Federal Highway Administration |
||