Freight Mobility Trends Report 2019
APPENDIX B: MAJOR FREIGHT HIGHWAY BOTTLENECKS AND CONGESTED CORRIDORS—FULL REPORT
Table 35 lists the 2019 top Interstate bottlenecks and congested corridors in the United States based on truck hours of delay per mile for 2019.
Delay per mile (DPM) is calculated for each Interstate segment using the 2019 National Performance Management Research Data Set (NPMRDS) travel time data in the Freight Mobility Trends (FMT) tool in the following manner:
- Delay is calculated for each 15-minute time period as the difference between actual travel time and reference travel time. Reference travel time is based on 85th percentile speed during off-peak and overnight time periods.
- Delay for each 15-minute time period is multiplied by 15-minute truck volumes. Truck volumes are estimated from Annual Average Daily Truck Traffic (AADTT) using typical time-of-day traffic volume profiles. Delay for each 15 minute time period is aggregated to get annual truck hours of delay.
- The total truck hours of delay are then divided by the segment length to get total truck hours of delay per mile, allowing for the comparison of all roadway sections across the National Highway System (NHS).
These locations were then compared with the bottlenecks identified by States in their 2018 Baseline Performance Reports.
Table 35 lists the route, urban area, and State ordered by 2019 truck hours of delay per mile. Information is provided for the directional AADTT, annual truck hours of delay per mile, Planning Time Index (PTI), Buffer Index (BI), Travel Time Index (TTI), Truck Reliability Index (TRI), and total corridor congestion cost per year. Annual truck hours of delay per mile is determined at the most congested segment of the corridor. Total corridor congestion cost is calculated for the full extent of delay along the congested corridor, which may include multiple segments, as a function of both the time and fuel used while the truck is in congested traffic, factoring costs of personnel, commercial vehicle operation, and wasted fuel. Definitions of these categories and indicators appear after the table, as do maps of the top 40 bottlenecks.
Table 35. Major Interstate freight highway bottlenecks and congested corridors based on truck hours of delay per mile in the 2019 National Performance Management Research Data Set.
Note: Congestion cost includes wasted time and not fuel for this report version.
2019
Rank |
2018
Rank |
Road |
Urban Area |
State |
Generalized Bottleneck Location/ Congested Corridor |
AADT
(Trucks) |
DPM
(Truck Hours) |
Total Corridor Congestion Cost ($) |
| 1 |
1 |
I-95/ I-295 |
New York |
NY/NJ |
I-278/I-678 to NJ side of GW Bridge/SR-4 |
9,555 |
263,116 |
76,000,000 |
| 2 |
3 |
I-90/ I-94 |
Chicago |
IL |
I-94 N to I-55 |
8,003 |
140,942 |
86,900,000 |
| 3 |
4 |
I-605 |
Los Angeles |
CA |
I-5 to SR-60 |
10,963 |
139,777 |
62,500,000 |
| 4 |
2 |
I-35 |
Austin |
TX |
Airport Blvd. to Stassney Ln. |
11,074 |
111,359 |
109,900,000 |
| 5 |
6 |
I-610 |
Houston |
TX |
I-69 to I-10 |
7,379 |
104,009 |
60,800,000 |
| 6 |
5 |
I-678 |
New York |
NY |
I-495 to Belt Pkwy. and I-295/I-95 to south end Bronx-Whitestone Bridge |
6,510 |
100,237 |
40,000,000 |
| 7 |
11 |
I-405 |
Los Angeles |
CA |
I-105 to SR-42
Manchester Blvd. |
12,139 |
95,686 |
147,800,000 |
| 8 |
7 |
I-290 |
Chicago |
IL |
I-90/I-94 to I-290 |
8,726 |
94,778 |
59,700,000 |
| 9 |
8 |
I-69/ US 59 |
Houston |
TX |
Buffalo Speedway to I-45 |
6,831 |
89,185 |
57,800,000 |
| 10 |
12 |
I-278 |
New York |
NY |
I-95/I-678 to Grand Central Pkwy. and SR 27 Prospect Expy. to SR-29 Queens Blvd. |
6,607 |
88,339 |
147,000,000 |
| 11 |
9 |
I-24 |
Nashville |
TN |
US-41 to SR-155 |
12,775 |
86,920 |
52,200,000 |
| 12 |
10 |
I-10 |
Los Angeles |
CA |
20th St. to I-5 and at I-605 |
7,036 |
86,745 |
164,100,000 |
| 13 |
15 |
I-710 |
Los Angeles |
CA |
Cesar Chavez Ave. to Atlantic Blvd. |
6,833 |
85,730 |
47,500,000 |
| 14 |
23 |
I-45 |
Houston |
TX |
US-90 to I-69 |
7,184 |
84,471 |
58,800,000 |
| 15 |
17 |
I-680 |
San Francisco |
CA |
SR-262 to SR-238 |
6,406 |
81,240 |
14,000,000 |
| 16 |
25 |
I-495 |
New York |
NY |
Little Neck Pkwy. to Queens Midtown Tunnel |
8,988 |
70,916 |
112,400,000 |
| 17 |
21 |
I-5 |
Seattle |
WA |
I-90 to 85th St. and SR 18 to Port of Tacoma Rd. |
6,876 |
69,732 |
62,500,000 |
| 18 |
14 |
I-5 |
Los Angeles |
CA |
SR-134 Ventura Fwy. to I-605 |
7,097 |
68,560 |
123,200,000 |
| 19 |
20 |
I-76 |
Philadelphia |
PA |
University Ave. to US-1 |
4,605 |
67,019 |
37,500,000 |
| 20 |
19 |
I-87 |
New York |
NY |
I-278 to 230th St. |
4,900 |
64,891 |
25,100,000 |
| 21 |
27 |
I-105 |
Los Angeles |
CA |
I-405 to Long Beach Blvd. |
7,397 |
64,807 |
56,800,000 |
| 22 |
22 |
I-75 I-85 |
Atlanta |
GA |
I-20 to I-75/I-85 split |
7,355 |
63,432 |
19,300,000 |
| 23 |
34 |
I-10 |
New Orleans |
LA |
I-610 to Pontchartrain Expy. |
14,179 |
61,114 |
73,000,000 |
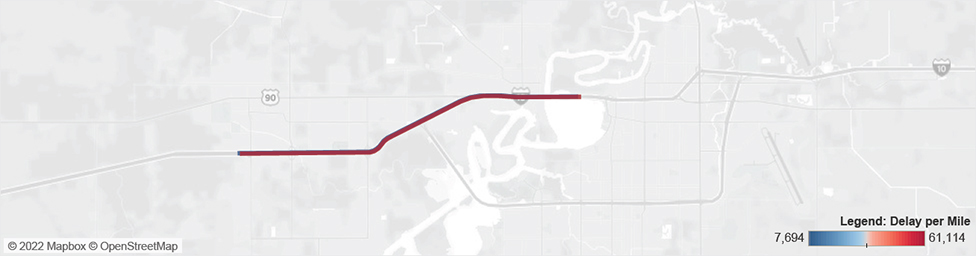
| 24 |
73 |
I-10 |
Lake Charles |
LA |
At I-210 |
14,179 |
61,114 |
31,500,000 |
| 25 |
26 |
I-210 |
Los Angeles |
CA |
SR-39/164 Azusa Ave. to SR-19 Rosemead Blvd. |
10,007 |
60,414 |
67,600,000 |
| 26 |
18 |
I-10 |
Baton Rouge |
LA |
I-110 to SR-1 |
10,718 |
57,724 |
33,800,000 |
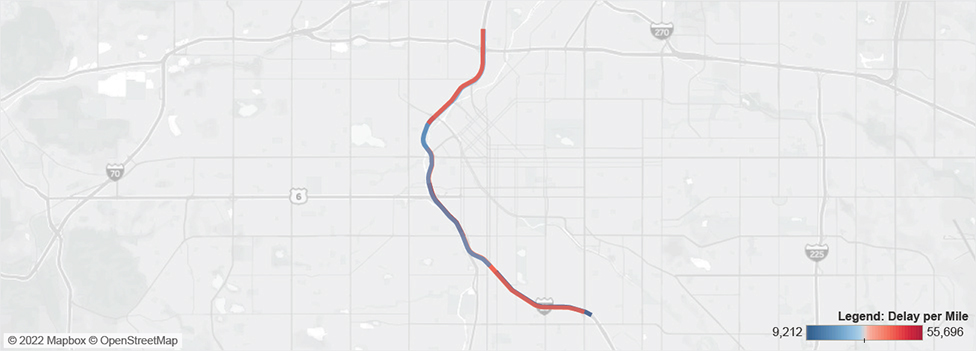
| 27 |
32 |
I-25 |
Denver |
CO |
I-70 to University Blvd. |
7,030 |
55,696 |
54,200,000 |
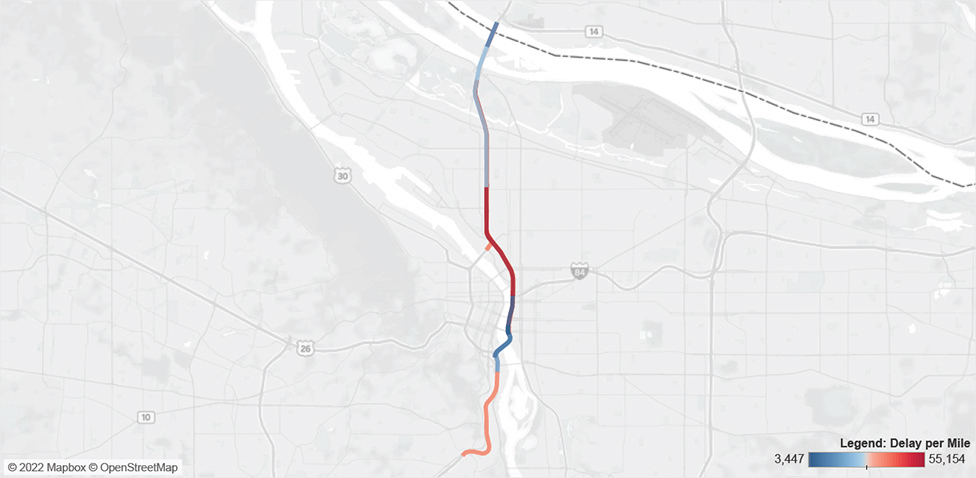
| 28 |
29 |
I-5 |
Portland |
OR |
Columbia River to Terwilliger Blvd. |
7,988 |
55,154 |
53,100,000 |
| 29 |
31 |
I-55 |
Chicago |
IL |
I-94 to SR-171 |
7,376 |
53,860 |
58,300,000 |
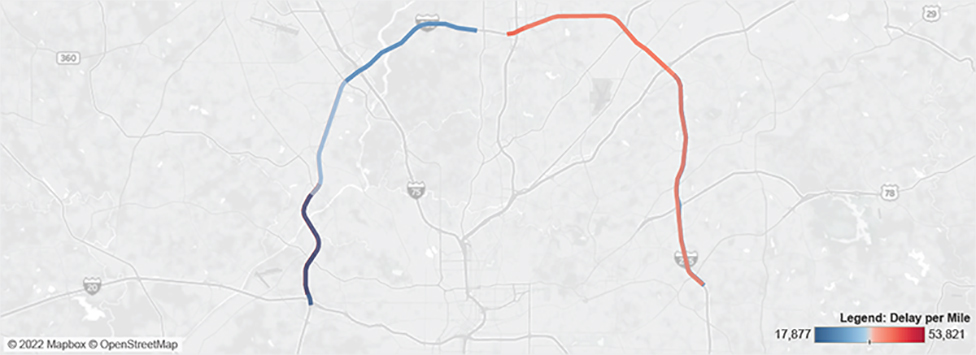
| 30 |
37 |
I-285 |
Atlanta |
GA |
East/SR-400 to
US-78 and West/I-20 to Northside Dr. |
11,855 |
53,821 |
137,500,000 |
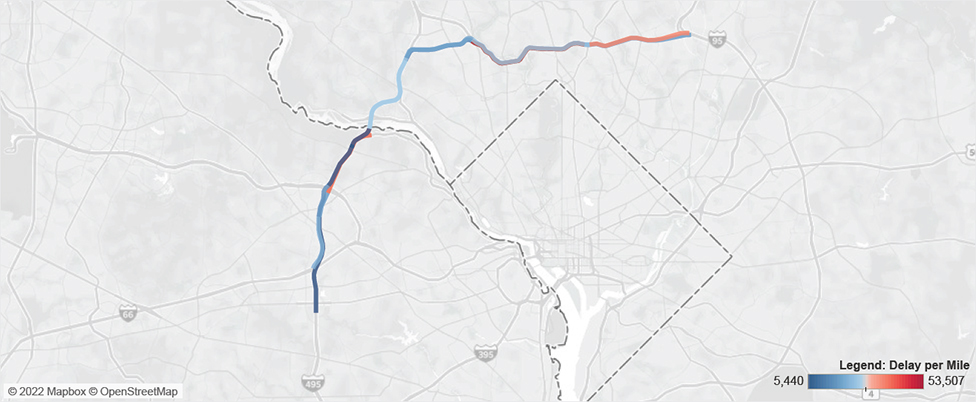
| 31 |
46 |
I-495 |
Washington |
MD/ VA |
I-66 (VA) to I-95 (MD) |
9,544 |
53,507 |
93,900,000 |
| 32 |
33 |
I-70 |
Denver |
CO |
I-25 to I-270 |
5,973 |
53,461 |
26,700,000 |
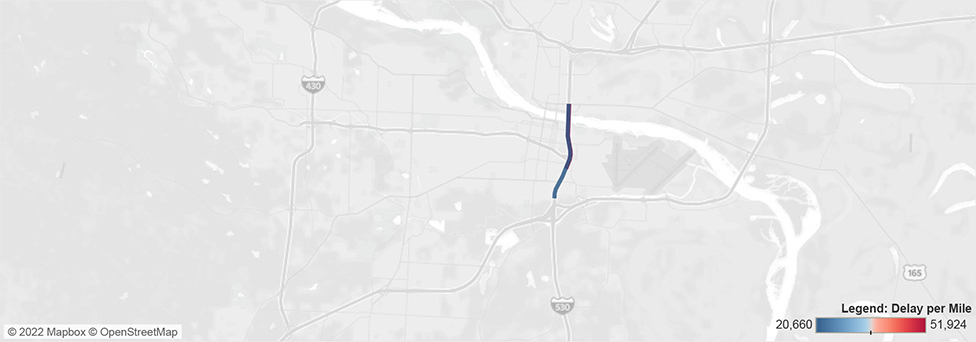
| 33 |
55 |
I-30 |
Little Rock |
AR |
At I-630 |
19,820 |
51,924 |
11,700,000 |
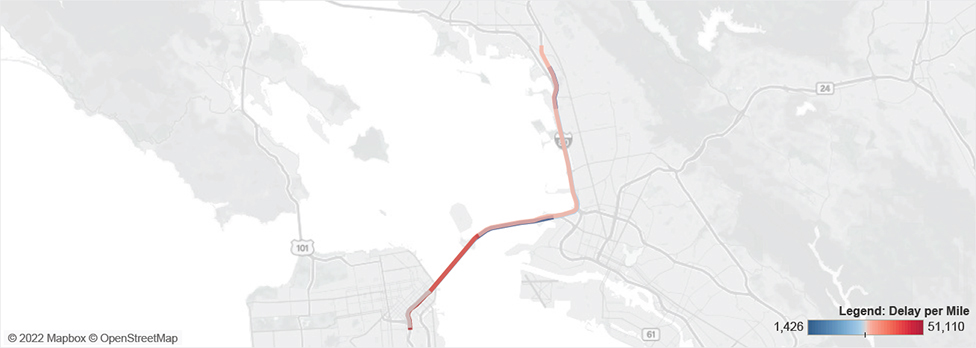
| 34 |
35 |
I-80 |
San Francisco |
CA |
US-101 to Bay Bridge; and at I-580 |
2,737 |
51,110 |
35,200,000 |
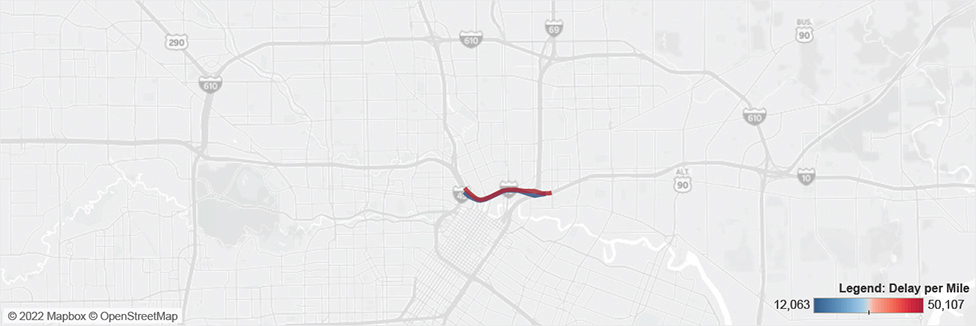
| 35 |
39 |
I-10 |
Houston |
TX |
I-69 to I-45 |
9,085 |
50,107 |
53,700,000 |
| 36 |
40 |
I-270 |
Denver |
CO |
I-25 to I-70 |
5,364 |
50,104 |
14,500,000 |
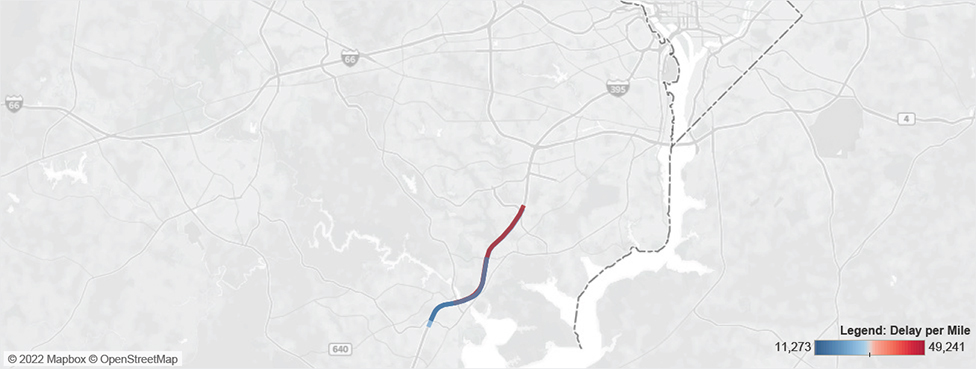
| 37 |
47 |
I-95 |
Washington |
VA |
SR-123 to SR-286 |
8,092 |
49,241 |
49,800,000 |
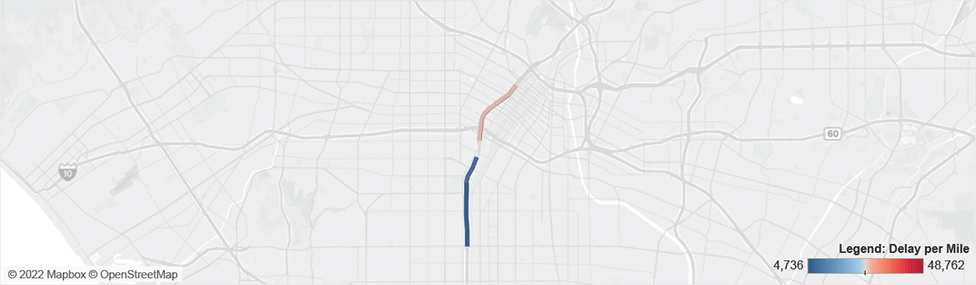
| 38 |
24 |
I-110/ CA-110 |
Los Angeles |
CA |
I-10 to SR-42 Stauson Ave. |
3,890 |
48,762 |
23,100,000 |
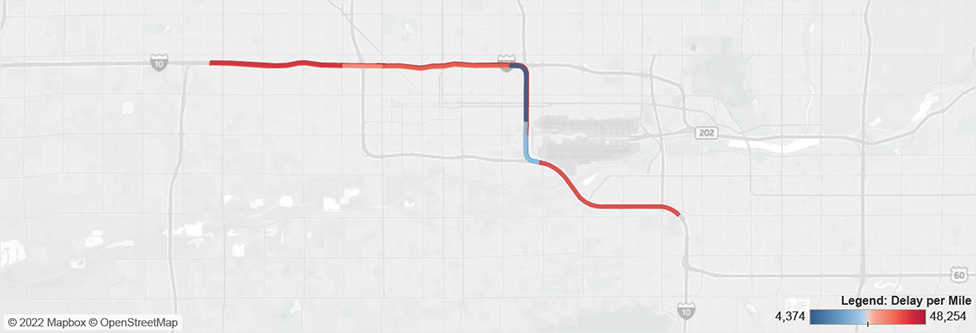
| 39 |
36 |
I-10 |
Phoenix |
AZ |
At I-17 from 51st Ave. to SR-143 |
11,718 |
48,254 |
91,200,000 |
| 40 |
45 |
I-15 |
Riverside |
CA |
At SR-91 |
5,267 |
48,175 |
18,600,000 |
| 41 |
30 |
I-15 |
Salt Lake City |
UT |
At I-215 (SR-173 to SR 48) |
32,835 |
47,435 |
62,139,000 |
| 42 |
44 |
I-15 |
Los Angeles |
CA |
At I-10 |
9,099 |
47,170 |
12,700,000 |
| 43 |
59 |
I-80/ I-94 |
Chicago |
IL |
I-294 to I-94 |
20,900 |
46,615 |
9,100,000 |
| 44 |
50 |
I-695 |
Baltimore |
MD |
I-95 to I-795 |
10,497 |
46,428 |
45,400,000 |
| 45 |
57 |
I-71/ I-75 |
Cincinnati |
KY/ OH |
I-275 to Western Hills |
15,297 |
44,603 |
18,300,000 |
| 46 |
81 |
I-90 |
Chicago |
IL |
I-90/94 to I-294 |
3,595 |
43,345 |
32,300,000 |
| 47 |
51 |
I-64 |
St. Louis |
MO |
Market St. to I-70 (over Mississippi River) |
9,240 |
42,771 |
9,100,000 |
| 48 |
28 |
I-294 |
Chicago |
IL |
At I-290 and at I-90 |
9,449 |
42,295 |
40,900,000 |
| 49 |
61 |
I-405 |
Seattle |
WA |
I-90 to SR-520 |
4,796 |
40,760 |
12,800,000 |
| 50 |
127 |
I-75 |
Chattanooga |
TN |
At I-24 |
11,798 |
40,747 |
6,000,000 |
| 51 |
65 |
I-676 |
Philadelphia |
PA |
I-76 to I-95 |
3,695 |
40,448 |
7,300,000 |
| 52 |
56 |
I-238 |
San Francisco |
CA |
I-880 to I-580 |
9,026 |
40,088 |
4,600,000 |
| 53 |
64 |
I-35 |
San Antonio |
TX |
At I-10 |
13,515 |
39,338 |
24,300,000 |
| 54 |
53 |
I-494 |
Minneapolis |
MN |
SR-77 to W Bush Lake Rd. |
6,142 |
38,514 |
9,000,000 |
| 55 |
58 |
I-85 |
Atlanta |
GA |
I-75 to SR 13/141 and I 285 to SR-378 |
8,539 |
37,663 |
35,700,000 |
| 56 |
48 |
I-35E |
Dallas |
TX |
I-30 to Market Center Blvd. |
7,786 |
37,601 |
24,900,000 |
| 57 |
54 |
I-635 |
Dallas |
TX |
I-35 to SR-78 |
10,114 |
37,059 |
61,400,000 |
| 58 |
42 |
I-95 |
Baltimore |
MD |
I-395 to I-895 |
9,481 |
36,203 |
34,900,000 |
| 59 |
79 |
I-95 |
Philadelphia |
PA |
At I-676 |
5,085 |
35,789 |
11,900,000 |
| 60 |
67 |
I-270 |
St. Louis |
MO |
I-64 to SR 100 |
17,600 |
35,500 |
28,200,000 |
| 61 |
63 |
I-215 |
Riverside |
CA |
I-10 to SR-80 |
7,241 |
35,057 |
35,300,000 |
| 62 |
38 |
I-75 |
Cincinnati |
OH |
SR-562 to SR-126 |
11,175 |
34,492 |
29,500,000 |
| 63 |
52 |
I-94 |
Chicago |
IL |
I-90/94 to US-14 |
8,000 |
33,752 |
12,900,000 |
| 64 |
74 |
I-880 |
San Francisco |
CA |
At I-980 and at US 101 |
6,035 |
32,983 |
55,800,000 |
| 65 |
70 |
I-24 |
Chattanooga |
TN |
I-75 to US-41 |
11,133 |
32,057 |
18,500,000 |
| 66 |
100 |
I-40 |
Albuquerque |
NM |
At I-25 |
14,443 |
31,823 |
9,700,000 |
| 67 |
72 |
I-805 |
San Diego |
CA |
SR-52 to SR-163 |
6,210 |
31,791 |
13,900,000 |
| 68 |
60 |
I-30 |
Dallas |
TX |
I-35 to Grand Ave. |
9,311 |
31,390 |
14,300,000 |
| 69 |
84 |
I-376 |
Pittsburgh |
PA |
Fort Pitt Bridge to Squirrel Hill |
2,591 |
31,346 |
2,800,000 |
| 70 |
78 |
I-10 |
Riverside |
CA |
At I-215 |
11,505 |
31,196 |
17,300,000 |
| 71 |
75 |
I-84 |
Hartford |
CT |
SR-2 to Prospect Ave. |
5,792 |
29,849 |
7,700,000 |
| 72 |
73 |
I-405 |
Portland |
OR |
I-5 to US-26 |
4,297 |
29,467 |
1,200,000 |
| 73 |
86 |
I-95 |
Wilmington |
DE |
At I-295/I-495 |
12,139 |
28,402 |
2,700,000 |
| 74 |
43 |
I-94 |
Minneapolis |
MN |
SR-280 to Hennepin Ave. |
4,350 |
28,016 |
4,400,000 |
| 75 |
80 |
I-205 |
Portland |
OR |
At I-84 |
5,290 |
27,951 |
7,100,000 |
| 76 |
82 |
I-95 |
Fredericksburg |
VA |
US-17 to Russell Rd. |
9,889 |
27,933 |
20,000,000 |
| 77 |
96 |
I-93 |
Boston |
MA |
At I-90 and at SR-3 |
4,381 |
27,386 |
19,600,000 |
| 78 |
85 |
I-95 |
Bridgeport |
CT |
At US-1 in Fairfield and at US-1 in Stamford |
5,893 |
27,289 |
51,000,000 |
| 79 |
71 |
I-40 |
Nashville |
TN |
I-24 to I-65 |
5,379 |
27,148 |
4,100,000 |
| 80 |
87 |
I-95 |
New Haven |
CT |
I-91 to SR-10 |
6,047 |
26,805 |
2,700,000 |
| 81 |
94 |
I-78 |
New York |
NJ |
US-22 to SR-440 |
6,083 |
26,033 |
6,700,000 |
| 82 |
98 |
I 35W |
Dallas |
TX |
At I-30 |
5,426 |
24,953 |
11,900,000 |
| 83 |
68 |
I-15 |
Ogden |
UT |
SR-232 to SR-273 |
10,303 |
24,114 |
5,995,000 |
| 84 |
88 |
I-75 |
Atlanta |
GA |
I-85 to Moores Mill Rd. |
8,403 |
23,791 |
6,300,000 |
| 85 |
— |
I-65 |
Indianapolis |
IN |
I-70 N to Fall Creek Blvd. |
6,901 |
23,639 |
1,500,000 |
| 86 |
140 |
I-20/ I-59 |
Birmingham |
AL |
At I-65 |
7,435 |
23,124 |
2,500,000 |
| 87 |
119 |
I-270 |
Washington |
MD |
At I-495 |
6,801 |
22,345 |
26,400,000 |
| 88 |
16 |
I-15 |
Las Vegas |
NV |
I-515 to Tropicana Ave. |
6,661 |
22,146 |
17,000,000 |
| 89 |
111 |
I-280 |
New York |
NJ |
Garden State Pkwy. to SR-21 |
4,450 |
22,029 |
2,900,000 |
| 90 |
94 |
I-95 |
Miami |
FL |
Florida Turnpike to I-395 |
4,745 |
21,894 |
29,400,000 |
| 91 |
97 |
I-4 |
Tampa |
FL |
At I-275 |
6,558 |
21,620 |
6,900,000 |
| 92 |
110 |
I-670 |
Kansas City |
MO |
At I-70 |
4,358 |
21,163 |
1,200,000 |
| 93 |
89 |
I-395 |
Washington |
DC/VA |
US-50 to VA-236 |
5,204 |
21,150 |
700,000 |
| 94 |
112 |
I-580 |
Livermore |
CA |
I-205 to First St. |
7,153 |
20,960 |
8,300,000 |
| 95 |
109 |
I-95 |
Washington |
MD |
I-495 to SR-200 |
10,661 |
20,807 |
6,300,000 |
| 96 |
124 |
I-95 |
Boston |
MA |
SR-38 to I-93 |
4,057 |
20,726 |
8,600,000 |
| 97 |
103 |
I-84 |
Portland |
OR |
At I-5 |
4,543 |
20,359 |
3,400,000 |
| 98 |
90 |
I-65 |
Nashville |
TN |
I-40 to I-440 |
10,952 |
20,093 |
13,500,000 |
| 99 |
114 |
I-40 |
Knoxville |
TN |
I-75/I-640 to I-275 |
8,346 |
20,059 |
2,500,000 |
| 100 |
115 |
I-71 |
Columbus |
OH |
At I-670 |
7,597 |
19,511 |
7,300,000 |
Key: annual average daily traffic (AADT), delay per mile (DPM)
Table 35 uses the following definitions, which are the same as those used to develop the results in this report:
- Generalized bottleneck location/ congested corridor and length—the extent of congestion for the corridor caused by one or more bottlenecks, estimated based on review of corridor congestion scans in the NPMRDS. For major congested corridors, this may include multiple contiguous bottlenecks.
- Annual Average Daily Traffic (AADT) (trucks)—the NPMRDS directional (single unit and combination) trucks conflated from the Highway Performance Monitoring System (HPMS).
- Annual truck hours of delay/mile—the difference between actual travel time and reference travel time (free-flow travel time), multiplied by truck volumes and then divided by the segment length. For larger bottlenecks that span multiple roadway segments, delay is provided for the most congested segment and direction of the bottleneck, not the full corridor.
- Planning time index—the ratio of the 95th percentile travel time to the reference travel time (free-flow travel time), computed during the AM and PM peak periods.
- Buffer index—represents the extra time (or time cushion) that travelers must add to their average travel time when planning trips to ensure on-time arrival.
- Travel time index—the ratio of the peak-period travel time to the reference travel time (free-flow travel time), computed for the AM and PM peak periods.
- Travel reliability index—calculated the same as the Moving Ahead for Progress in the 21st Century (MAP-21) performance measure for truck travel time reliability, as the ratio of the 95th percentile travel time to the 50th percentile travel time during five different time periods of the day. Results will differ from the NPMRDS Travel Time Reliability (TTTR) due to differences in route segmentation.
- Total corridor congestion cost (dollars/ year)—calculated for the full extent of delay along the congested corridor as a function of both the time and fuel used while the truck is in congested traffic, factoring costs of personnel, commercial vehicle operation, and wasted fuel. For major bottlenecks with long congestion queues, this includes multiple roadway segments. For major congested corridors, the congestion cost includes the full cost of congestion along the corridor through the entire urban area, which may include multiple bottlenecks.
Changes between 2018 and 2019 Top 100 Bottlenecks
Based on a comparison of truck hours of delay per mile, the following bottlenecks saw the greatest relative percent change (increase or decrease) in delay between 2018 and 2019. In many cases, major increases in delay from one year to the next can be attributed to major construction projects/work zones along the corridors.
The bottlenecks in table 36 saw the greatest percent increase in delay from 2018.
Table 36. Bottlenecks with greatest increase in delay from 2018.
| Road |
Urban Area |
State |
Increase in DPM from 2018 (Hours) |
Increase in DPM from 2018 (Percent) |
| I-75 |
Chattanooga |
Tennessee |
21,861 |
116% |
| I-10 |
Lake Charles |
Louisiana |
29,486 |
93% |
| I-90 |
Chicago |
Illinois |
14,948 |
53% |
| I-45 |
Houston |
Texas |
22,875 |
37% |
| I-40 |
Albuquerque |
New Mexico |
8,515 |
37% |
| I-20/I-59 |
Birmingham |
Alabama |
5,815 |
34% |
| I-30 |
Little Rock |
Arkansas |
11,237 |
28% |
| I-15 |
Ogden |
Utah |
5,140 |
27% |
| I-80/I-94 |
Chicago |
Illinois |
8,721 |
23% |
| I-710 |
Los Angeles |
California |
13,521 |
19% |
Key: Delay per mile (DPM)
The bottlenecks in table 37 saw the greatest percent decrease in delay from 2018.
Table 37. Bottlenecks with greatest decrease in delay from 2018.
| Road |
Urban Area |
State |
Increase in DPM from 2018 (Hours) |
Increase in DPM from 2018 (Percent) |
| I-696 |
Detroit |
Michigan |
-71,875 |
-86% |
| I-15 |
Las Vegas |
Nevada |
-48,774 |
-69% |
| I-94 |
Detroit |
Michigan |
-20,605 |
-60% |
| I-45 |
Dallas |
Texas |
-19,467 |
-55% |
| I-35W |
Minneapolis |
Minnesota |
-19,553 |
-53% |
| I-35 |
Austin |
Texas |
-97,558 |
-47% |
| I-77 |
Charlotte |
North Carolina |
-12,676 |
45% |
| I-43 |
Milwaukee |
Wisconsin |
-10,509 |
-43% |
| I-94 |
Minneapolis |
Minnesota |
-19,264 |
-41% |
| I-75 |
Cincinnati |
Ohio |
-15,674 |
-31% |
Key: delay per mile (DPM)
Based on changes to truck hours of delay per mile, the bottlenecks in table 38 saw a relative increase in delay, moving the locations to the top 100 bottlenecks, or a relative decrease in delay, dropping the locations below the top 100 bottlenecks. The bottlenecks in table 38 were added to the list in 2019.
The bottlenecks from 2018 in table 39 dropped off the list in 2019.
Table 38. New bottlenecks on the top 100 list for 2019.
| Road |
Urban Area |
State |
| I-20/I-59 |
Birmingham |
AL |
| I-580 |
Livermore |
CA |
| I-65 |
Indianapolis |
IN |
| I-95 |
Boston |
MA |
| I-270 |
Washington |
MD |
| I-95 |
Washington |
MD |
| I-670 |
Kansas City |
MO |
| I-280 |
Newark/New York |
NJ |
| I-75 |
Chattanooga |
TN |
| I-40 |
Knoxville |
TN |
| I-15 |
Ogden |
UT |
Table 39. Bottlenecks dropping off the top 100 list for 2019.
| Road |
Urban Area |
State |
| I-95 |
Jacksonville |
FL |
| I-275 |
Tampa |
FL |
| I-696 |
Detroit |
MI |
| I-94 |
Detroit |
MI |
| I-35W |
Minneapolis |
MN |
| I-77 |
Charlotte |
NC |
| I-85 |
Greenville |
SC |
| I-45 |
Dallas |
TX |
| I-64 |
Virginia Beach |
VA |
| I-90 |
Seattle |
WA |
| I-94 |
Milwaukee |
WI |
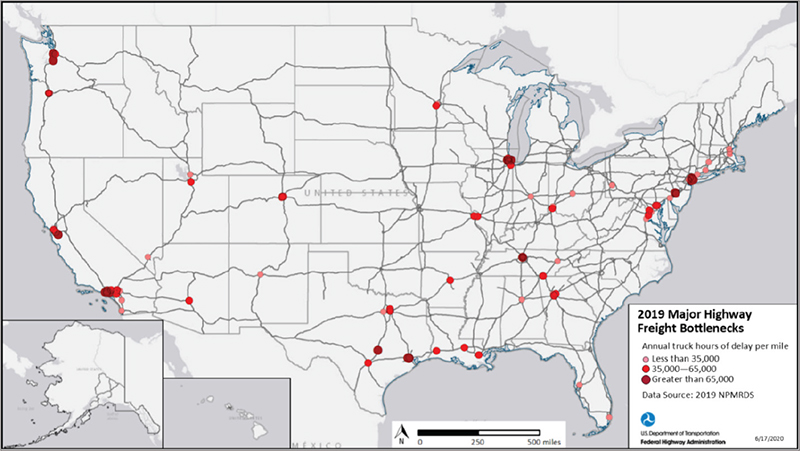
Figure 68 shows the top Interstate bottlenecks in the United States based on freight mobility indicators of annual truck hours of delay per mile from 2019.
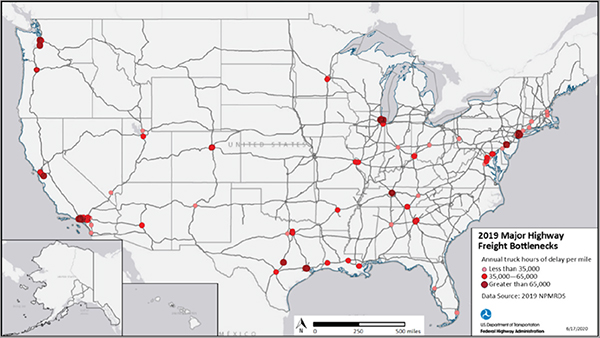
Source: FHWA
Figure 68. Map. Major freight highway bottlenecks based on truck hours of delay per mile in the 2019 National Performance Management Research Data Set.
Top 40 Bottleneck Maps
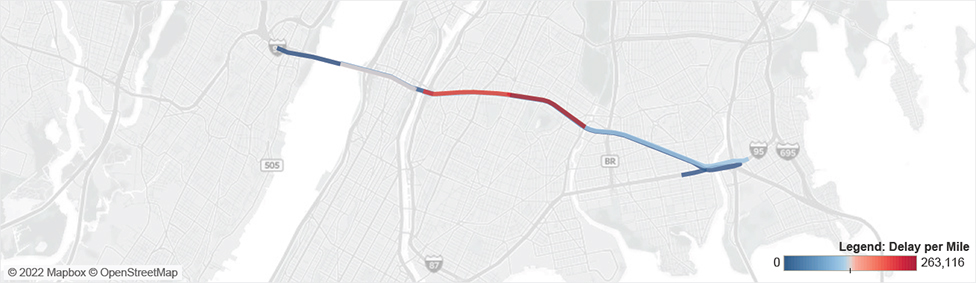
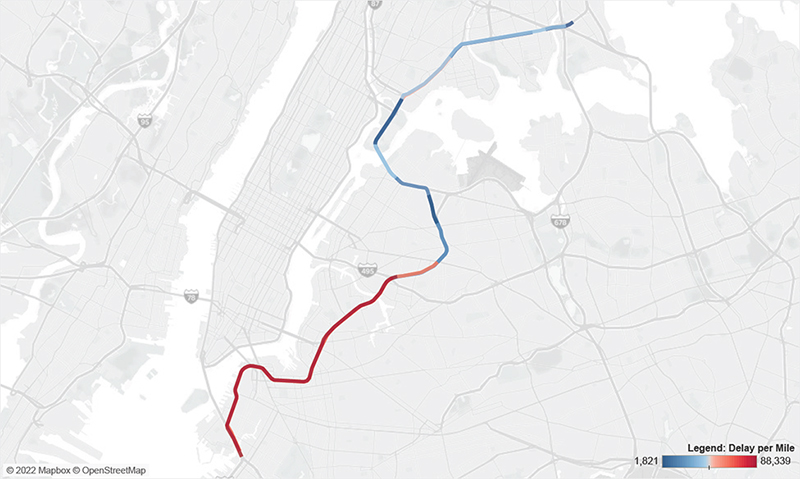
1. I-95/George Washington Bridge (New York, NY)

I-95/George Washington Bridge (New York, NY)
| Road |
Segment ID |
Length
(Miles) |
AADT
(Trucks) |
Delay
(Hours) |
Delay/ Mile |
PTI
(95th %) |
BI |
TTI |
TRI |
Cong. Cost |
FAF Value |
| I-95 |
NYN0000630 |
1.3 |
9,555 |
336,775 |
263,116 |
10.56 |
204.6% |
3.47 |
1.44 |
$16.7M |
$47.4B |
| I-95 |
NYN0000639 |
1.3 |
8,570 |
302,576 |
226,117 |
10.37 |
194.7% |
3.52 |
1.42 |
$15.0M |
$55.9B |
| UPPER LVL WASHINGTON |
NYN0000194 |
1.2 |
10,025 |
162,501 |
131,837 |
5.85 |
163.6% |
2.22 |
1.57 |
$8.0M |
$43.1B |
| I-95 |
NYP00001442 |
1.4 |
8,357 |
158,454 |
117,541 |
5.60 |
132.9% |
2.37 |
1.35 |
$7.8M |
$55.2B |
| I-95 |
NYN0000623 |
2.6 |
5,025 |
294,323 |
112,420 |
10.83 |
241.9% |
3.12 |
2.01 |
$14.6M |
$19.3B |
| UPPER LVL WASHINGTON |
NYP0000982 |
1.5 |
9,936 |
107,895 |
71,972 |
3.78 |
91.4% |
1.96 |
1.51 |
$5.3M |
$42.8B |
| I-95 |
NYP00001444 |
1.3 |
9,565 |
77,523 |
60,522 |
2.97 |
78.8% |
1.63 |
1.35 |
$3.8M |
$47.4B |
| I-95 |
NYN0000982 |
1.5 |
4,986 |
19,861 |
13,248 |
9.01 |
160.8% |
3.45 |
1.37 |
$1.0M |
$19.1B |
| I-95 |
NYP00001448 |
3.4 |
4,873 |
29,501 |
8,639 |
1.61 |
31.3% |
1.22 |
1.24 |
$1.5M |
$18.8B |
Cumulative mileage of segments may not add up to the corresponding segment in the Nationally Significant Freight Highway Bottlenecks and Congested Corridors list.
Source: FHWA
Figure 69. Map. Top 40 Bottleneck Maps, Bottleneck 1, I-95/George Washington Bridge (New York, NY).
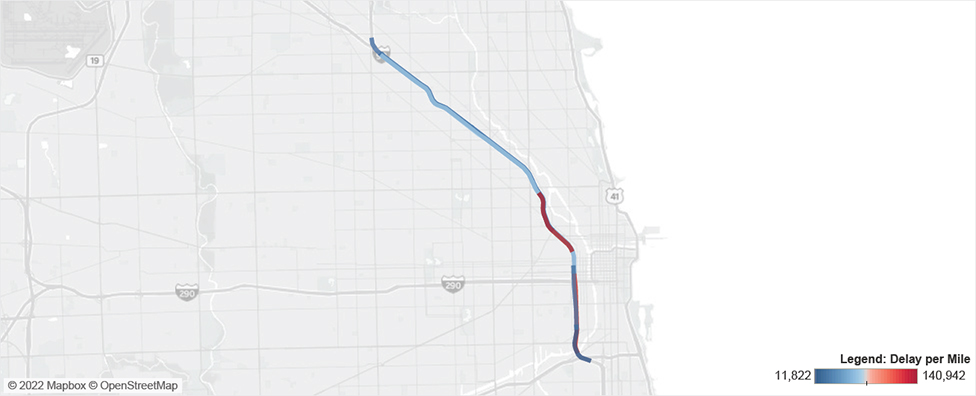
2. I-90 and I-90/I-94 (Chicago, IL)
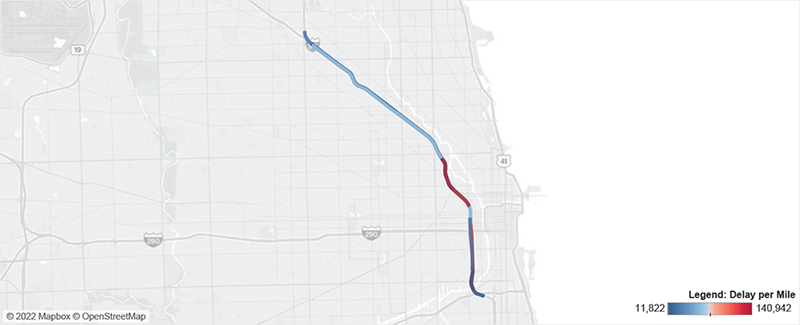
I-90 & I-90/I-94 (Chicago, IL)
| Road |
Segment ID |
Length
(Miles) |
AADT
(Trucks) |
Delay
(Hours) |
Delay/ Mile |
PTI
(95th %) |
BI |
TTI |
TRI |
Cong. Cost |
FAF Value |
| I-90/I-94 |
ILN0000123 |
1.8 |
8,003 |
257,845 |
140,942 |
7.22 |
159.1% |
2.76 |
1.45 |
$12.8M |
$31.5B |
| I-90/I-94 |
ILP00001036 |
2.1 |
8,005 |
267,573 |
129,564 |
7.46 |
177.8% |
2.67 |
1.69 |
$13.3M |
$32.4B |
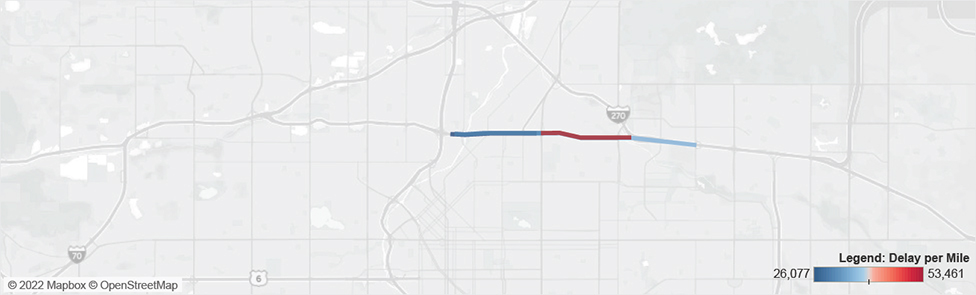
| I-90/I-94 |
ILN0000122 |
5.5 |
7,016 |
372,261 |
67,624 |
5.60 |
169.6% |
2.07 |
1.59 |
$18.4M |
$28.0B |
| I-90/I-94 |
ILP00001041 |
2.6 |
7,975 |
146,949 |
56,502 |
4.49 |
156.5% |
1.74 |
1.67 |
$7.3M |
$31.4B |
| I-90/I-94 |
ILP00001042 |
2.2 |
7,088 |
78,656 |
36,295 |
3.84 |
154.7% |
1.50 |
2.10 |
$3.9M |
$28.1B |
| I-90/I-94 |
ILP00001045 |
3.1 |
6,888 |
104,594 |
33,668 |
3.95 |
153.2% |
1.54 |
1.80 |
$5.2M |
$27.7B |
| I-90 |
ILN0000348 |
5.9 |
6,900 |
166,261 |
28,372 |
6.72 |
194.8% |
2.29 |
1.55 |
$8.2M |
$27.5B |
| I-90/I-94 |
ILN0000131 |
1.8 |
8,014 |
46,167 |
25,308 |
2.10 |
41.8% |
1.43 |
1.17 |
$2.3M |
$32.4B |
| I-90 |
ILN0000349 |
1.2 |
8,150 |
30,757 |
24,737 |
6.56 |
177.1% |
2.37 |
1.35 |
$1.5M |
$32.2B |
| I-90 |
ILP00001241 |
5.4 |
6,901 |
101,427 |
18,805 |
5.41 |
168.3% |
2.02 |
1.61 |
$5.0M |
$27.5B |
| I-90 |
ILP00001240 |
1.2 |
8,150 |
17,247 |
13,871 |
4.48 |
139.3% |
1.85 |
1.39 |
$0.9M |
$32.2B |
| I-90/I-94 |
ILN0000133 |
1.2 |
9,161 |
13,830 |
11,822 |
1.35 |
17.5% |
1.15 |
1.11 |
$0.7M |
$39.8B |
Cumulative mileage of segments may not add up to the corresponding segment in the Nationally Significant Freight Highway Bottlenecks and Congested Corridors list.
Source: FHWA
Figure 70. Map. Top 40 Bottleneck Maps, Bottleneck 2, I-90 and I-90/I-94 (Chicago, IL).
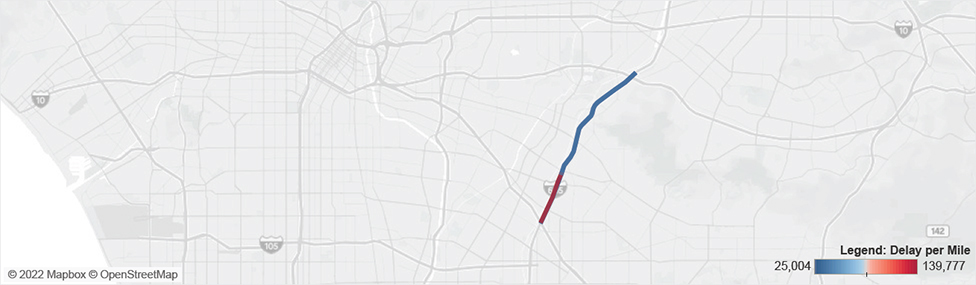
3. I-605 (Los Angeles, CA)
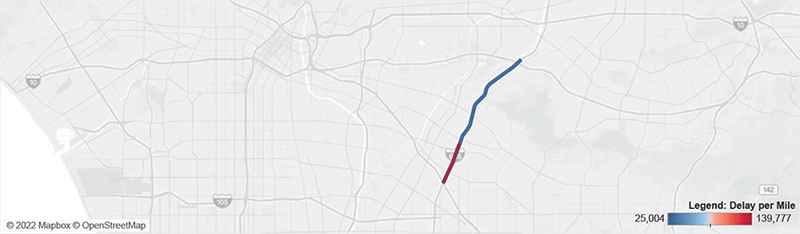
I-605 (Los Angeles, CA)
| Road |
Segment ID |
Length
(Miles) |
AADT
(Trucks) |
Delay
(Hours) |
Delay/ Mile |
PTI
(95th %) |
BI |
TTI |
TRI |
Cong. Cost |
FAF Value |
| I-605 |
CAN0000902 |
2.6 |
10,963 |
365,837 |
139,777 |
4.73 |
127.0% |
2.07 |
1.30 |
$18.1M |
$56.0B |
| I-605 |
CAN0000901 |
5.8 |
11,574 |
203,433 |
35,144 |
2.72 |
98.5% |
1.36 |
1.56 |
$10.1M |
$54.9B |
| I-605 |
CAP00002389 |
6.2 |
11,282 |
178,381 |
28,738 |
2.20 |
71.2% |
1.27 |
1.48 |
$8.8M |
$55.0B |
| I-605 |
CAP00002387 |
2.2 |
11,263 |
54,732 |
25,004 |
2.15 |
67.4% |
1.28 |
1.59 |
$2.7M |
$56.2B |
Cumulative mileage of segments may not add up to the corresponding segment in the Nationally Significant Freight Highway Bottlenecks and Congested Corridors list.
Source: FHWA
Figure 71. Map. Top 40 Bottleneck Maps, Bottleneck 3, I-605 (Los Angeles, CA).
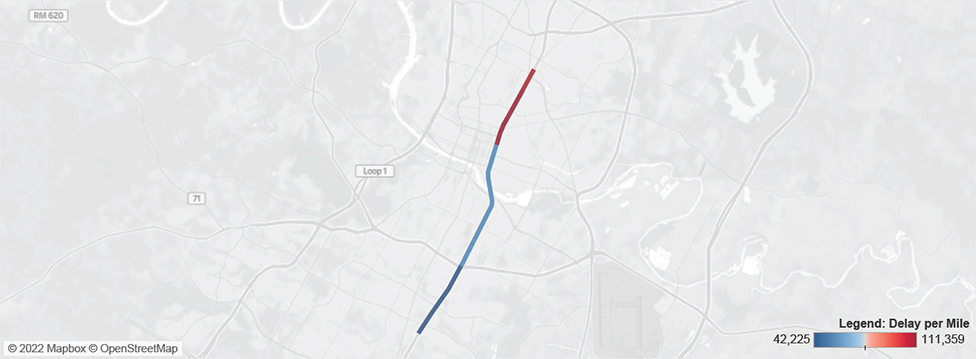
4. I-35 (Austin, TX)
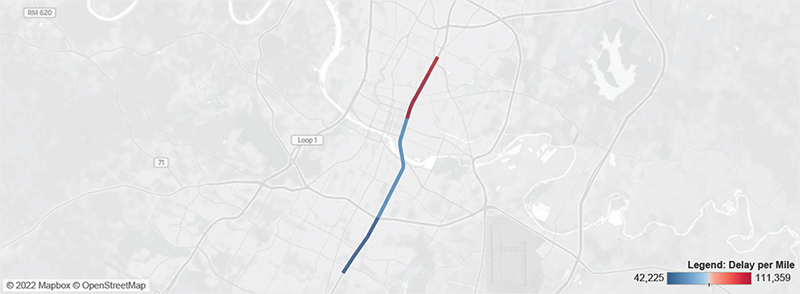
I-35 (Austin, TX)
| Road |
Segment ID |
Length
(Miles) |
AADT
(Trucks) |
Delay
(Hours) |
Delay/ Mile |
PTI
(95th %) |
BI |
TTI |
TRI |
Cong. Cost |
FAF Value |
| I-35 |
TXN0000771 |
2.1 |
11,074 |
231,906 |
111,359 |
9.93 |
297.5% |
2.47 |
2.51 |
$11.5M |
$48.7B |
| I-35 |
TXP00002440 |
5.4 |
9,754 |
388,252 |
72,365 |
6.54 |
190.7% |
2.19 |
1.99 |
$19.2M |
$43.0B |
| I-35 |
TXP00002320 |
1.2 |
11,094 |
70,646 |
60,713 |
9.14 |
131.6% |
3.74 |
1.76 |
$3.5M |
$48.8B |
| I-35 |
TXN0000858 |
5.4 |
9,687 |
299,486 |
55,482 |
5.30 |
142.1% |
2.00 |
1.42 |
$14.8M |
$42.7B |
| I-35 |
TXN0000859 |
2.5 |
8,895 |
104,699 |
42,225 |
3.10 |
112.1% |
1.41 |
1.69 |
$5.2M |
$41.4B |
Cumulative mileage of segments may not add up to the corresponding segment in the Nationally Significant Freight Highway Bottlenecks and Congested Corridors list.
Source: FHWA
Figure 72. Map. Top 40 Bottleneck Maps, Bottleneck 4, I-35 (Austin, TX).
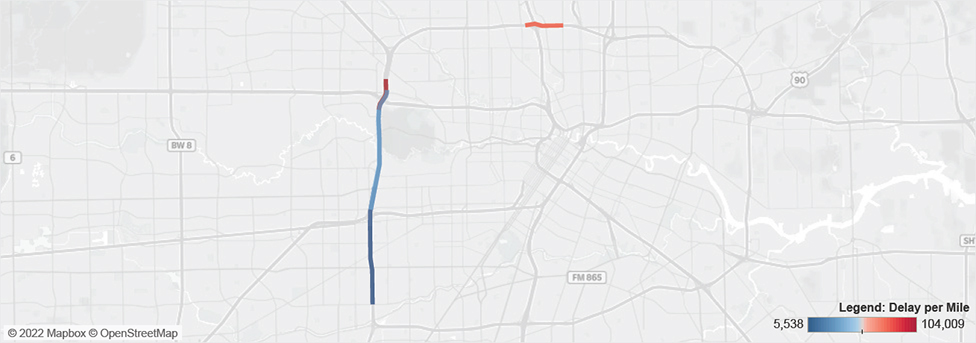
5. I-610 (Houston, TX)
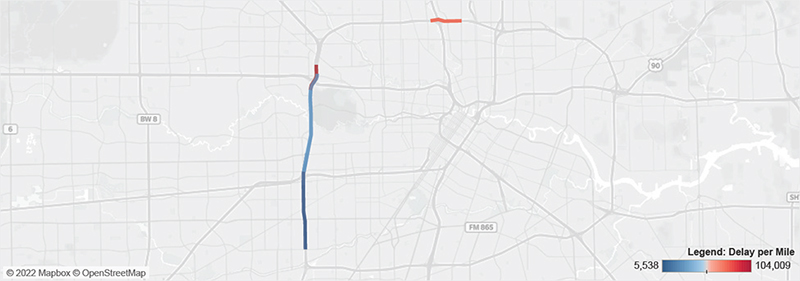
I-610 (Houston, TX)
| Road |
Segment ID |
Length
(Miles) |
AADT
(Trucks) |
Delay
(Hours) |
Delay/ Mile |
PTI
(95th %) |
BI |
TTI |
TRI |
Cong. Cost |
FAF Value |
| I-610 |
TXP00001925 |
1.0 |
7,379 |
104,501 |
104,009 |
9.21 |
229.0% |
2.81 |
1.62 |
$5.2M |
$26.7B |
| I-610 |
TXP00001944 |
1.2 |
7,605 |
95,276 |
80,822 |
5.86 |
192.4% |
1.93 |
1.64 |
$4.7M |
$30.4B |
| I-610 |
TXP00001927 |
3.1 |
6,652 |
148,065 |
47,683 |
4.57 |
140.0% |
1.90 |
1.52 |
$7.3M |
$24.3B |
| I-610 |
TXN0000421 |
3.8 |
6,766 |
108,435 |
28,690 |
3.02 |
79.3% |
1.53 |
1.29 |
$5.4M |
$24.7B |
| I-610 |
TXP00001931 |
1.2 |
6,106 |
10,452 |
8,705 |
2.02 |
50.0% |
1.32 |
1.30 |
$0.5M |
$22.3B |
| I-610 |
TXP00001933 |
2.4 |
3,989 |
13,524 |
5,538 |
1.90 |
57.1% |
1.21 |
1.65 |
$0.7M |
$14.8B |
Cumulative mileage of segments may not add up to the corresponding segment in the Nationally Significant Freight Highway Bottlenecks and Congested Corridors list.
Source: FHWA
Figure 73. Map. Top 40 Bottleneck Maps, Bottleneck 5, I-610 (Houston, TX).
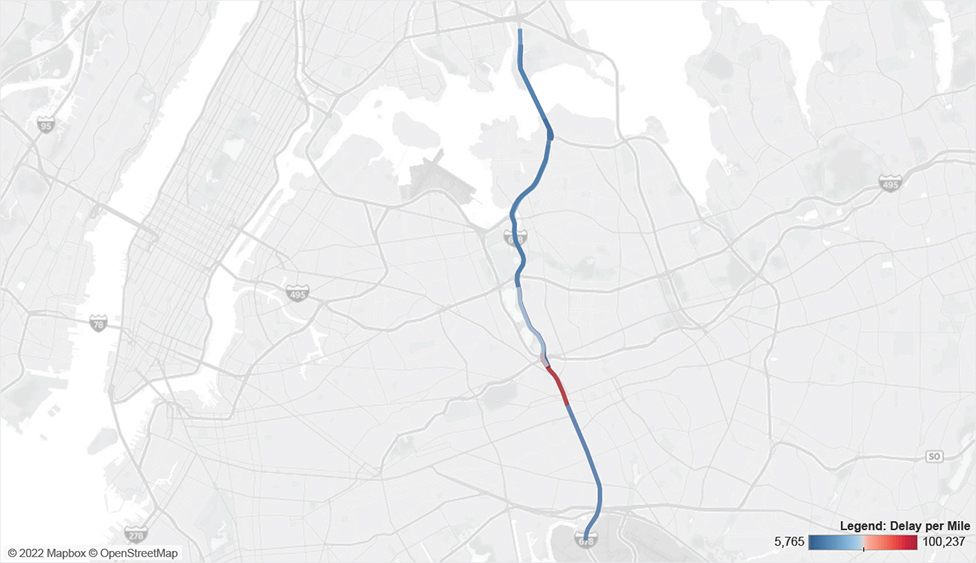
6. I-678 (New York, NY)
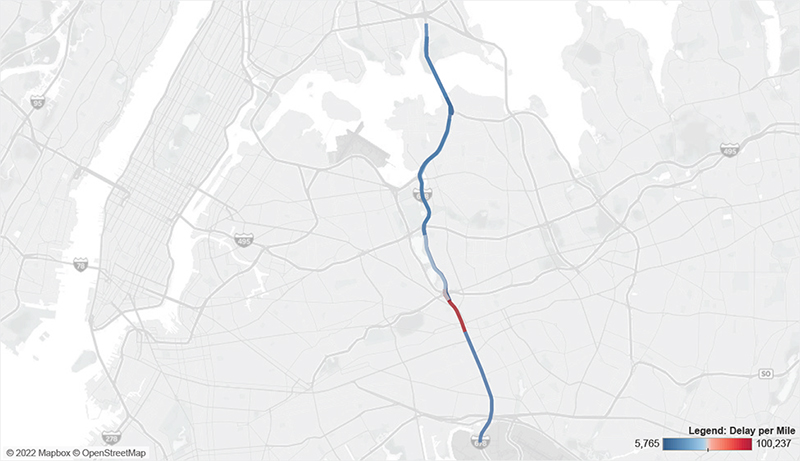
I-678 (New York, NY)
| Road |
Segment ID |
Length
(Miles) |
AADT
(Trucks) |
Delay
(Hours) |
Delay/ Mile |
PTI
(95th %) |
BI |
TTI |
TRI |
Cong. Cost |
FAF Value |
| I-678 |
NYN0000213 |
1.3 |
6,510 |
134,371 |
100,237 |
6.33 |
170.5% |
2.34 |
1.31 |
$6.7M |
$24.4B |
| I-678 |
NYN0000212 |
2.4 |
5,359 |
119,305 |
50,329 |
6.97 |
190.2% |
2.36 |
1.98 |
$5.9M |
$18.6B |
| I-678 |
NYP00001005 |
3.5 |
6,012 |
105,670 |
29,981 |
3.69 |
130.3% |
1.54 |
1.94 |
$5.2M |
$22.1B |
| I-678 |
NYN0000208 |
2.2 |
5,260 |
53,341 |
24,334 |
3.74 |
140.4% |
1.56 |
1.73 |
$2.6M |
$20.1B |
| I-678 |
NYN0000214 |
3.3 |
4,038 |
57,159 |
17,158 |
2.44 |
57.8% |
1.50 |
1.15 |
$2.8M |
$16.4B |
| I-678 |
NYN0000210 |
4.0 |
6,092 |
64,016 |
16,157 |
2.15 |
64.8% |
1.30 |
1.54 |
$3.2M |
$22.4B |
| I-678 |
NYN0000209 |
0.6 |
6,303 |
9,388 |
15,518 |
2.81 |
98.7% |
1.41 |
1.45 |
$0.5M |
$24.1B |
| I-678 |
NYP00001008 |
2.4 |
5,577 |
20,080 |
8,290 |
1.67 |
36.5% |
1.21 |
1.22 |
$1.0M |
$21.3B |
| I-678 |
NYP00001004 |
2.3 |
5,529 |
13,403 |
5,765 |
1.43 |
21.4% |
1.18 |
1.11 |
$0.7M |
$18.9B |
Cumulative mileage of segments may not add up to the corresponding segment in the Nationally Significant Freight Highway Bottlenecks and Congested Corridors list.
Source: FHWA
Figure 74. Map. Top 40 Bottleneck Maps, Bottleneck 6, I-678 (New York, NY).
7. I-405 (Los Angeles, CA)
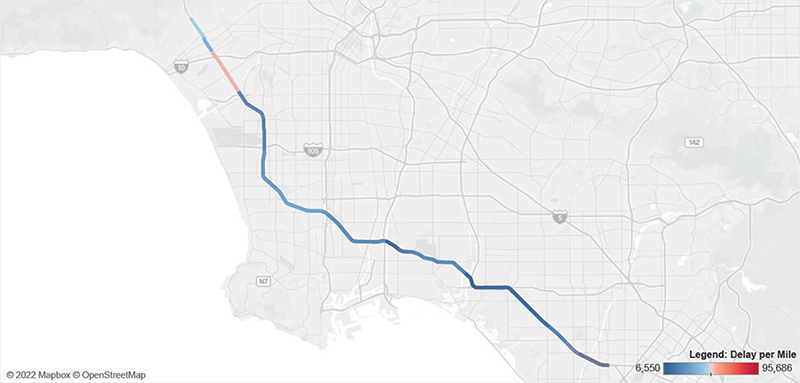
I-405 (Los Angeles, CA)
| Road |
Segment ID |
Length
(Miles) |
AADT
(Trucks) |
Delay
(Hours) |
Delay/ Mile |
PTI
(95th %) |
BI |
TTI |
TRI |
Cong. Cost |
FAF Value |
| I-405 |
CAP00001948 |
2.5 |
12,139 |
238,811 |
95,686 |
6.27 |
217.2% |
1.98 |
2.24 |
$11.8M |
$65.9B |
| I-405 |
CAN0000361 |
3.7 |
4,687 |
201,884 |
54,548 |
7.15 |
211.4% |
2.28 |
1.65 |
$10.0M |
$17.1B |
| I-405 |
CAP00001963 |
1.3 |
12,606 |
71,876 |
53,809 |
3.70 |
111.9% |
1.71 |
1.46 |
$3.6M |
$68.3B |
| I-405 |
CAP00002322 |
5.5 |
6,419 |
270,841 |
49,335 |
5.74 |
184.6% |
1.94 |
1.90 |
$13.4M |
$31.6B |
| I-405 |
CAP00002326 |
6.8 |
5,357 |
309,907 |
45,851 |
5.82 |
190.2% |
1.97 |
1.88 |
$15.4M |
$21.9B |
| I-405 |
CAN0000354 |
1.3 |
6,037 |
44,460 |
35,440 |
4.44 |
168.7% |
1.65 |
1.94 |
$2.2M |
$25.7B |
| I-405 |
CAN0000385 |
7.7 |
5,984 |
249,513 |
32,572 |
4.24 |
153.5% |
1.62 |
1.82 |
$12.4M |
$27.2B |
| I-405 |
CAP00002300 |
3.7 |
6,454 |
112,870 |
30,776 |
3.76 |
144.6% |
1.53 |
1.93 |
$5.6M |
$28.7B |
| I-405 |
CAN0000387 |
5.8 |
6,102 |
160,644 |
27,814 |
3.53 |
128.8% |
1.50 |
1.68 |
$8.0M |
$26.3B |
| I-405 |
CAP00002157 |
4.4 |
10,378 |
113,841 |
25,817 |
2.44 |
86.4% |
1.31 |
1.53 |
$5.6M |
$59.6B |
| I-405 |
CAP00002305 |
1.1 |
4,806 |
26,213 |
23,357 |
4.09 |
156.3% |
1.59 |
1.72 |
$1.3M |
$19.2B |
| I-405 |
CAN0000398 |
4.4 |
9,828 |
98,686 |
22,361 |
2.41 |
85.6% |
1.29 |
1.56 |
$4.9M |
$56.1B |
| I-405 |
CAP00002040 |
1.3 |
8,222 |
29,152 |
21,697 |
2.31 |
81.8% |
1.27 |
1.70 |
$1.4M |
$50.3B |
| I-405 |
CAN0000421 |
5.7 |
10,578 |
116,863 |
20,616 |
2.36 |
73.1% |
1.31 |
1.46 |
$5.8M |
$60.6B |
| I-405 |
CAN0000392 |
1.3 |
12,097 |
25,240 |
19,331 |
2.05 |
67.2% |
1.22 |
1.58 |
$1.2M |
$67.4B |
| I-405 |
CAN0000373 |
5.4 |
6,438 |
90,274 |
16,618 |
2.50 |
79.4% |
1.34 |
1.51 |
$4.5M |
$31.7B |
| I-405 |
CAP00002247 |
1.9 |
8,114 |
27,104 |
14,227 |
1.97 |
58.4% |
1.24 |
1.40 |
$1.3M |
$46.1B |
| I-405 |
CAN0000413 |
6.8 |
5,028 |
88,395 |
13,103 |
3.01 |
108.5% |
1.37 |
1.84 |
$4.4M |
$19.6B |
| I-405 |
CAP00002135 |
1.7 |
6,420 |
19,902 |
11,612 |
2.16 |
72.9% |
1.25 |
1.55 |
$1.0M |
$31.7B |
| I-405 |
CAP00002269 |
5.4 |
6,210 |
59,290 |
11,046 |
2.16 |
64.3% |
1.30 |
1.37 |
$2.9M |
$26.9B |
| I-405 |
CAP00002056 |
1.5 |
4,642 |
15,843 |
10,841 |
2.45 |
85.2% |
1.31 |
1.53 |
$0.8M |
$18.3B |
| I-405 |
CAN0000388 |
1.1 |
6,236 |
12,244 |
10,722 |
1.81 |
47.2% |
1.23 |
1.31 |
$0.6M |
$26.6B |
| I-405 |
CAP00002311 |
3.2 |
5,682 |
33,844 |
10,446 |
1.91 |
50.6% |
1.25 |
1.20 |
$1.7M |
$26.2B |
| I-405 |
CAP00002102 |
2.1 |
5,646 |
21,210 |
10,041 |
1.98 |
59.3% |
1.24 |
1.35 |
$1.1M |
$21.6B |
| I-405 |
CAN0000408 |
1.5 |
6,822 |
15,418 |
10,026 |
1.66 |
39.7% |
1.18 |
1.35 |
$0.8M |
$35.5B |
| I-405 |
CAP00002090 |
3.1 |
4,667 |
20,145 |
6,550 |
1.73 |
44.0% |
1.20 |
1.31 |
$1.0M |
$18.2B |
Cumulative mileage of segments may not add up to the corresponding segment in the Nationally Significant Freight Highway Bottlenecks and Congested Corridors list.
Source: FHWA
Figure 75. Map. Top 40 Bottleneck Maps, Bottleneck 7, I-405 (Los Angeles, CA).
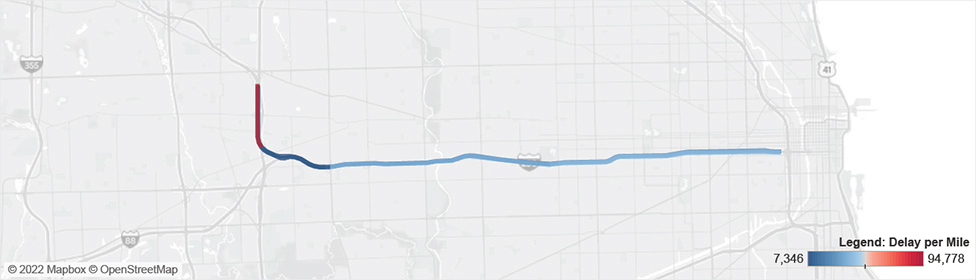
8. I-290 (Chicago, IL)
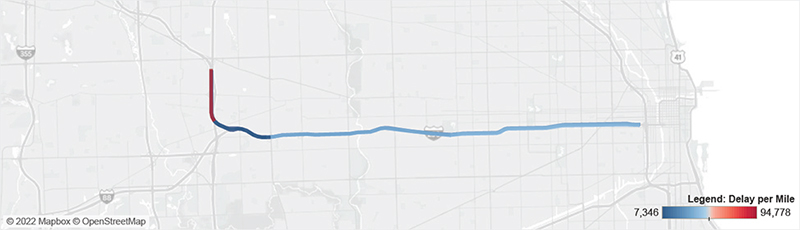
I-290 (Chicago, IL)
| Road |
Segment ID |
Length
(Miles) |
AADT
(Trucks) |
Delay
(Hours) |
Delay/ Mile |
PTI
(95th %) |
BI |
TTI |
TRI |
Cong. Cost |
FAF Value |
| I-290 |
ILN0000106 |
1.7 |
8,726 |
162,175 |
94,778 |
5.49 |
163.0% |
2.03 |
1.41 |
$8.0M |
$38.8B |
| I-290 |
ILN0000109 |
6.2 |
4,348 |
246,636 |
39,648 |
5.10 |
143.3% |
2.06 |
1.87 |
$12.2M |
$16.1B |
| I-290 |
ILN0000108 |
5.9 |
4,830 |
210,907 |
35,635 |
4.46 |
132.2% |
1.79 |
1.48 |
$10.4M |
$18.6B |
| I-290 |
ILP00001014 |
6.2 |
4,345 |
182,658 |
29,703 |
4.50 |
148.9% |
1.71 |
1.85 |
$9.0M |
$16.2B |
| I-290 |
ILP00001015 |
6.3 |
4,814 |
157,236 |
25,078 |
3.26 |
93.7% |
1.61 |
1.38 |
$7.8M |
$18.5B |
| I-290 |
ILP00001016 |
3.5 |
6,695 |
26,763 |
7,699 |
1.36 |
18.6% |
1.14 |
1.12 |
$1.3M |
$33.3B |
| I-290 |
ILN0000107 |
2.0 |
5,615 |
14,528 |
7,346 |
1.58 |
30.4% |
1.19 |
1.32 |
$0.7M |
$28.6B |
Cumulative mileage of segments may not add up to the corresponding segment in the Nationally Significant Freight Highway Bottlenecks and Congested Corridors list.
Source: FHWA
Figure 76. Map. Top 40 Bottleneck Maps, Bottleneck 8, I-290 (Chicago, IL).
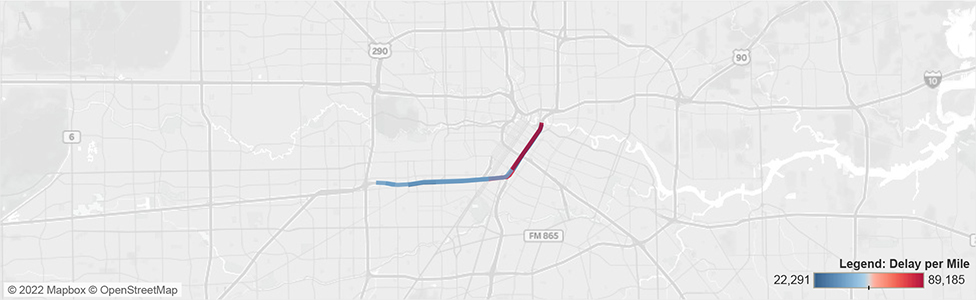
9. US-59 (Houston, TX)

US-59 (Houston, TX)
| Road |
Segment ID |
Length
(Miles) |
AADT
(Trucks) |
Delay
(Hours) |
Delay/ Mile |
PTI
(95th %) |
BI |
TTI |
TRI |
Cong. Cost |
FAF Value |
| US-59 |
TXN0000373 |
2.1 |
6,831 |
187,114 |
89,185 |
7.19 |
205.4% |
2.32 |
1.84 |
$9.3M |
$32.5B |
| US-59 |
TXP00001877 |
1.1 |
6,411 |
91,022 |
84,951 |
9.20 |
259.6% |
2.56 |
1.89 |
$4.5M |
$29.6B |
| US-59 |
TXN0000374 |
6.0 |
8,325 |
239,646 |
40,026 |
4.66 |
154.4% |
1.75 |
2.05 |
$11.9M |
$39.2B |
| US-59 |
TXP00001875 |
2.0 |
8,206 |
66,255 |
33,459 |
7.45 |
260.5% |
2.06 |
2.69 |
$3.3M |
$38.2B |
| US-59 |
TXP00001881 |
2.0 |
6,790 |
52,754 |
26,216 |
2.36 |
61.7% |
1.36 |
1.23 |
$2.6M |
$32.3B |
| US-59 |
TXP00001872 |
1.1 |
8,841 |
23,402 |
22,291 |
1.86 |
49.9% |
1.22 |
1.47 |
$1.2M |
$41.2B |
Cumulative mileage of segments may not add up to the corresponding segment in the Nationally Significant Freight Highway Bottlenecks and Congested Corridors list.
Source: FHWA
Figure 77. Map. Top 40 Bottleneck Maps, Bottleneck 9, US-59 (Houston, TX).
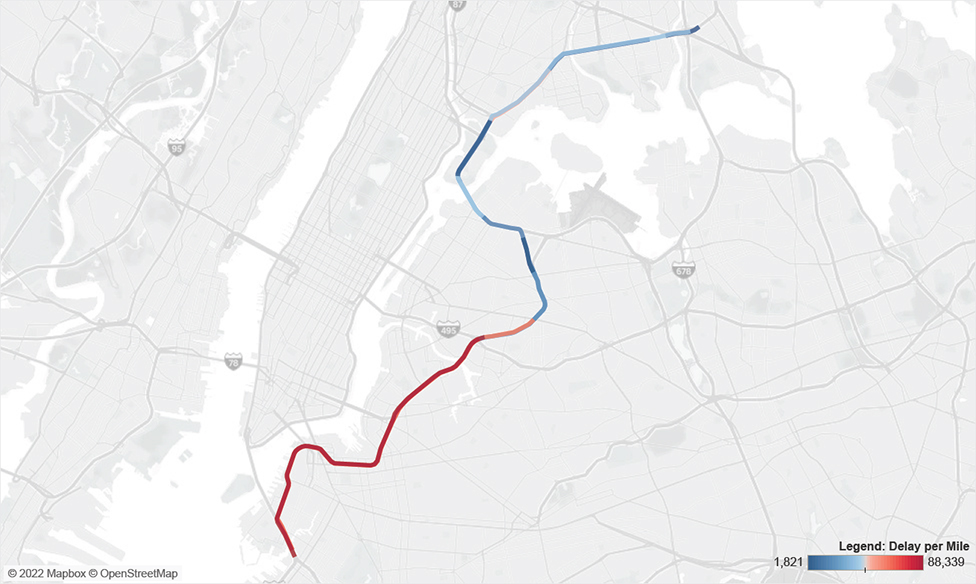
10. I-278 (New York, NY)
I-278 (New York, NY)
| Road |
Segment ID |
Length
(Miles) |
AADT
(Trucks) |
Delay
(Hours) |
Delay/ Mile |
PTI
(95th %) |
BI |
TTI |
TRI |
Cong. Cost |
FAF Value |
| I-278 |
NYN0000187 |
8.0 |
6,607 |
708,920 |
88,339 |
6.03 |
164.0% |
2.24 |
1.55 |
$35.1M |
$23.3B |
| I-278 |
NYP0000969 |
7.7 |
6,574 |
542,150 |
70,192 |
4.68 |
132.0% |
1.98 |
1.59 |
$26.9M |
$23.2B |
| I-278 |
NYN0000186 |
1.1 |
4,985 |
69,302 |
60,883 |
7.89 |
218.4% |
2.48 |
2.04 |
|
$19.0B |
| I-278 |
NYP0000976 |
1.7 |
4,625 |
82,967 |
48,736 |
5.20 |
158.9% |
1.95 |
1.64 |
$4.1M |
$17.6B |
| I-278 |
NYN0000181 |
1.1 |
5,453 |
41,867 |
39,345 |
2.42 |
80.8% |
1.33 |
1.71 |
$2.1M |
$18.1B |
| I-278 |
NYN0000178 |
4.9 |
4,531 |
187,603 |
38,373 |
5.55 |
170.4% |
2.03 |
1.88 |
$9.3M |
$16.7B |
| I-278 |
NYP0000974 |
1.1 |
5,317 |
36,539 |
33,533 |
3.30 |
132.8% |
1.42 |
1.79 |
$1.8M |
$16.9B |
| I-278 |
NYP0000970 |
2.5 |
5,836 |
58,743 |
23,123 |
3.33 |
123.2% |
1.49 |
1.98 |
$2.9M |
$20.8B |
| I-278 |
NYN0000185 |
1.3 |
6,801 |
25,666 |
20,308 |
2.50 |
78.7% |
1.37 |
1.54 |
$1.3M |
$22.1B |
| I-278 |
NYP0000973 |
1.9 |
3,252 |
31,946 |
16,995 |
3.21 |
97.8% |
1.54 |
1.46 |
$1.6M |
$12.7B |
| I-278 |
NYP0000975 |
1.5 |
6,325 |
14,604 |
9,696 |
5.66 |
215.1% |
1.80 |
2.85 |
$0.7M |
$24.3B |
| I-278 |
NYP0000977 |
2.3 |
4,505 |
22,144 |
9,628 |
1.92 |
46.4% |
1.29 |
1.26 |
$1.1M |
$15.7B |
| I-278 |
NYN0000179 |
1.4 |
5,639 |
6,137 |
4,422 |
2.93 |
98.5% |
1.47 |
1.73 |
$0.3M |
$21.7B |
| I-278 |
NYP0000979 |
0.8 |
4,868 |
3,176 |
4,259 |
1.45 |
15.1% |
1.25 |
1.15 |
$0.2M |
$20.4B |
| I-278 |
NYN0000184 |
0.8 |
933 |
1,393 |
1,821 |
1.48 |
24.9% |
1.19 |
1.11 |
$0.1M |
$2.1B |
Cumulative mileage of segments may not add up to the corresponding segment in the Nationally Significant Freight Highway Bottlenecks and Congested Corridors list.
Source: FHWA
Figure 78. Map. Top 40 Bottleneck Maps, Bottleneck 10, I-278 (New York, NY).
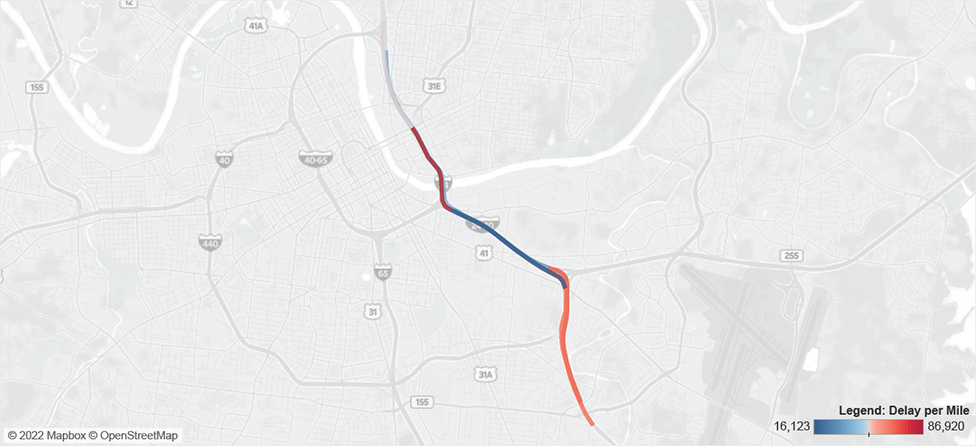
11. I-24 and I-24/I-40 (Nashville, TN)
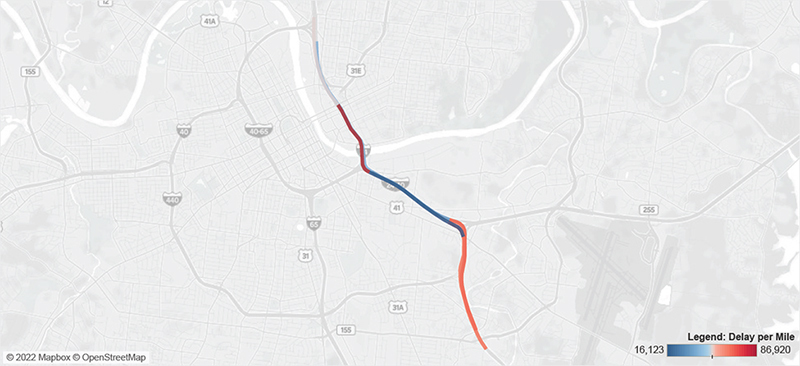
I-24 & I-24/I-40 (Nashville, TN)
| Road |
Segment ID |
Length
(Miles) |
AADT
(Trucks) |
Delay
(Hours) |
Delay/ Mile |
PTI
(95th %) |
BI |
TTI |
TRI |
Cong. Cost |
FAF Value |
| I-24 |
TNN0000143 |
1.4 |
12,775 |
122,135 |
86,920 |
5.05 |
178.7% |
1.80 |
1.72 |
$6.1M |
$73.5B |
| I-24 |
TNP00001312 |
2.2 |
12,589 |
158,173 |
70,969 |
5.00 |
205.4% |
1.62 |
2.56 |
$7.8M |
$74.0B |
| I-24 |
TNN0000596 |
2.6 |
12,577 |
168,044 |
65,607 |
5.10 |
236.4% |
1.52 |
4.24 |
$8.3M |
$73.8B |
| I-24 |
TNN0000141 |
1.7 |
12,365 |
87,752 |
51,554 |
3.80 |
142.9% |
1.51 |
2.29 |
$4.3M |
$72.5B |
| I-24 |
TNP0000812 |
2.7 |
12,547 |
107,576 |
40,338 |
3.03 |
124.1% |
1.34 |
1.90 |
$5.3M |
$72.9B |
| I-24/I-40 |
TNP00001291 |
1.7 |
5,227 |
56,849 |
34,062 |
3.95 |
128.7% |
1.71 |
1.40 |
$2.8M |
$31.2B |
| I-24/I-40 |
TNN0000581 |
2.1 |
5,391 |
34,143 |
16,123 |
3.02 |
123.5% |
1.34 |
2.18 |
$1.7M |
$35.0B |
Cumulative mileage of segments may not add up to the corresponding segment in the Nationally Significant Freight Highway Bottlenecks and Congested Corridors list.
Source: FHWA
Figure 79. Map. Top 40 Bottleneck Maps, Bottleneck 11, I-24 and I-24/I-40 Nashville, TN).
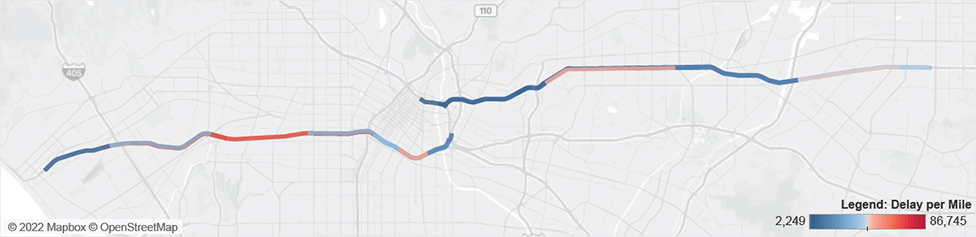
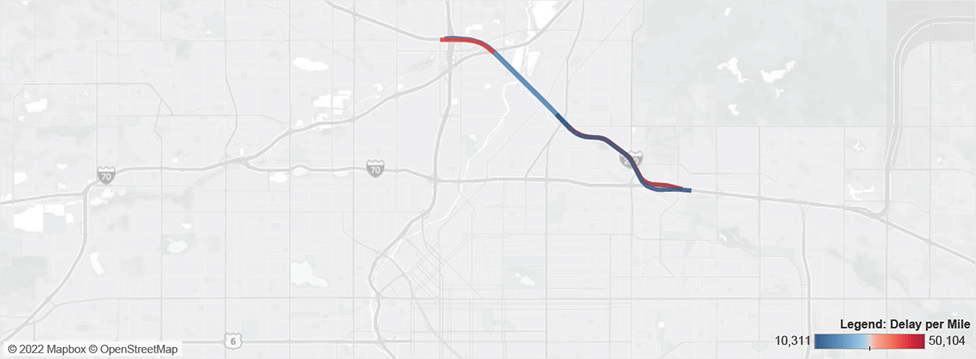
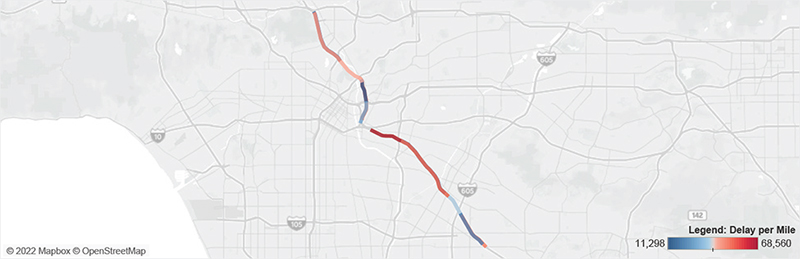
12. I-10 (Los Angeles, CA)
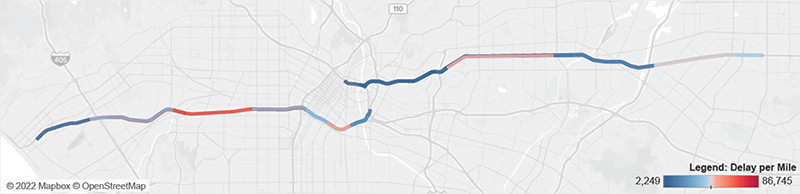
I-10 (Los Angeles, CA)
| Road |
Segment ID |
Length
(Miles) |
AADT
(Trucks) |
Delay
(Hours) |
Delay/ Mile |
PTI
(95th %) |
BI |
TTI |
TRI |
Cong. Cost |
FAF Value |
| I-10 |
CAP00002240 |
2.5 |
7,036 |
217,248 |
86,745 |
7.26 |
161.9% |
2.74 |
1.50 |
$10.8M |
$27.9B |
| I-10 |
CAP00002227 |
3.7 |
8,755 |
275,579 |
74,009 |
6.08 |
187.4% |
2.11 |
1.55 |
$13.6M |
$57.5B |
| I-10 |
CAN0000765 |
3.8 |
9,218 |
272,082 |
71,408 |
8.11 |
186.3% |
2.82 |
2.09 |
$13.5M |
$54.4B |
| I-10 |
CAP00002225 |
1.1 |
4,749 |
57,485 |
54,539 |
8.66 |
233.4% |
2.60 |
2.39 |
$2.8M |
$19.6B |
| I-10 |
CAN0000763 |
1.2 |
9,198 |
62,155 |
51,166 |
4.81 |
117.5% |
2.21 |
1.45 |
$3.1M |
$47.8B |
| I-10 |
CAN0000772 |
4.9 |
11,195 |
233,532 |
47,277 |
3.38 |
122.3% |
1.52 |
1.62 |
$11.6M |
$82.7B |
| I-10 |
CAN0000774 |
3.8 |
6,620 |
169,736 |
45,006 |
4.78 |
171.3% |
1.75 |
1.74 |
$8.4M |
$24.6B |
| I-10 |
CAP00002223 |
2.3 |
4,843 |
100,712 |
43,043 |
6.89 |
198.7% |
2.18 |
2.41 |
$5.0M |
$23.3B |
| I-10 |
CAN0000776 |
1.2 |
7,093 |
48,021 |
41,865 |
4.33 |
160.7% |
1.66 |
1.77 |
$2.4M |
$30.2B |
| I-10 |
CAP00002229 |
3.2 |
9,696 |
134,552 |
41,843 |
3.87 |
110.4% |
1.84 |
1.35 |
$6.7M |
$57.8B |
| I-10 |
CAN0000764 |
3.7 |
6,593 |
125,971 |
34,065 |
3.82 |
113.9% |
1.75 |
1.55 |
$6.2M |
$29.3B |
| I-10 |
CAP00002288 |
4.2 |
6,682 |
143,655 |
33,862 |
3.34 |
123.5% |
1.48 |
1.85 |
$7.1M |
$25.6B |
| I-10 |
CAN0000766 |
4.5 |
7,835 |
137,037 |
30,756 |
3.54 |
88.9% |
1.83 |
1.33 |
$6.8M |
$50.2B |
| I-10 |
CAP00002241 |
3.2 |
7,503 |
97,542 |
30,348 |
3.68 |
115.9% |
1.68 |
1.51 |
$4.8M |
$40.4B |
| I-10 |
CAN0000762 |
1.8 |
2,911 |
34,034 |
18,473 |
6.89 |
155.2% |
2.69 |
1.48 |
$1.7M |
$16.3B |
| I-10 |
CAN0000773 |
4.6 |
5,346 |
70,965 |
15,328 |
2.94 |
101.6% |
1.39 |
1.79 |
$3.5M |
$21.6B |
| I-10 |
CAP00002293 |
3.8 |
3,452 |
53,142 |
13,943 |
4.53 |
118.6% |
1.77 |
2.06 |
$2.6M |
$14.2B |
| I-10 |
CAP00002242 |
1.2 |
3,959 |
12,912 |
11,236 |
3.21 |
117.2% |
1.45 |
1.90 |
$0.6M |
$23.1B |
| I-10 |
CAN0000771 |
1.2 |
3,437 |
11,089 |
9,482 |
4.31 |
153.9% |
1.70 |
1.47 |
$0.5M |
$13.6B |
| I-10 |
CAP00002290 |
4.6 |
5,420 |
43,529 |
9,383 |
2.37 |
81.4% |
1.29 |
1.58 |
$2.2M |
$22.8B |
| I-10 |
CAN0000767 |
2.6 |
4,951 |
17,160 |
6,496 |
2.89 |
94.9% |
1.45 |
1.71 |
$0.9M |
$23.2B |
| I-10 |
CAP00002321 |
2.7 |
10,645 |
16,801 |
6,315 |
1.50 |
26.5% |
1.19 |
1.16 |
$0.8M |
$24.8B |
| I-10 |
CAN0000770 |
5.0 |
2,902 |
31,011 |
6,204 |
2.54 |
89.4% |
1.32 |
1.72 |
$1.5M |
$13.3B |
| I-10 |
CAP00002291 |
5.4 |
10,420 |
12,095 |
2,249 |
2.05 |
60.5% |
1.25 |
1.40 |
$0.6M |
$28.3B |
Cumulative mileage of segments may not add up to the corresponding segment in the Nationally Significant Freight Highway Bottlenecks and Congested Corridors list.
Source: FHWA
Figure 80. Map. Top 40 Bottleneck Maps, Bottleneck 12, I-10 (Los Angeles, CA).
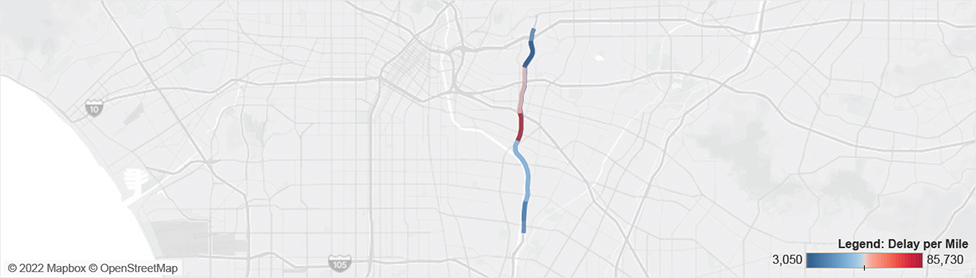
13. I-710 (Los Angeles, CA)

I-710 (Los Angeles, CA)
| Road |
Segment ID |
Length
(Miles) |
AADT
(Trucks) |
Delay
(Hours) |
Delay/ Mile |
PTI
(95th %) |
BI |
TTI |
TRI |
Cong. Cost |
FAF Value |
| I-710 |
CAN0000927 |
1.4 |
6,833 |
117,160 |
85,730 |
7.38 |
239.9% |
2.12 |
2.02 |
$5.8M |
$30.9B |
| I-710 |
CAN0000925 |
2.0 |
5,979 |
92,553 |
45,934 |
6.40 |
208.5% |
1.88 |
2.52 |
$4.6M |
$28.6B |
| I-710 |
CAN0000932 |
2.7 |
7,686 |
96,810 |
35,821 |
3.09 |
98.2% |
1.52 |
1.29 |
$4.8M |
$31.4B |
| I-710 |
CAP00002423 |
1.3 |
6,772 |
28,778 |
23,110 |
2.43 |
73.0% |
1.38 |
1.44 |
$1.4M |
$30.3B |
| I-710 |
CAP00002421 |
3.6 |
7,350 |
59,246 |
16,494 |
2.21 |
69.5% |
1.30 |
1.56 |
$2.9M |
$31.1B |
| I-710 |
CAP00002425 |
2.6 |
4,099 |
42,879 |
16,481 |
3.91 |
126.5% |
1.65 |
1.72 |
$2.1M |
$21.3B |
| I-710 |
CAN0000934 |
1.3 |
6,578 |
21,078 |
16,039 |
2.01 |
53.4% |
1.31 |
1.22 |
$1.0M |
$29.9B |
| I-710 |
CAP00002424 |
1.4 |
6,777 |
10,443 |
7,560 |
1.65 |
36.5% |
1.20 |
1.23 |
$0.5M |
$31.3B |
| I-710 |
CAN0000924 |
1.2 |
3,646 |
3,609 |
3,050 |
1.45 |
22.8% |
1.17 |
1.13 |
$0.2M |
$17.4B |
Cumulative mileage of segments may not add up to the corresponding segment in the Nationally Significant Freight Highway Bottlenecks and Congested Corridors list.
Source: FHWA
Figure 81. Map. Top 40 Bottleneck Maps, Bottleneck 13, I-710 (Los Angeles, CA).
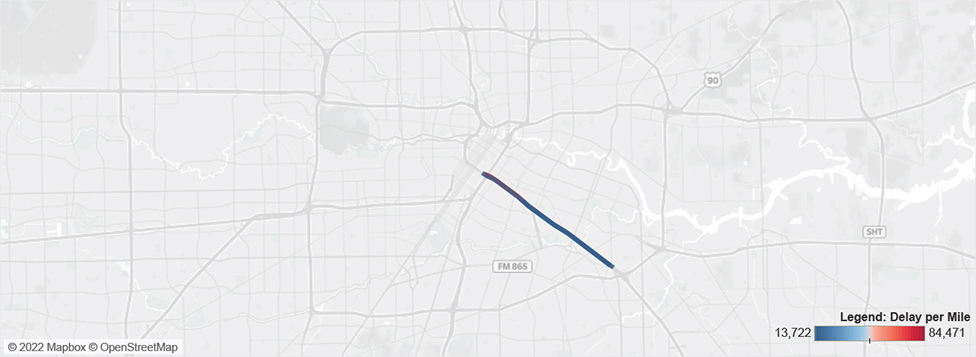
14. I-45 (Houston, TX)
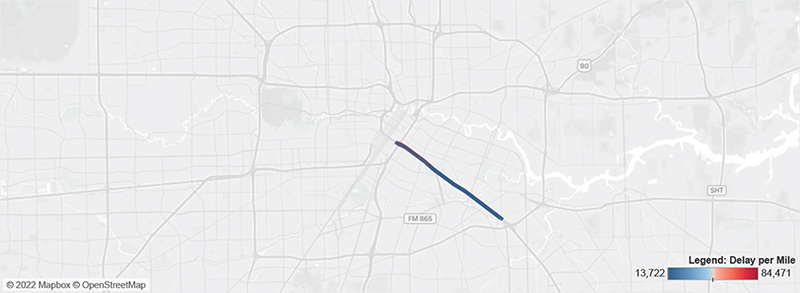
I-45 (Houston, TX)
| Road |
Segment ID |
Length
(Miles) |
AADT
(Trucks) |
Delay
(Hours) |
Delay/ Mile |
PTI
(95th %) |
BI |
TTI |
TRI |
Cong. Cost |
FAF Value |
| I-45 |
TXP00001733 |
1.6 |
7,184 |
137,629 |
84,471 |
5.78 |
142.5% |
2.34 |
1.54 |
$6.8M |
$32.8B |
| I-45 |
TXN0000266 |
5.2 |
7,135 |
73,215 |
14,101 |
1.99 |
57.1% |
1.23 |
1.65 |
$3.6M |
$32.5B |
| I-45 |
TXP00001732 |
3.7 |
7,082 |
50,610 |
13,722 |
2.25 |
68.6% |
1.29 |
1.63 |
$2.5M |
$32.2B |
Cumulative mileage of segments may not add up to the corresponding segment in the Nationally Significant Freight Highway Bottlenecks and Congested Corridors list.
Source: FHWA
Figure 82. Map. Top 40 Bottleneck Maps, Bottleneck 14, I-45 (Houston, TX).
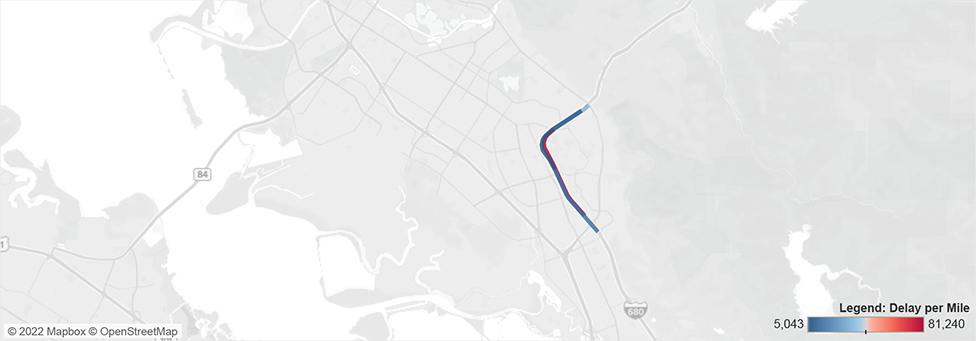
15. I-680 (San Francisco, CA)

I-680 (San Francisco, CA)
| Road |
Segment ID |
Length
(Miles) |
AADT
(Trucks) |
Delay
(Hours) |
Delay/ Mile |
PTI
(95th %) |
BI |
TTI |
TRI |
Cong. Cost |
FAF Value |
| I-680 |
CAP00001970 |
2.7 |
6,406 |
215,782 |
81,240 |
8.73 |
268.4% |
2.36 |
2.09 |
$10.7M |
$32.8B |
| I-680 |
CAP00001972 |
1.1 |
5,243 |
35,471 |
31,807 |
4.38 |
163.1% |
1.65 |
1.78 |
$1.8M |
$27.0B |
| I-680 |
CAN0000614 |
2.0 |
6,098 |
26,046 |
13,045 |
2.29 |
71.9% |
1.29 |
1.43 |
$1.3M |
$31.4B |
| I-680 |
CAN0000611 |
2.2 |
5,917 |
10,862 |
5,043 |
1.58 |
39.5% |
1.13 |
1.25 |
$0.5M |
$30.6B |
Cumulative mileage of segments may not add up to the corresponding segment in the Nationally Significant Freight Highway Bottlenecks and Congested Corridors list.
Source: FHWA
Figure 83. Map. Top 40 Bottleneck Maps, Bottleneck 15, I-680 (San Francisco, CA).
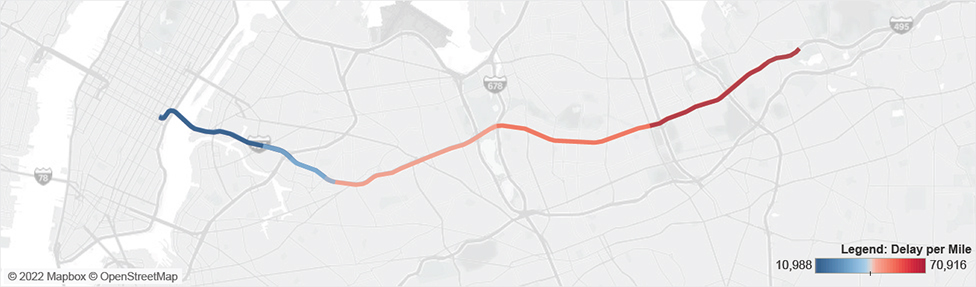
16. I-495 (New York, NY)
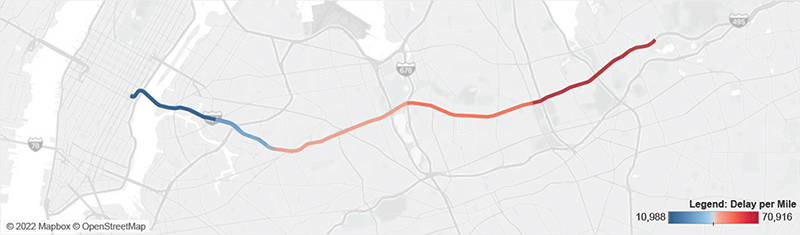
I-495 (New York, NY)
| Road |
Segment ID |
Length
(Miles) |
AADT
(Trucks) |
Delay
(Hours) |
Delay/ Mile |
PTI
(95th %) |
BI |
TTI |
TRI |
Cong. Cost |
FAF Value |
| I-495 |
NYN00002 |
3.6 |
8,988 |
256,729 |
70,916 |
4.33 |
138.6% |
1.74 |
1.81 |
$12.7M |
$44.7B |
| I-495 |
NYN0000754 |
3.4 |
5,774 |
184,180 |
54,595 |
5.31 |
178.6% |
1.89 |
1.65 |
$9.1M |
$22.1B |
| I-495 |
NYN0000746 |
3.9 |
6,650 |
184,768 |
46,878 |
4.82 |
160.9% |
1.84 |
1.58 |
$9.2M |
$21.0B |
| I-495 |
NYP0000950 |
2.9 |
7,597 |
127,281 |
44,055 |
3.78 |
116.7% |
1.72 |
1.38 |
$6.3M |
$35.8B |
| I-495 |
NYP0000951 |
3.7 |
5,788 |
156,605 |
41,894 |
4.91 |
163.2% |
1.82 |
1.78 |
$7.8M |
$22.2B |
| I-495 |
NYP0000952 |
3.9 |
6,601 |
153,641 |
39,582 |
3.59 |
94.1% |
1.68 |
1.31 |
$7.6M |
$20.6B |
| I-495 |
NYN0000190 |
1.7 |
6,713 |
56,001 |
32,214 |
5.28 |
207.5% |
1.71 |
2.83 |
$2.8M |
$19.9B |
| I-495 |
NYP0000981 |
2.7 |
3,129 |
57,997 |
21,682 |
6.08 |
162.8% |
2.25 |
1.53 |
$2.9M |
$11.5B |
| I-495 |
NYP0000980 |
1.3 |
6,728 |
23,393 |
17,839 |
13.65 |
392.8% |
2.76 |
2.12 |
$1.2M |
$19.9B |
| I-495 |
NYN0000193 |
3.2 |
3,846 |
34,602 |
10,988 |
4.37 |
151.8% |
1.71 |
1.38 |
$1.7M |
$14.5B |
Cumulative mileage of segments may not add up to the corresponding segment in the Nationally Significant Freight Highway Bottlenecks and Congested Corridors list.
Source: FHWA
Figure 84. Map. Top 40 Bottleneck Maps, Bottleneck 16, I-495 (New York, NY).
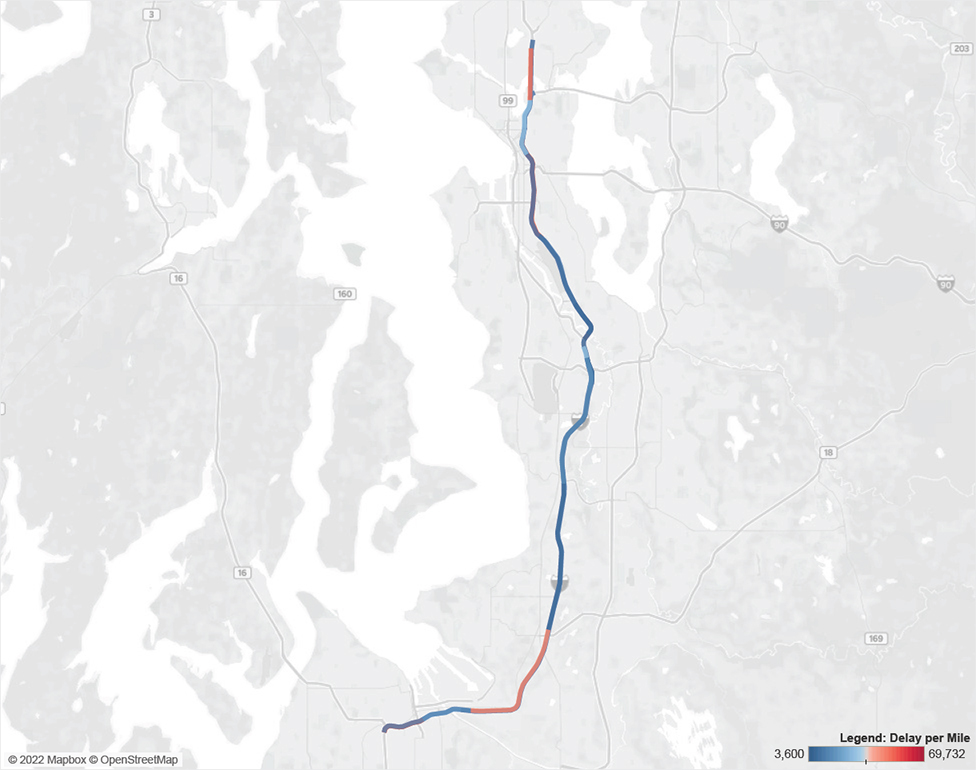
17. I-5 (Seattle-Tacoma, WA)

I-5 (Seattle, WA)
| Road |
Segment ID |
Length
(Miles) |
AADT
(Trucks) |
Delay
(Hours) |
Delay/ Mile |
PTI
(95th %) |
BI |
TTI |
TRI |
Cong. Cost |
FAF Value |
| I-5 |
WAP0000515 |
2.0 |
6,876 |
139,061 |
69,732 |
6.43 |
194.0% |
2.21 |
1.66 |
$6.9M |
$26.5B |
| I-5 |
WAP0000525 |
4.9 |
6,786 |
247,039 |
50,401 |
5.02 |
156.4% |
1.94 |
1.54 |
$12.2M |
$28.6B |
| I-5 |
WAN0000180 |
2.3 |
5,002 |
115,230 |
49,980 |
6.73 |
209.1% |
2.17 |
1.84 |
$5.7M |
$16.8B |
| I-5 |
WAN0000191 |
5.9 |
6,758 |
276,422 |
46,713 |
4.99 |
183.2% |
1.76 |
1.74 |
$13.7M |
$27.3B |
| I-5 |
WAN0000187 |
0.6 |
8,808 |
16,918 |
30,519 |
2.48 |
93.7% |
1.29 |
1.82 |
$0.8M |
$35.6B |
| I-5 |
WAN0000181 |
2.6 |
4,934 |
77,742 |
30,333 |
4.62 |
141.3% |
1.88 |
1.46 |
$3.9M |
$17.5B |
| I-5 |
WAP0000516 |
1.8 |
7,319 |
46,227 |
25,487 |
2.19 |
52.2% |
1.39 |
1.18 |
$2.3M |
$29.3B |
| I-5 |
WAN0000188 |
1.8 |
8,905 |
29,183 |
16,587 |
3.67 |
163.1% |
1.40 |
2.60 |
$1.4M |
$35.3B |
| I-5 |
WAP0000524 |
3.5 |
7,557 |
58,128 |
16,531 |
2.68 |
98.0% |
1.28 |
1.89 |
$2.9M |
$30.6B |
| I-5 |
WAN0000192 |
4.3 |
7,095 |
65,804 |
15,401 |
2.06 |
57.1% |
1.30 |
1.42 |
$3.3M |
$28.0B |
| I-5 |
WAN0000189 |
5.7 |
8,104 |
85,586 |
14,927 |
2.46 |
90.6% |
1.25 |
1.91 |
$4.2M |
$32.7B |
| I-5 |
WAP0000518 |
7.7 |
6,961 |
102,965 |
13,332 |
2.28 |
87.2% |
1.21 |
1.93 |
$5.1M |
$28.2B |
| I-5 |
WAP0000527 |
2.2 |
4,524 |
26,054 |
11,922 |
2.41 |
84.4% |
1.30 |
1.75 |
$1.3M |
$17.1B |
| I-5 |
WAP0000519 |
5.6 |
8,176 |
62,528 |
11,122 |
1.94 |
62.8% |
1.19 |
1.54 |
$3.1M |
$32.9B |
| I-5 |
WAP0000528 |
2.3 |
4,960 |
23,217 |
10,242 |
2.33 |
88.1% |
1.23 |
1.92 |
$1.1M |
$16.6B |
| I-5 |
WAP0000517 |
5.8 |
6,828 |
55,592 |
9,561 |
1.72 |
46.5% |
1.16 |
1.39 |
$2.8M |
$27.6B |
| I-5 |
WAP0000526 |
1.2 |
4,181 |
10,826 |
9,313 |
2.03 |
57.4% |
1.28 |
1.55 |
$0.5M |
$15.3B |
| I-5 |
WAN0000185 |
9.9 |
6,935 |
88,680 |
8,945 |
1.55 |
31.6% |
1.17 |
1.21 |
$4.4M |
$28.9B |
| I-5 |
WAP0000522 |
1.3 |
8,334 |
10,181 |
8,008 |
1.38 |
20.7% |
1.15 |
1.15 |
$0.5M |
$33.8B |
| I-5 |
WAN0000190 |
6.7 |
6,956 |
51,021 |
7,631 |
1.57 |
38.0% |
1.13 |
1.32 |
$2.5M |
$28.2B |
| I-5 |
WAP0000521 |
1.2 |
8,859 |
5,227 |
4,285 |
1.35 |
16.6% |
1.15 |
1.12 |
$0.3M |
$35.1B |
| I-5 |
WAP0000523 |
1.9 |
7,033 |
6,901 |
3,600 |
1.21 |
11.9% |
1.08 |
1.08 |
$0.3M |
$28.4B |
Cumulative mileage of segments may not add up to the corresponding segment in the Nationally Significant Freight Highway Bottlenecks and Congested Corridors list.
Source: FHWA
Figure 85. Map. Top 40 Bottleneck Maps, Bottleneck 17, I-5 (Seattle-Tacoma, WA).
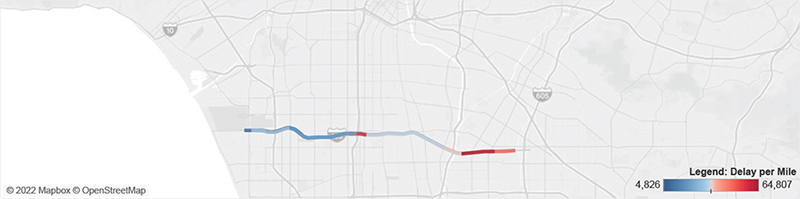
18. I-5 (Los Angeles, CA)
I-5 (Los Angeles, CA)
| Road |
Segment ID |
Length
(Miles) |
AADT
(Trucks) |
Delay
(Hours) |
Delay/ Mile |
PTI
(95th %) |
BI |
TTI |
TRI |
Cong. Cost |
FAF Value |
| I-5 |
CAN00001085 |
2.4 |
7,097 |
164,580 |
68,560 |
6.80 |
224.0% |
2.10 |
2.01 |
$8.2M |
$35.1B |
| I-5 |
CAP00002299 |
1.1 |
6,029 |
56,400 |
52,950 |
5.64 |
181.3% |
2.00 |
1.57 |
$2.8M |
$28.1B |
| I-5 |
CAN00001086 |
5.5 |
5,439 |
289,298 |
52,781 |
5.60 |
172.6% |
2.02 |
1.67 |
$14.3M |
$20.9B |
| I-5 |
CAP00002568 |
2.3 |
6,131 |
113,458 |
49,860 |
5.18 |
135.2% |
2.19 |
1.33 |
$5.6M |
$31.8B |
| I-5 |
CAP00002555 |
3.0 |
5,574 |
146,794 |
49,016 |
4.86 |
116.3% |
2.16 |
1.46 |
$7.3M |
$23.7B |
| I-5 |
CAN00001117 |
4.2 |
7,180 |
194,921 |
46,336 |
3.97 |
119.9% |
1.79 |
1.43 |
$9.7M |
$36.0B |
| I-5 |
CAP00002569 |
1.8 |
6,021 |
76,669 |
42,204 |
3.77 |
104.4% |
1.83 |
1.39 |
$3.8M |
$28.6B |
| I-5 |
CAP00002558 |
2.2 |
7,136 |
92,954 |
41,881 |
3.94 |
133.7% |
1.68 |
1.66 |
$4.6M |
$34.3B |
| I-5 |
CAN00001118 |
2.3 |
6,262 |
95,535 |
41,798 |
3.62 |
103.0% |
1.77 |
1.36 |
$4.7M |
$30.3B |
| I-5 |
CAN00001087 |
1.5 |
7,492 |
58,407 |
38,377 |
3.03 |
82.5% |
1.66 |
1.29 |
$2.9M |
$28.9B |
| I-5 |
CAP00002556 |
2.0 |
7,241 |
69,105 |
34,170 |
3.75 |
153.2% |
1.48 |
2.23 |
$3.4M |
$27.6B |
| I-5 |
CAN0000822 |
1.7 |
6,178 |
48,237 |
28,629 |
4.39 |
156.0% |
1.67 |
2.02 |
$2.4M |
$29.5B |
| I-5 |
CAN00001088 |
2.8 |
6,021 |
57,174 |
20,210 |
2.76 |
92.6% |
1.43 |
1.52 |
$2.8M |
$25.0B |
| I-5 |
CAP00002570 |
4.3 |
7,144 |
79,341 |
18,591 |
2.54 |
90.1% |
1.33 |
1.63 |
$3.9M |
$35.8B |
| I-5 |
CAP00002557 |
5.1 |
5,387 |
71,645 |
13,927 |
2.23 |
68.7% |
1.31 |
1.37 |
$3.5M |
$20.9B |
| I-5 |
CAN00001119 |
1.7 |
6,032 |
19,664 |
11,298 |
2.28 |
60.6% |
1.41 |
1.23 |
$1.0M |
$32.5B |
Cumulative mileage of segments may not add up to the corresponding segment in the Nationally Significant Freight Highway Bottlenecks and Congested Corridors list.
Source: FHWA
Figure 86. Map. Top 40 Bottleneck Maps, Bottleneck 18, I-5 (Los Angeles, CA).
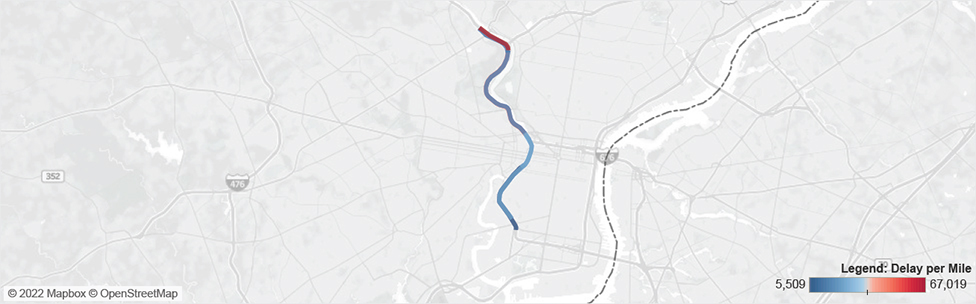
19. I-76 (Philadelphia, PA)
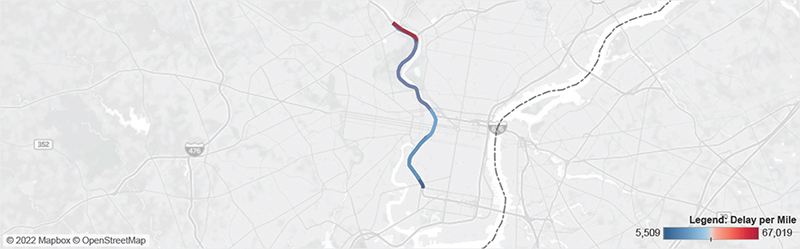
I-76 (Philadelphia, PA)
| Road |
Segment ID |
Length
(Miles) |
AADT
(Trucks) |
Delay
(Hours) |
Delay/ Mile |
PTI
(95th %) |
BI |
TTI |
TRI |
Cong. Cost |
FAF Value |
| I-76 |
PAN0000240 |
1.2 |
4,605 |
82,470 |
67,019 |
7.94 |
214.2% |
2.52 |
1.79 |
$4.1M |
$15.7B |
| I-76 |
PAP00001264 |
1.1 |
4,627 |
44,566 |
40,501 |
4.42 |
140.4% |
1.84 |
1.59 |
$2.2M |
$14.6B |
| I-76 |
PAP00001263 |
2.4 |
4,982 |
95,137 |
39,538 |
5.13 |
168.6% |
1.92 |
1.71 |
$4.7M |
$15.9B |
| I-76 |
PAP00001265 |
1.2 |
3,937 |
35,359 |
28,883 |
4.43 |
141.6% |
1.82 |
1.62 |
$1.8M |
$12.4B |
| I-76 |
PAN0000238 |
3.3 |
2,838 |
76,855 |
23,086 |
4.95 |
145.7% |
1.93 |
1.75 |
$3.8M |
$9.8B |
| I-76 |
PAN0000239 |
3.6 |
4,861 |
49,501 |
13,954 |
2.41 |
79.6% |
1.32 |
1.62 |
$2.5M |
$15.5B |
| I-76 |
PAP00001262 |
1.3 |
4,677 |
17,467 |
13,742 |
2.83 |
96.8% |
1.38 |
1.89 |
$0.9M |
$15.9B |
| I-76 |
PAP00001266 |
2.6 |
2,597 |
14,208 |
5,509 |
1.78 |
41.1% |
1.24 |
1.22 |
$0.7M |
$8.7B |
Cumulative mileage of segments may not add up to the corresponding segment in the Nationally Significant Freight Highway Bottlenecks and Congested Corridors list.
Source: FHWA
Figure 87. Map. Top 40 Bottleneck Maps, Bottleneck 19, I-76 (Philadelphia, PA).
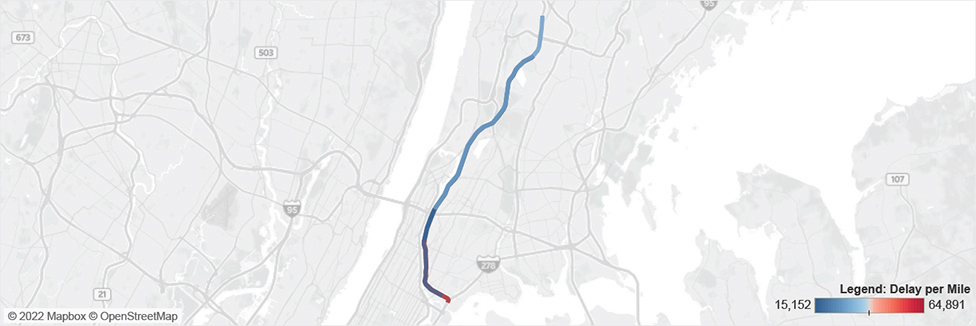
20. I-87 (New York, NY)

I-87 (New York, NY)
| Road |
Segment ID |
Length
(Miles) |
AADT
(Trucks) |
Delay
(Hours) |
Delay/ Mile |
PTI
(95th %) |
BI |
TTI |
TRI |
Cong. Cost |
FAF Value |
| I-87 |
NYP0000891 |
2.6 |
4,900 |
166,565 |
64,891 |
7.54 |
218.4% |
2.35 |
1.99 |
$8.2M |
$18.0B |
| I-87 |
NYN0000119 |
7.8 |
4,996 |
229,106 |
29,240 |
3.72 |
102.7% |
1.66 |
1.60 |
$11.3M |
$26.9B |
| I-87 |
NYN0000120 |
3.3 |
4,729 |
56,944 |
17,134 |
3.17 |
106.2% |
1.49 |
1.62 |
$2.8M |
$16.8B |
| I-87 |
NYP0000892 |
7.6 |
4,888 |
115,220 |
15,152 |
2.65 |
70.3% |
1.40 |
1.41 |
$5.7M |
$23.6B |
Cumulative mileage of segments may not add up to the corresponding segment in the Nationally Significant Freight Highway Bottlenecks and Congested Corridors list.
Source: FHWA
Figure 88. Map. Top 40 Bottleneck Maps, Bottleneck 20, I-87 (New York, NY).
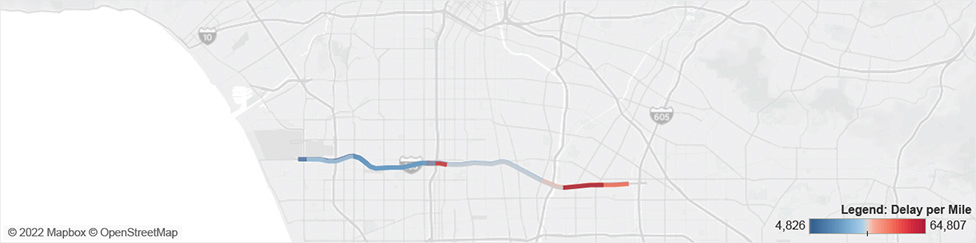
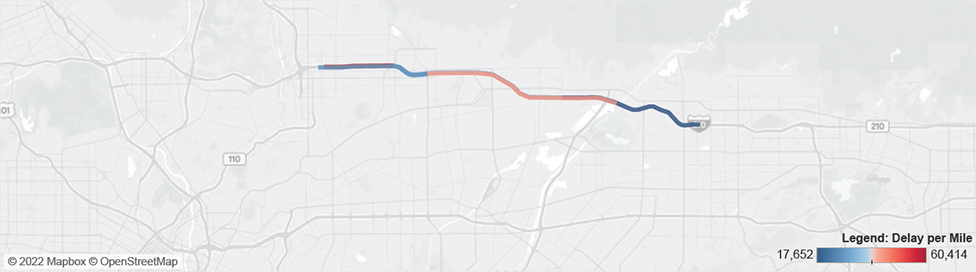
21. I-105 (Los Angeles, CA)
I-105 (Los Angeles, CA)
| Road |
Segment ID |
Length
(Miles) |
AADT
(Trucks) |
Delay
(Hours) |
Delay/ Mile |
PTI
(95th %) |
BI |
TTI |
TRI |
Cong. Cost |
FAF Value |
| I-105 |
CAN0000844 |
2.0 |
7,397 |
131,310 |
64,807 |
4.54 |
112.2% |
2.02 |
1.34 |
$6.5M |
$31.2B |
| I-105 |
CAN0000842 |
1.0 |
6,352 |
61,372 |
58,993 |
7.96 |
287.1% |
2.00 |
4.72 |
$3.0M |
$21.2B |
| I-105 |
CAN0000846 |
1.3 |
7,693 |
60,971 |
48,653 |
4.73 |
178.1% |
1.69 |
1.97 |
$3.0M |
$34.7B |
| I-105 |
CAP00002325 |
3.2 |
7,315 |
132,536 |
41,970 |
4.16 |
118.5% |
1.75 |
1.49 |
$6.6M |
$31.0B |
| I-105 |
CAN0000843 |
6.1 |
6,266 |
208,456 |
34,180 |
4.25 |
137.5% |
1.70 |
1.59 |
$10.3M |
$23.8B |
| I-105 |
CAP00002323 |
1.2 |
7,680 |
39,637 |
32,489 |
3.24 |
114.4% |
1.49 |
1.55 |
$2.0M |
$34.7B |
| I-105 |
CAN0000840 |
2.4 |
4,576 |
76,600 |
32,485 |
6.09 |
188.3% |
1.93 |
2.25 |
$3.8M |
$16.1B |
| I-105 |
CAP00002327 |
6.2 |
6,128 |
151,696 |
24,461 |
3.31 |
113.3% |
1.53 |
1.80 |
$7.5M |
$21.8B |
| I-105 |
CAN0000841 |
4.3 |
6,003 |
91,756 |
21,162 |
3.41 |
110.9% |
1.54 |
1.57 |
$4.5M |
$18.5B |
| I-105 |
CAP00002328 |
3.8 |
5,998 |
66,597 |
17,668 |
2.94 |
94.9% |
1.46 |
1.41 |
$3.3M |
$18.5B |
| I-105 |
CAP00002329 |
2.3 |
4,949 |
11,250 |
4,826 |
1.94 |
54.8% |
1.25 |
1.28 |
$0.6M |
$15.6B |
Cumulative mileage of segments may not add up to the corresponding segment in the Nationally Significant Freight Highway Bottlenecks and Congested Corridors list.
Source: FHWA
Figure 89. Map. Top 40 Bottleneck Maps, Bottleneck 21, I-105 (Los Angeles, CA).
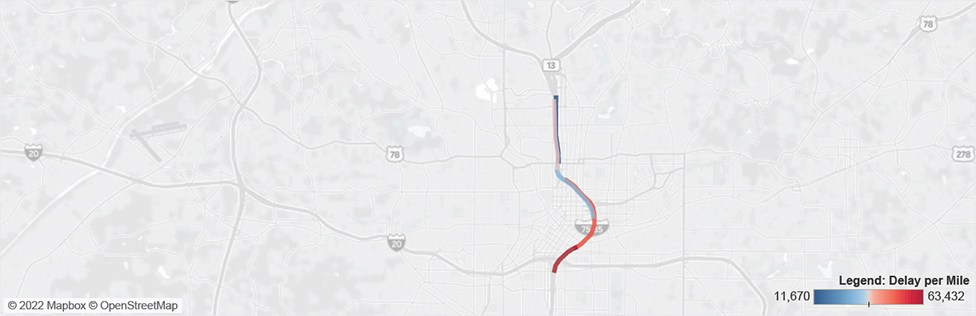
22. I-75/I-85 (Atlanta, GA)
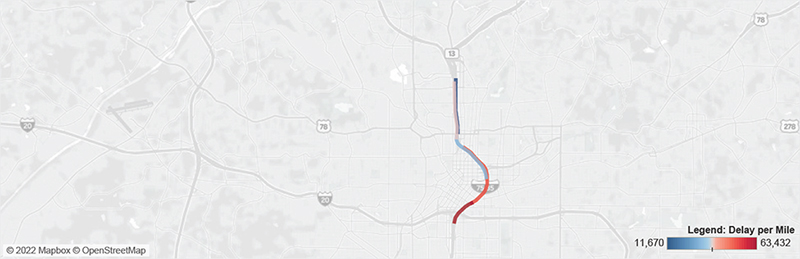
I-75/I-85 (Atlanta, GA)
| Road |
Segment ID |
Length
(Miles) |
AADT
(Trucks) |
Delay
(Hours) |
Delay/ Mile |
PTI
(95th %) |
BI |
TTI |
TRI |
Cong. Cost |
FAF Value |
| I-75/I-85 |
GAP0000853 |
0.7 |
7,355 |
43,279 |
63,432 |
5.53 |
172.4% |
2.03 |
1.52 |
$2.1M |
$29.7B |
| I-75/I-85 |
GAP0000855 |
1.7 |
7,355 |
92,129 |
53,243 |
4.18 |
116.7% |
1.91 |
1.38 |
$4.6M |
$29.7B |
| I-75/I-85 |
GAN000035 |
1.3 |
4,489 |
50,618 |
38,091 |
5.58 |
163.0% |
2.12 |
1.69 |
$2.5M |
$29.6B |
| I-75/I-85 |
GAN000036 |
1.3 |
7,355 |
38,761 |
30,181 |
4.17 |
144.2% |
1.71 |
1.78 |
$1.9M |
$29.7B |
| I-75/I-85 |
GAP0000858 |
1.3 |
7,355 |
14,948 |
11,670 |
1.82 |
42.2% |
1.27 |
1.21 |
$0.7M |
$29.7B |
Cumulative mileage of segments may not add up to the corresponding segment in the Nationally Significant Freight Highway Bottlenecks and Congested Corridors list.
Source: FHWA
Figure 90. Map. Top 40 Bottleneck Maps, Bottleneck 22, I-75/I-85 (Atlanta, GA).
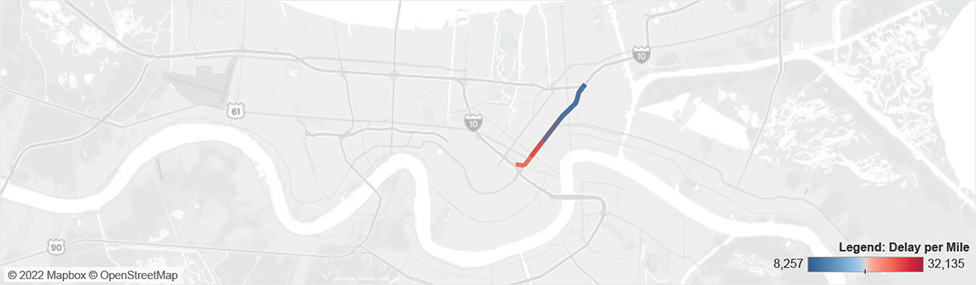
23. I-10 (New Orleans, LA)
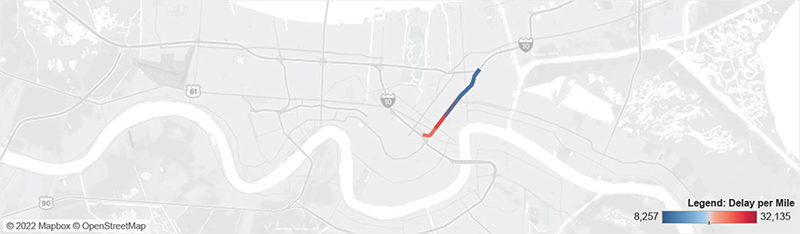
I-10 (New Orleans, LA)
| Road |
Segment ID |
Length
(Miles) |
AADT
(Trucks) |
Delay
(Hours) |
Delay/ Mile |
PTI
(95th %) |
BI |
TTI |
TRI |
Cong. Cost |
FAF Value |
| I-10 |
LAP0000481 |
1.5 |
5,515 |
48,955 |
32,135 |
5.04 |
168.0% |
1.87 |
1.88 |
$2.4M |
$13.8B |
| I-10 |
LAN0000148 |
1.3 |
7,136 |
34,374 |
26,711 |
2.80 |
95.8% |
1.42 |
1.50 |
$1.7M |
$18.7B |
| I-10 |
LAN0000153 |
2.5 |
5,515 |
26,441 |
10,779 |
2.65 |
92.7% |
1.32 |
1.73 |
$1.3M |
$13.8B |
| I-10 |
LAP0000479 |
1.5 |
5,515 |
12,572 |
8,257 |
2.22 |
70.8% |
1.27 |
1.34 |
$0.6M |
$13.8B |
Cumulative mileage of segments may not add up to the corresponding segment in the Nationally Significant Freight Highway Bottlenecks and Congested Corridors list.
Source: FHWA
Figure 91. Map. Top 40 Bottleneck Maps, Bottleneck 23, I-10 (New Orleans, LA).
24. I-10 (Lake Charles, LA)

I-10 (Lake Charles, LA)
| Road |
Segment ID |
Length
(Miles) |
AADT
(Trucks) |
Delay
(Hours) |
Delay/ Mile |
PTI
(95th %) |
BI |
TTI |
TRI |
Cong. Cost |
FAF Value |
| I-10 |
LAN0000210 |
9.3 |
14,179 |
567,191 |
61,114 |
4.12 |
153.8% |
1.43 |
3.60 |
$28.1M |
$41.0B |
| I-10 |
LAP0000574 |
9.3 |
14,054 |
71,257 |
7,694 |
1.26 |
16.6% |
1.07 |
1.16 |
$3.5M |
$40.7B |
Cumulative mileage of segments may not add up to the corresponding segment in the Nationally Significant Freight Highway Bottlenecks and Congested Corridors list.
Source: FHWA
Figure 92. Map. Top 40 Bottleneck Maps, Bottleneck 24, I-10 (Lake Charles, LA).
25. I-210 (Los Angeles, CA)
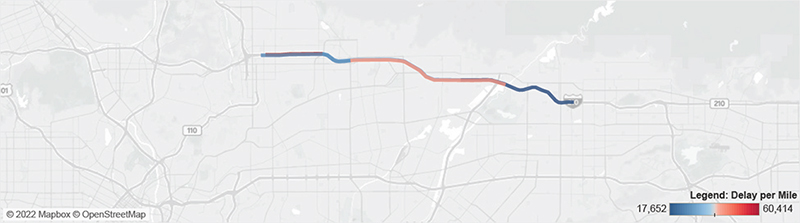
I-210 (Los Angeles, CA)
| Road |
Segment ID |
Length
(Miles) |
AADT
(Trucks) |
Delay
(Hours) |
Delay/ Mile |
PTI
(95th %) |
BI |
TTI |
TRI |
Cong. Cost |
FAF Value |
| I-210 |
CAP00002624 |
2.6 |
10,007 |
155,249 |
60,414 |
3.72 |
120.4% |
1.68 |
1.35 |
$7.7M |
$69.8B |
| I-210 |
CAN00001176 |
7.3 |
8,154 |
311,539 |
42,787 |
3.88 |
157.2% |
1.50 |
1.83 |
$15.4M |
$40.3B |
| I-210 |
CAP00002623 |
3.5 |
7,987 |
110,244 |
31,651 |
3.00 |
117.1% |
1.37 |
1.74 |
$5.5M |
$40.6B |
| I-210 |
CAP00002622 |
3.1 |
6,953 |
87,843 |
28,249 |
3.25 |
129.3% |
1.41 |
1.70 |
$4.4M |
$33.4B |
| I-210 |
CAN00001175 |
4.1 |
8,473 |
111,818 |
27,092 |
2.75 |
103.3% |
1.33 |
1.49 |
$5.5M |
$55.1B |
| I-210 |
CAP00002621 |
5.4 |
6,857 |
95,887 |
17,652 |
2.23 |
75.2% |
1.26 |
1.49 |
$4.7M |
$33.1B |
Cumulative mileage of segments may not add up to the corresponding segment in the Nationally Significant Freight Highway Bottlenecks and Congested Corridors list.
Source: FHWA
Figure 93. Map. Top 40 Bottleneck Maps, Bottleneck 25, I-210 (Los Angeles, CA).
26. I-10 (Baton Rouge, LA)
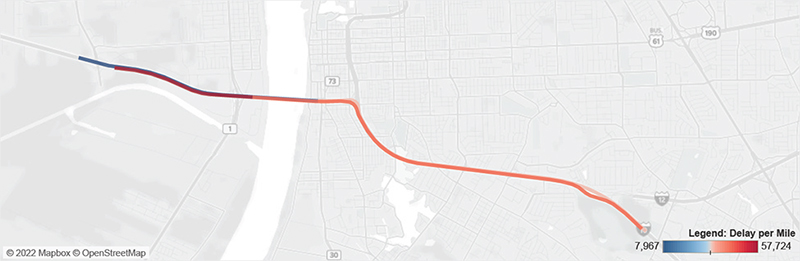
I-10 (Baton Rouge, LA)
| Road |
Segment ID |
Length
(Miles) |
AADT
(Trucks) |
Delay
(Hours) |
Delay/ Mile |
PTI
(95th %) |
BI |
TTI |
TRI |
Cong. Cost |
FAF Value |
| I-10 |
LAN0000222 |
2.2 |
10,718 |
124,256 |
57,724 |
5.10 |
234.9% |
1.52 |
3.97 |
$6.2M |
$31.3B |
| I-10 |
LAN0000223 |
6.6 |
11,003 |
289,810 |
44,116 |
2.88 |
81.2% |
1.49 |
1.50 |
$14.4M |
$29.4B |
| I-10 |
LAP0000561 |
5.7 |
11,600 |
194,500 |
34,139 |
2.50 |
86.2% |
1.33 |
1.87 |
$9.6M |
$30.5B |
| I-10 |
LAP0000563 |
1.1 |
7,623 |
13,356 |
12,562 |
1.74 |
49.0% |
1.17 |
1.48 |
$0.7M |
$19.4B |
| I-10 |
LAP0000565 |
2.7 |
10,223 |
21,084 |
7,967 |
1.18 |
7.7% |
1.10 |
1.08 |
$1.0M |
$29.7B |
Cumulative mileage of segments may not add up to the corresponding segment in the Nationally Significant Freight Highway Bottlenecks and Congested Corridors list.
Source: FHWA
Figure 94. Map. Top 40 Bottleneck Maps, Bottleneck 26, I-10 (Baton Rouge, LA).
27. I-25 (Denver, CO)
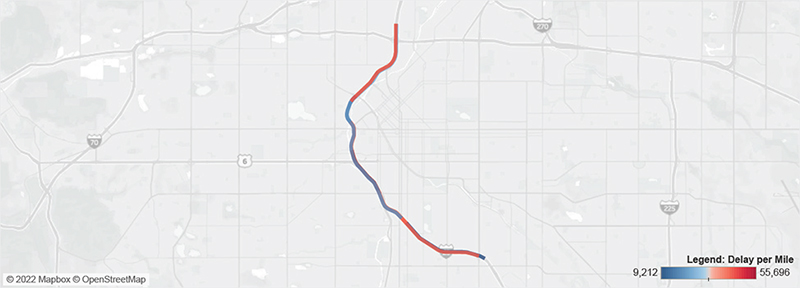
I-25 (Denver, CO)
| Road |
Segment ID |
Length
(Miles) |
AADT
(Trucks) |
Delay
(Hours) |
Delay/ Mile |
PTI
(95th %) |
BI |
TTI |
TRI |
Cong. Cost |
FAF Value |
| I-25 |
COP0000532 |
1.7 |
7,030 |
91,776 |
55,696 |
5.00 |
166.4% |
1.88 |
1.72 |
$4.5M |
$18.9B |
| I-25 |
CON0000180 |
3.0 |
12,173 |
139,104 |
46,212 |
2.88 |
99.0% |
1.44 |
1.51 |
$6.9M |
$29.6B |
| I-25 |
CON0000183 |
2.9 |
6,771 |
126,825 |
44,049 |
5.29 |
204.6% |
1.72 |
2.25 |
$6.3M |
$16.7B |
| I-25 |
COP0000533 |
1.3 |
8,003 |
53,951 |
41,825 |
4.24 |
139.7% |
1.76 |
1.58 |
$2.7M |
$20.4B |
| I-25 |
COP0000531 |
1.4 |
6,311 |
58,284 |
40,822 |
4.40 |
168.2% |
1.62 |
2.03 |
$2.9M |
$15.8B |
| I-25 |
COP0000534 |
4.3 |
11,542 |
107,476 |
24,740 |
2.75 |
99.9% |
1.34 |
1.68 |
$5.3M |
$28.4B |
| I-25 |
CON0000182 |
4.9 |
7,399 |
85,728 |
17,671 |
2.29 |
74.1% |
1.31 |
1.58 |
$4.2M |
$19.1B |
| I-25 |
COP0000530 |
2.8 |
6,809 |
25,952 |
9,212 |
1.99 |
62.7% |
1.22 |
1.52 |
$1.3M |
$16.7B |
Cumulative mileage of segments may not add up to the corresponding segment in the Nationally Significant Freight Highway Bottlenecks and Congested Corridors list.
Source: FHWA
Figure 95. Map. Top 40 Bottleneck Maps, Bottleneck 27, I-25 (Denver, CO).
28. I-5 (Portland, OR)
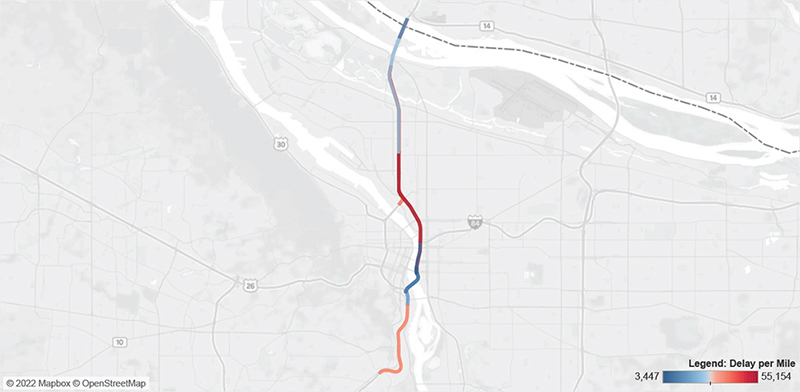
I-5 (Portland, OR)
| Road |
Segment ID |
Length
(Miles) |
AADT
(Trucks) |
Delay
(Hours) |
Delay/ Mile |
PTI
(95th %) |
BI |
TTI |
TRI |
Cong. Cost |
FAF Value |
| I-5 |
ORN0000140 |
2.8 |
7,988 |
156,900 |
55,154 |
5.17 |
176.5% |
1.81 |
1.95 |
$7.8M |
$27.4B |
| I-5 |
ORP0000431 |
2.7 |
5,706 |
141,594 |
53,299 |
6.36 |
246.9% |
1.84 |
2.36 |
$7.0M |
$22.6B |
| I-5 |
ORP0000430 |
4.6 |
6,562 |
176,824 |
38,818 |
5.46 |
218.8% |
1.67 |
3.32 |
$8.8M |
$25.1B |
| I-5 |
ORP0000428 |
2.7 |
6,478 |
101,790 |
37,526 |
4.01 |
174.6% |
1.45 |
2.37 |
$5.0M |
$22.6B |
| I-5 |
ORP0000432 |
1.5 |
5,932 |
44,758 |
29,755 |
3.08 |
97.8% |
1.52 |
1.23 |
$2.2M |
$23.1B |
| I-5 |
ORN0000137 |
3.5 |
5,782 |
85,884 |
24,359 |
3.31 |
124.8% |
1.42 |
1.94 |
$4.3M |
$22.8B |
| I-5 |
ORP0000429 |
1.6 |
6,403 |
27,462 |
16,798 |
4.03 |
155.1% |
1.56 |
1.86 |
$1.4M |
$23.6B |
| I-5 |
ORN0000136 |
0.6 |
5,742 |
6,801 |
10,653 |
1.94 |
55.8% |
1.24 |
1.36 |
$0.3M |
$22.4B |
| I-5 |
ORN0000143 |
1.0 |
6,746 |
8,927 |
9,206 |
2.90 |
127.9% |
1.28 |
2.31 |
$0.4M |
$24.8B |
| I-5 |
ORN0000141 |
1.0 |
3,803 |
3,347 |
3,447 |
1.59 |
32.3% |
1.20 |
1.23 |
$0.2M |
$14.7B |
Cumulative mileage of segments may not add up to the corresponding segment in the Nationally Significant Freight Highway Bottlenecks and Congested Corridors list.
Source: FHWA
Figure 96. Map. Top 40 Bottleneck Maps, Bottleneck 28, I-5 (Portland, OR).
29. I-55 (Chicago, IL)
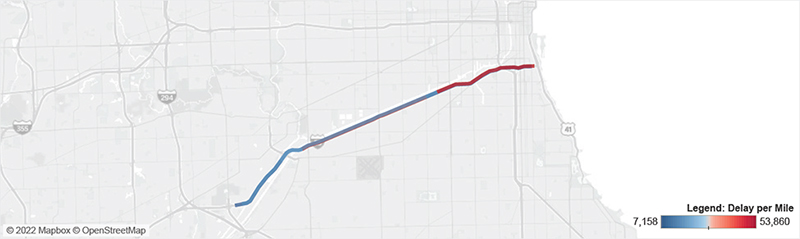
I-55 (Chicago, IL)
| Road |
Segment ID |
Length
(Miles) |
AADT
(Trucks) |
Delay
(Hours) |
Delay/ Mile |
PTI
(95th %) |
BI |
TTI |
TRI |
Cong. Cost |
FAF Value |
| I-55 |
ILP00001121 |
5.7 |
7,376 |
308,860 |
53,860 |
4.67 |
159.7% |
1.76 |
1.68 |
$15.3M |
$31.7B |
| I-55 |
ILN0000201 |
4.4 |
5,900 |
226,806 |
51,688 |
5.88 |
205.8% |
1.88 |
2.24 |
$11.2M |
$24.0B |
| I-55 |
ILP00001120 |
1.1 |
6,850 |
24,366 |
22,080 |
3.04 |
122.1% |
1.36 |
1.98 |
$1.2M |
$30.9B |
| I-55 |
ILN0000202 |
9.9 |
7,126 |
175,194 |
17,667 |
2.18 |
66.2% |
1.28 |
1.45 |
$8.7M |
$31.2B |
| I-55 |
ILP00001119 |
2.9 |
6,850 |
32,447 |
11,387 |
1.92 |
63.0% |
1.18 |
1.59 |
$1.6M |
$30.9B |
| I-55 |
ILP00001123 |
3.6 |
5,900 |
38,795 |
10,828 |
1.88 |
51.1% |
1.23 |
1.36 |
$1.9M |
$24.0B |
| I-55 |
ILP00001124 |
1.2 |
5,900 |
8,646 |
7,158 |
1.87 |
42.5% |
1.31 |
1.45 |
$0.4M |
$24.0B |
Cumulative mileage of segments may not add up to the corresponding segment in the Nationally Significant Freight Highway Bottlenecks and Congested Corridors list.
Source: FHWA
Figure 97. Map. Top 40 Bottleneck Maps, Bottleneck 29, I-55 (Chicago, IL).
30. I-285 (Atlanta, GA)
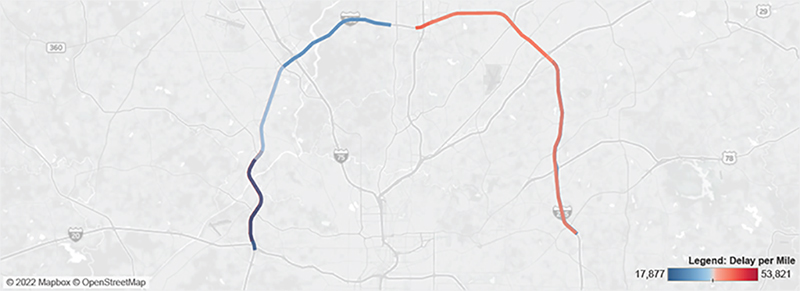
I-285 (Atlanta, GA)
| Road |
Segment ID |
Length
(Miles) |
AADT
(Trucks) |
Delay
(Hours) |
Delay/ Mile |
PTI
(95th %) |
BI |
TTI |
TRI |
Cong. Cost |
FAF Value |
| I-285 |
GAP0000982 |
1.6 |
11,855 |
87,447 |
53,821 |
3.43 |
128.1% |
1.51 |
1.58 |
$4.3M |
$62.1B |
| I-285 |
GAP0000981 |
3.0 |
11,855 |
152,206 |
50,329 |
3.49 |
134.8% |
1.48 |
1.65 |
$7.5M |
$62.1B |
| I-285 |
GAP00001010 |
0.9 |
10,297 |
40,787 |
45,429 |
4.03 |
174.7% |
1.47 |
2.83 |
$2.0M |
$51.6B |
| I-285 |
GAN0000170 |
6.3 |
9,338 |
268,811 |
42,905 |
3.94 |
154.9% |
1.45 |
2.29 |
$13.3M |
$45.8B |
| I-285 |
GAN0000172 |
8.7 |
9,437 |
360,087 |
41,378 |
3.92 |
162.0% |
1.46 |
2.36 |
$17.8M |
$46.2B |
| I-285 |
GAP00001007 |
2.2 |
8,876 |
82,837 |
36,941 |
4.41 |
205.0% |
1.44 |
3.33 |
$4.1M |
$42.8B |
| I-285 |
GAP0000980 |
4.1 |
11,288 |
151,897 |
36,880 |
3.15 |
131.6% |
1.36 |
2.39 |
$7.5M |
$58.5B |
| I-285 |
GAP00001008 |
4.4 |
9,541 |
154,380 |
35,205 |
3.36 |
134.9% |
1.43 |
1.97 |
$7.6M |
$47.0B |
| I-285 |
GAP00001012 |
5.7 |
10,297 |
190,378 |
33,590 |
3.11 |
127.2% |
1.33 |
2.12 |
$9.4M |
$51.6B |
| I-285 |
GAN0000138 |
4.6 |
11,346 |
147,293 |
32,076 |
2.66 |
102.0% |
1.31 |
1.83 |
$7.3M |
$58.9B |
| I-285 |
GAP00001014 |
4.0 |
9,729 |
105,033 |
25,993 |
2.63 |
103.0% |
1.29 |
1.98 |
$5.2M |
$47.3B |
| I-285 |
GAN0000166 |
5.7 |
10,297 |
142,339 |
24,915 |
2.89 |
127.4% |
1.26 |
2.46 |
$7.1M |
$51.6B |
| I-285 |
GAP00001015 |
4.4 |
9,182 |
98,602 |
22,603 |
2.20 |
70.3% |
1.29 |
1.41 |
$4.9M |
$45.2B |
| I-285 |
GAN0000137 |
2.5 |
11,855 |
46,275 |
18,702 |
1.84 |
56.0% |
1.17 |
1.63 |
$2.3M |
$62.1B |
| I-285 |
GAN0000136 |
2.1 |
11,855 |
37,077 |
17,877 |
1.60 |
37.5% |
1.16 |
1.38 |
$1.8M |
$62.1B |
Cumulative mileage of segments may not add up to the corresponding segment in the Nationally Significant Freight Highway Bottlenecks and Congested Corridors list.
Source: FHWA
Figure 98. Map. Top 40 Bottleneck Maps, Bottleneck 30, I-285 (Atlanta, GA).
31. I-495 (Washington, D.C.)
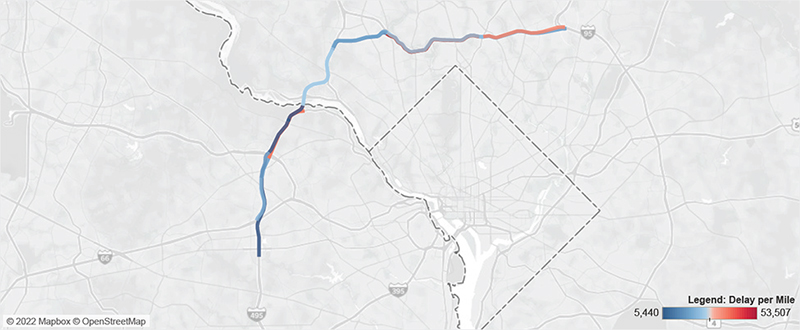
I-495 (Washington, DC)
| Road |
Segment ID |
Length
(Miles) |
AADT
(Trucks) |
Delay
(Hours) |
Delay/ Mile |
PTI
(95th %) |
BI |
TTI |
TRI |
Cong. Cost |
FAF Value |
| I-495 |
MDP0000602 |
5.2 |
9,544 |
278,191 |
53,507 |
3.81 |
141.3% |
1.55 |
1.78 |
$13.8M |
$29.0B |
| I-495 |
VAP0000940 |
3.6 |
4,259 |
145,999 |
40,516 |
6.76 |
219.1% |
2.13 |
1.91 |
$7.2M |
$16.6B |
| I-495 |
MDN0000280 |
4.1 |
6,010 |
148,833 |
36,304 |
4.86 |
197.1% |
1.63 |
2.37 |
$7.4M |
$20.5B |
| I-495 |
MDP0000609 |
3.5 |
6,955 |
95,747 |
27,322 |
3.11 |
129.3% |
1.36 |
2.24 |
$4.7M |
$28.2B |
| I-495 |
MDN0000284 |
3.6 |
6,954 |
97,459 |
26,903 |
2.98 |
107.9% |
1.42 |
1.49 |
$4.8M |
$28.1B |
| I-495 |
MDN0000282 |
5.4 |
9,479 |
136,307 |
25,239 |
2.11 |
58.4% |
1.30 |
1.32 |
$6.8M |
$28.9B |
| I-495 |
VAN0000254 |
2.2 |
4,200 |
48,764 |
22,222 |
4.13 |
178.2% |
1.47 |
2.94 |
$2.4M |
$16.1B |
| I-495 |
MDN0000283 |
3.0 |
5,180 |
60,454 |
20,209 |
3.41 |
129.9% |
1.43 |
1.99 |
$3.0M |
$21.8B |
| I-495 |
VAP0000936 |
1.0 |
3,783 |
19,488 |
18,823 |
3.43 |
124.2% |
1.46 |
2.55 |
$1.0M |
$14.5B |
| I-495 |
MDP0000603 |
4.4 |
6,044 |
81,072 |
18,594 |
2.76 |
104.0% |
1.35 |
1.70 |
$4.0M |
$20.6B |
| I-495 |
VAN0000248 |
1.4 |
3,721 |
22,710 |
16,675 |
2.54 |
89.9% |
1.30 |
2.03 |
$1.1M |
$14.2B |
| I-495 |
MDP0000610 |
3.0 |
5,069 |
42,616 |
14,179 |
2.71 |
87.4% |
1.32 |
1.90 |
$2.1M |
$21.1B |
| I-495 |
VAN0000247 |
1.9 |
4,075 |
11,392 |
5,940 |
1.80 |
52.7% |
1.18 |
1.44 |
$0.6M |
$15.7B |
| I-495 |
VAP0000929 |
3.9 |
4,049 |
21,818 |
5,548 |
1.51 |
29.6% |
1.16 |
1.29 |
$1.1M |
$15.5B |
| I-495 |
VAN0000237 |
1.1 |
4,849 |
5,987 |
5,440 |
1.81 |
49.6% |
1.21 |
1.34 |
$0.3M |
$18.6B |
Cumulative mileage of segments may not add up to the corresponding segment in the Nationally Significant Freight Highway Bottlenecks and Congested Corridors list.
Source: FHWA
Figure 99. Map. Top 40 Bottleneck Maps, Bottleneck 31, I-495 (Washington, D.C.).
32. I-70 (Denver, CO)
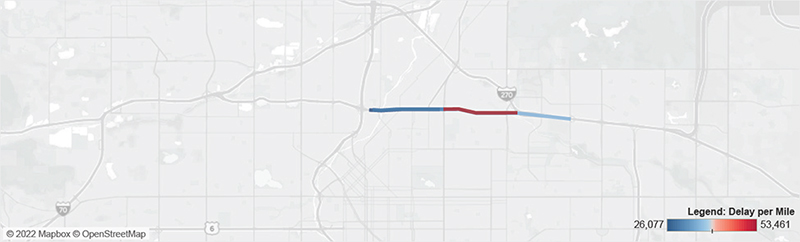
I-70 (Denver, CO)
| Road |
Segment ID |
Length
(Miles) |
AADT
(Trucks) |
Delay
(Hours) |
Delay/ Mile |
PTI
(95th %) |
BI |
TTI |
TRI |
Cong. Cost |
FAF Value |
| I-70 |
CON0000157 |
2.3 |
5,973 |
125,104 |
53,461 |
4.61 |
147.6% |
1.85 |
1.50 |
$6.2M |
$16.1B |
| I-70 |
COP0000506 |
4.2 |
6,788 |
149,304 |
35,957 |
3.53 |
122.3% |
1.58 |
1.65 |
$7.4M |
$18.5B |
| I-70 |
CON0000158 |
2.2 |
7,795 |
68,153 |
30,549 |
2.67 |
63.5% |
1.56 |
1.22 |
$3.4M |
$18.9B |
| I-70 |
COP0000504 |
2.2 |
7,863 |
57,844 |
26,077 |
2.93 |
97.8% |
1.46 |
1.51 |
$2.9M |
$19.0B |
Cumulative mileage of segments may not add up to the corresponding segment in the Nationally Significant Freight Highway Bottlenecks and Congested Corridors list.
Source: FHWA
Figure 100. Map. Top 40 Bottleneck Maps, Bottleneck 32, I-70 (Denver, CO).
33. I-30 (Little Rock, AR)

I-30 (Little Rock, AR)
| Road |
Segment ID |
Length
(Miles) |
AADT
(Trucks) |
Delay
(Hours) |
Delay/ Mile |
PTI
(95th %) |
BI |
TTI |
TRI |
Cong. Cost |
FAF Value |
| I-30 |
ARP0000518 |
1.9 |
19,820 |
97,397 |
51,924 |
2.32 |
84.2% |
1.24 |
1.86 |
$4.8M |
$69.7B |
| I-30 |
ARN0000203 |
2.8 |
17,059 |
57,742 |
20,660 |
1.39 |
24.3% |
1.12 |
1.21 |
$2.9M |
$63.2B |
Cumulative mileage of segments may not add up to the corresponding segment in the Nationally Significant Freight Highway Bottlenecks and Congested Corridors list.
Source: FHWA
Figure 101. Map. Top 40 Bottleneck Maps, Bottleneck 33, I-30 (Little Rock, AR).
34. I-80 (San Francisco, CA)
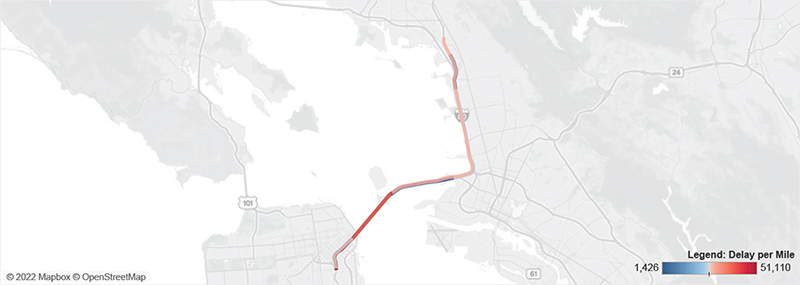
I-80 (San Francisco, CA)
| Road |
Segment ID |
Length
(Miles) |
AADT
(Trucks) |
Delay
(Hours) |
Delay/ Mile |
PTI
(95th %) |
BI |
TTI |
TRI |
Cong. Cost |
FAF Value |
| I-80 |
CAP00002096 |
1.8 |
2,737 |
90,562 |
51,110 |
9.15 |
198.6% |
2.97 |
1.37 |
$4.5M |
$9.6B |
| I-80 |
CAN0000723 |
2.7 |
6,060 |
112,239 |
41,665 |
3.33 |
127.0% |
1.46 |
1.62 |
$5.6M |
$39.1B |
| I-80 |
CAN0000722 |
9.9 |
4,615 |
277,595 |
28,095 |
5.22 |
148.9% |
1.95 |
1.59 |
$13.8M |
$29.0B |
| I-80 |
CAN0000724 |
1.7 |
2,701 |
44,076 |
25,774 |
4.34 |
132.6% |
1.85 |
1.35 |
$2.2M |
$9.4B |
| I-80 |
CAP00002100 |
4.7 |
5,184 |
111,804 |
24,007 |
4.05 |
149.0% |
1.56 |
1.74 |
$5.5M |
$27.8B |
| I-80 |
CAP00002097 |
2.6 |
6,216 |
38,739 |
14,999 |
1.83 |
51.1% |
1.21 |
1.38 |
$1.9M |
$39.4B |
| I-80 |
CAP00002104 |
1.6 |
2,252 |
6,696 |
4,177 |
2.08 |
68.8% |
1.21 |
1.61 |
$0.3M |
$9.4B |
| I-80 |
CAP00002098 |
2.9 |
9,508 |
4,185 |
1,426 |
1.37 |
21.0% |
1.13 |
1.10 |
$0.2M |
$48.3B |
Cumulative mileage of segments may not add up to the corresponding segment in the Nationally Significant Freight Highway Bottlenecks and Congested Corridors list.
Source: FHWA
Figure 102. Map. Top 40 Bottleneck Maps, Bottleneck 34, I-80 (San Francisco, CA).
35. I-10 (Houston, TX)
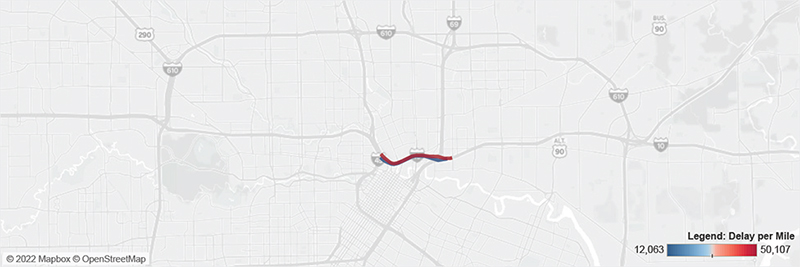
I-10 (Houston, TX)
| Road |
Segment ID |
Length
(Miles) |
AADT
(Trucks) |
Delay
(Hours) |
Delay/ Mile |
PTI
(95th %) |
BI |
TTI |
TRI |
Cong. Cost |
FAF Value |
| I-10 |
TXN0000312 |
1.9 |
9,085 |
94,429 |
50,107 |
4.92 |
188.9% |
1.67 |
2.00 |
$4.7M |
$38.2B |
| I-10 |
TXP00001770 |
1.8 |
8,968 |
21,083 |
12,063 |
1.66 |
40.5% |
1.17 |
1.32 |
$1.0M |
$37.5B |
Cumulative mileage of segments may not add up to the corresponding segment in the Nationally Significant Freight Highway Bottlenecks and Congested Corridors list.
Source: FHWA
Figure 103. Map. Top 40 Bottleneck Maps, Bottleneck 35, I-10 (Houston, TX).
36. I-270 (Denver, CO)
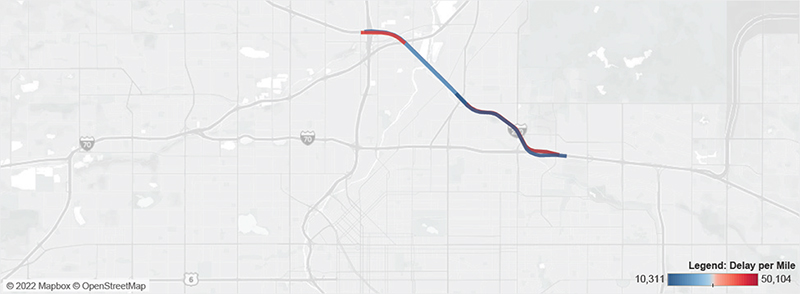
I-270 (Denver, CO)
| Road |
Segment ID |
Length
(Miles) |
AADT
(Trucks) |
Delay
(Hours) |
Delay/ Mile |
PTI
(95th %) |
BI |
TTI |
TRI |
Cong. Cost |
FAF Value |
| I-270 |
COP0000553 |
3.2 |
5,364 |
160,467 |
50,104 |
5.33 |
174.8% |
1.92 |
1.82 |
$7.9M |
$15.5B |
| I-270 |
CON0000211 |
1.3 |
4,602 |
59,411 |
44,453 |
6.36 |
207.3% |
2.00 |
2.03 |
$2.9M |
$13.2B |
| I-270 |
CON0000212 |
2.0 |
5,733 |
40,967 |
20,205 |
2.54 |
72.3% |
1.43 |
1.27 |
$2.0M |
$16.4B |
| I-270 |
COP0000554 |
3.7 |
5,242 |
50,346 |
13,614 |
1.86 |
35.9% |
1.31 |
1.18 |
$2.5M |
$15.2B |
| I-270 |
CON0000214 |
3.9 |
5,409 |
40,135 |
10,311 |
2.03 |
58.3% |
1.27 |
1.49 |
$2.0M |
$15.6B |
Cumulative mileage of segments may not add up to the corresponding segment in the Nationally Significant Freight Highway Bottlenecks and Congested Corridors list.
Source: FHWA
Figure 104. Map. Top 40 Bottleneck Maps, Bottleneck 36, I-270 (Denver, CO).
37. I-95 (Washington, D.C.)

I-95 (Washington, DC)
| Road |
Segment ID |
Length
(Miles) |
AADT
(Trucks) |
Delay
(Hours) |
Delay/ Mile |
PTI
(95th %) |
BI |
TTI |
TRI |
Cong. Cost |
FAF Value |
| I-95 |
VAN0000502 |
6.9 |
8,092 |
337,261 |
49,241 |
4.40 |
152.6% |
1.71 |
1.69 |
$16.7M |
$39.4B |
| I-95 |
VAP00001155 |
2.6 |
7,165 |
60,903 |
23,567 |
2.49 |
74.2% |
1.39 |
1.20 |
$3.0M |
$35.0B |
| I-95 |
VAP00001156 |
6.2 |
8,062 |
124,325 |
20,191 |
2.54 |
97.8% |
1.28 |
1.75 |
$6.2M |
$39.2B |
| I-95 |
VAN0000403 |
5.1 |
7,448 |
86,751 |
17,057 |
5.20 |
134.1% |
2.07 |
2.19 |
$4.3M |
$36.3B |
| I-95 |
VAP00001076 |
5.1 |
7,448 |
57,335 |
11,273 |
4.45 |
165.9% |
1.65 |
1.28 |
$2.8M |
$36.3B |
Cumulative mileage of segments may not add up to the corresponding segment in the Nationally Significant Freight Highway Bottlenecks and Congested Corridors list.
Source: FHWA
Figure 105. Map. Top 40 Bottleneck Maps, Bottleneck 37, I-95 (Washington, D.C.).
38. CA-110 and I-110 (Los Angeles, CA)

CA-110 & I-110 (Los Angeles, CA)
| Road |
Segment ID |
Length
(Miles) |
AADT
(Trucks) |
Delay
(Hours) |
Delay/ Mile |
PTI
(95th %) |
BI |
TTI |
TRI |
Cong. Cost |
FAF Value |
| CA-110 |
CAP00001730 |
2.0 |
3,890 |
98,619 |
48,762 |
7.65 |
173.2% |
2.77 |
1.96 |
$4.9M |
$11.9B |
| CA-110 |
CAN0000350 |
3.1 |
3,738 |
82,129 |
26,685 |
4.89 |
144.6% |
2.04 |
1.93 |
$4.1M |
$11.7B |
| I-110 |
CAP00002614 |
1.8 |
6,345 |
14,638 |
8,084 |
6.36 |
121.1% |
2.88 |
2.31 |
$0.7M |
$21.2B |
| I-110 |
CAN00001155 |
2.0 |
6,261 |
9,518 |
4,736 |
3.56 |
114.3% |
1.67 |
1.43 |
$0.5M |
$20.9B |
Cumulative mileage of segments may not add up to the corresponding segment in the Nationally Significant Freight Highway Bottlenecks and Congested Corridors list.
Source: FHWA
Figure 106. Map. Top 40 Bottleneck Maps, Bottleneck 38, CA-110 and I-110 (Los Angeles, CA).
39. I-10 (Phoenix, AZ)
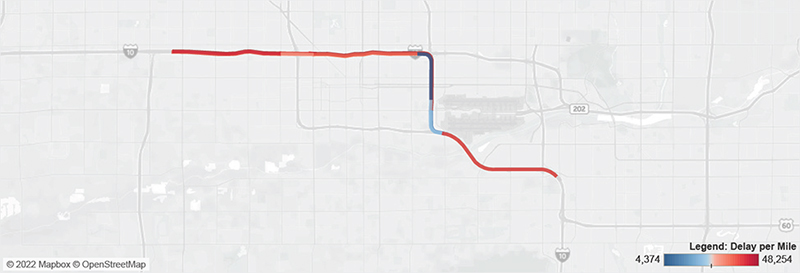
I-10 (Phoenix, AZ)
| Road |
Segment ID |
Length
(Miles) |
AADT
(Trucks) |
Delay
(Hours) |
Delay/ Mile |
PTI
(95th %) |
BI |
TTI |
TRI |
Cong. Cost |
FAF Value |
| I-10 |
AZP0000246 |
3.3 |
11,718 |
160,526 |
48,254 |
3.41 |
133.9% |
1.45 |
1.92 |
$7.9M |
$45.6B |
| I-10 |
AZP0000243 |
6.1 |
10,650 |
290,415 |
47,936 |
4.36 |
180.5% |
1.49 |
2.53 |
$14.4M |
$44.2B |
| I-10 |
AZP0000245 |
1.3 |
8,777 |
57,272 |
43,630 |
5.18 |
225.6% |
1.59 |
3.04 |
$2.8M |
$33.3B |
| I-10 |
AZN000032 |
4.0 |
11,286 |
171,914 |
42,909 |
3.67 |
170.3% |
1.35 |
3.08 |
$8.5M |
$45.2B |
| I-10 |
AZN000026 |
3.3 |
11,673 |
140,269 |
41,962 |
3.26 |
142.2% |
1.34 |
2.50 |
$6.9M |
$45.4B |
| I-10 |
AZN000029 |
3.2 |
11,339 |
116,398 |
36,289 |
2.41 |
83.6% |
1.29 |
1.43 |
$5.8M |
$47.2B |
| I-10 |
AZN000028 |
1.0 |
8,816 |
30,997 |
30,556 |
3.01 |
125.1% |
1.33 |
1.87 |
$1.5M |
$33.7B |
| I-10 |
AZP0000241 |
4.1 |
11,376 |
107,375 |
25,999 |
2.59 |
107.2% |
1.24 |
2.08 |
$5.3M |
$45.7B |
| I-10 |
AZN000031 |
1.3 |
8,840 |
28,325 |
22,421 |
2.29 |
78.9% |
1.25 |
1.97 |
$1.4M |
$34.5B |
| I-10 |
AZP0000242 |
1.1 |
8,998 |
14,994 |
13,715 |
1.69 |
42.9% |
1.16 |
1.42 |
$0.7M |
$35.4B |
| I-10 |
AZN000030 |
1.7 |
8,478 |
7,565 |
4,374 |
1.25 |
14.1% |
1.10 |
1.11 |
$0.4M |
$33.8B |
Cumulative mileage of segments may not add up to the corresponding segment in the Nationally Significant Freight Highway Bottlenecks and Congested Corridors list.
Source: FHWA
Figure 107. Map. Top 40 Bottleneck Maps, Bottleneck 39, I-10 (Phoenix, AZ).
40. I-15 (Riverside, CA)
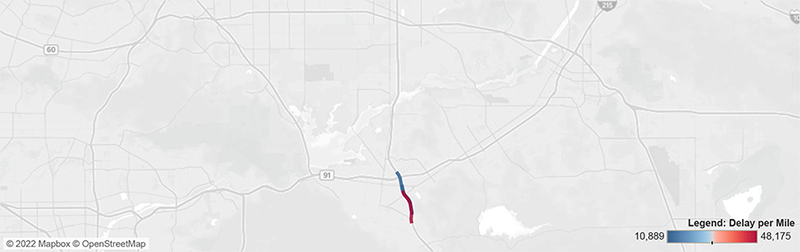
I-15 (Riverside, CA)
| Road |
Segment ID |
Length
(Miles) |
AADT
(Trucks) |
Delay
(Hours) |
Delay/ Mile |
PTI
(95th %) |
BI |
TTI |
TRI |
Cong. Cost |
FAF Value |
| I-15 |
CAN0000891 |
2.2 |
5,267 |
105,431 |
48,175 |
6.08 |
228.0% |
1.86 |
2.17 |
$5.2M |
$21.5B |
| I-15 |
CAN0000890 |
1.2 |
5,203 |
15,471 |
12,457 |
2.20 |
70.1% |
1.28 |
1.71 |
$0.8M |
$22.9B |
| I-15 |
CAP00002362 |
2.0 |
5,263 |
21,771 |
10,889 |
2.21 |
71.3% |
1.28 |
1.45 |
$1.1M |
$21.8B |
Cumulative mileage of segments may not add up to the corresponding segment in the Nationally Significant Freight Highway Bottlenecks and Congested Corridors list.
Source: FHWA
Figure 108. Map. Top 40 Bottleneck Maps, Bottleneck 40, I-15 (Riverside, CA).
|