Third Senior Executive Transportation and Public Safety Summit: Final Report6. Using Data to Improve Traffic Incident ManagementFederal Highway Administration (FHWA) Office of Operations Traffic Incident Management (TIM) Program Manager Paul Jodoin moderated this session, highlighted the importance of collecting, analyzing, and using performance measures to communicate the importance of TIM programs. Jodoin also asserted that focused TIM strategies—such as the unmanned aerial system (UAS) for accident reconstruction, safety service patrol, Move Over law enforcement, and incentivized towing—can enhance TIM programs. Mr. Jodoin suggested that "what gets measured…gets managed, funded, improved, and completed." He called for each responder community to engage in using data to understand where they are and where they need to improve. He cited as an example a Houston case where the region suffered over $2 million in estimated delay cost associated with lane closures spanning across a morning and evening peak period to recover cargo worth only $150,000.2 Mr. Jodoin shared the state of TIM through four FHWA efforts—the Annual TIM Capability Maturity Self-Assessment, the Every Day Counts Round Four (EDC-4) "Using Data to Improve TIM" innovation, the National TIM Performance Measurement database, and the Computer-Aided Dispatch and Advanced Traffic Management System (CAD-ATMS) Integration Guidance. He concluded by noting that new technologies (unmanned aerial systems, crowdsourced data, and Internet of things devices); evolving traffic environments (automated vehicles, mobility on demand, drop-in auto ownership); and new data-supported practices (cloud computing, Big Data, machine learning) are changing the practice of TIM. Collecting and applying consistent and correct data will help each responder agency evolve, remain efficient, and reap the benefits from innovation. 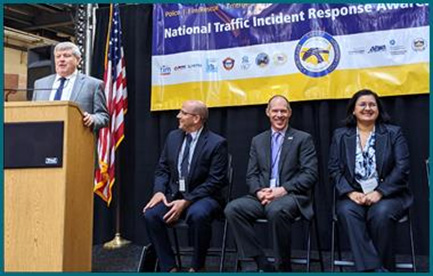 Figure 16. Photo. "Using Data to Improve TIM" panel. (left to right: Paul Jodoin, Captain John Paul Cartier, Galen McGill, and Vaishali Shah). Source: Federal Highway Administration Arizona Department of Public Safety (AZDPS) Metro West District Commander Captain John Paul Cartier shared Arizona's success in reducing roadway clearance time and traffic delay through co-location with the Arizona Department of Transportation and by implementing TIM concepts. His agency focuses on collecting the right data consistently and accurately and making reporting simple and easy among their officers through Traffic and Criminal Software (TraCS). Figure 17 illustrates the AZDPS Crash Report elements that are then used to estimate TIM performance measures. 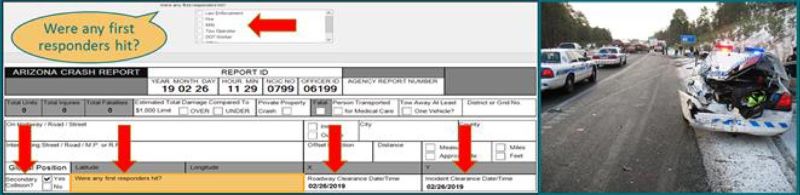 Figure 17. Screenshot and Photo. The Arizona Department of Public Safety crash form asks, "Were any first responders hit?" adjacent to Arizona Department of Public Safety crash involving responders. Source: AZDPS Summit Presentation) Oregon Department of Transportation (DOT) Systems Operations and Intelligent Transportation Systems (ITS) Manager Galen McGill discussed their TIM Performance Measurement plan, which currently collects data to measure roadway clearance, roadway closure, and incident clearance duration, along with the number of TIM-trained responders. They will soon begin collecting data on roadside exposure time for emergency responders, and whether the incident is a secondary crash. AZDPS reports performance measures, such as secondary collision, responder struck by, and incident clearance time. They use this data to demonstrate the TIM business case. AZDPS quantified $112 million in delay-related savings in the year 2015, but had not included other benefits, such as secondary crash reduction savings in their analysis.3 Captain Cartier also highlighted that their performance measures help the agency evaluate TIM policies, procedures, resource deployment, training, and other TIM response elements. Captain Cartier also spoke of their State's collaborative approach to focus on developing the four "Es"—engineering, education, enforcement, and emergency medical service (EMS). He spoke about institutionalizing TIM strategies, training, and practices to reduce the number of responders injured and killed on Arizona roads. Mr. McGill shared data on the growing use of the "push, pull, drag" (PPD) strategy after responder training. These and other data collected through crowdsourcing, CAD, service patrol apps, crash reporting, and Traffic Management Center (TMC) software help measure TIM program effectiveness, measure specific strategy effectiveness, and optimize resources. Oregon DOT also makes their incident, ITS, road weather, and other data available for download for use by researchers and others that may wish to use the available data. Oregon DOT makes available processed information through visually impactful content and performance dashboards. Oregon DOT purposefully communicates information through visually impactful infographics that are then shared across TIM teams in the State, through the State's annual TIM conference, and through social media. 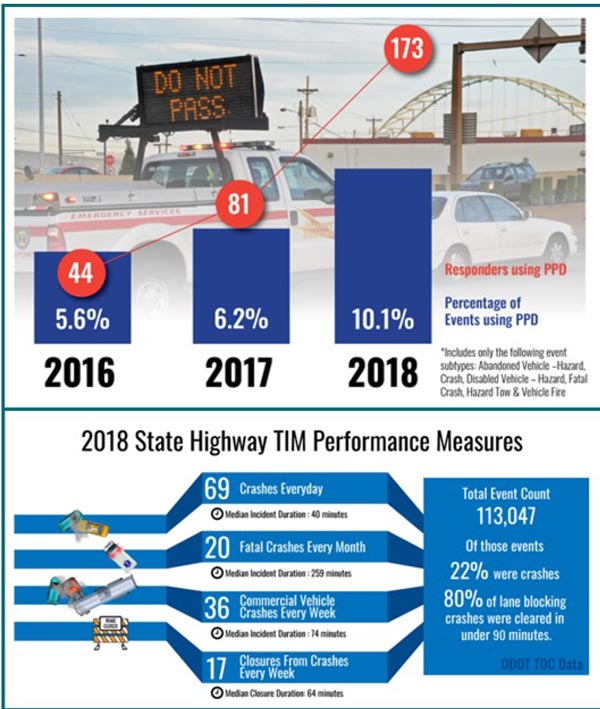 Figure 18. Infographic. Oregon Department of Transportation "push, pull, drag" usage and traffic incident management performance. Source: Oregon DOT Summit Presentation Senior Program Director at AEM Corporation Vaishali Shah highlighted the many mechanisms by which TIM Data is collected among the varied responder communities and how each source offers greater visibility into an agency's successes and opportunities. Some of the more common data collection mechanisms include the State crash report, TMC software, safety service patrol, and crowdsourced data from public agency mobile applications or private sector navigation applications. She noted that over 70 percent and 40 percent of recorded incidents are attributed to the State Police CAD systems in Minnesota and Florida, respectively.4,5 Mrs. Shah highlighted that the Houston Fire Department experienced a 40-percent reduction in motor vehicle incidents on-scene time after TIM training for all of their personnel; and that the Maryland DOT is developing a tool that predicts an incident duration, based on location, incident type, time of day, and other factors.6 This tool will help operators better plan the traveler information delivery and other demand management strategies. Mrs. Shah presented the web-accessible TIM data and analytics platform developed through EDC-4 innovation, Using Data to Improve TIM. She offered examples of how the tool can help agencies easily dig deep to understand the nature of the data being collected; to identify data collection shortcomings; and to analyze data that can inform decisionmaking, such as where TIM training may be warranted. She illustrated that the tool could identify anomalies in reporting or trends in reporting fidelity. For example, while the percent of incidents for which data are recorded to measure roadway and incident clearance time (RCT/ICT) increased among Tennessee Highway Patrol (THP) from years 2015 to 2018. The frequency with which Non-THP entities record incidents with data to measure RCT/ICT over this same period is declining, as illustrated in Figure 19. 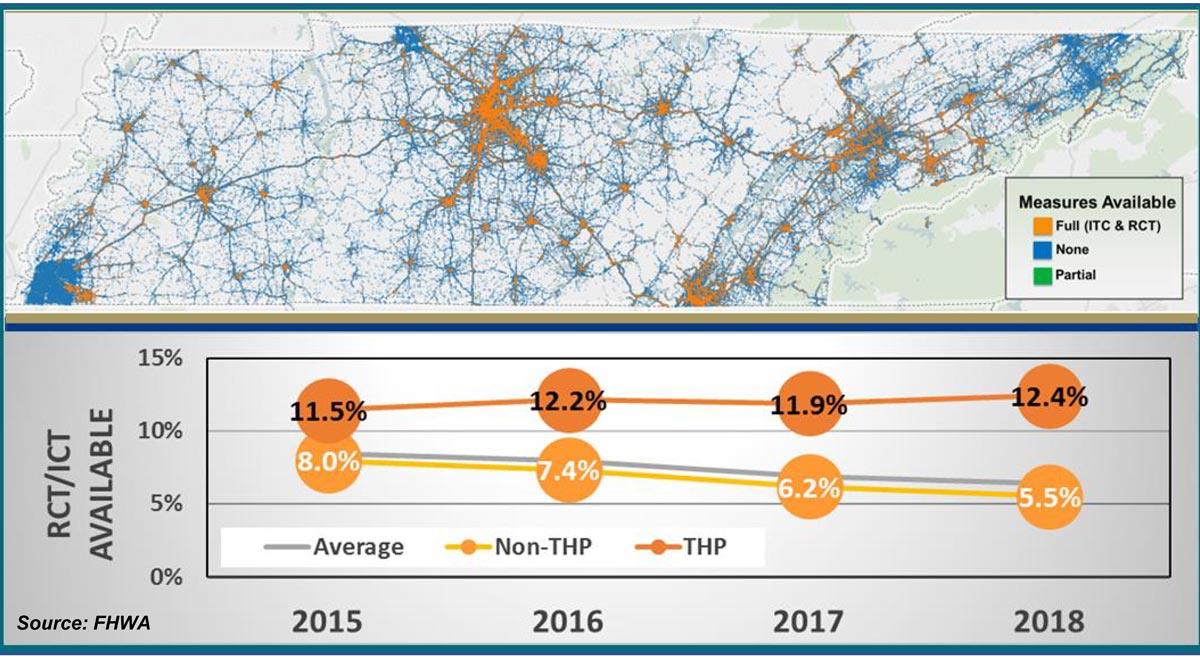 Figure 19. Graphic. Web-accessible traffic incident management data and analytics platform (Tennessee example shows decline in traffic incident management data from non-Tennessee highway patrol sources). Source: Federal Highway Administration 2 Wilson, J. (2018, July 28). TIM: From School House to Institutionalization. Presentation at the 2018 TIM Symposium. Emmitsburg, MD: Houston Fire Department. [Return to note 2] 3 Maricopa Association of Governments. "Evaluation of DPS Co-location at the ADOT Traffic Operations Center." June 2018. [Return to note 3] 4 McClellan, J. (2017, October 12). Computer Aided Dispatch: Ways to Integrate into TMC Systems Webinar. Retrieved March 12, 2019, from I-95 Corridor Coalition. [Return to note 4] 5 Vollmer, D. (2018, July). Presentation at the EDC-4 TIM Data Peer Exchange. Lexington, KY: Florida Department of Transportation. [Return to note 5] 6 Wilson, J. (2018, July 28). TIM: From School House to Institutionalization. Presentation at the 2018 TIM Symposium. Emmitsburg, MD: Houston Fire Department. [Return to note 6] |
|
United States Department of Transportation - Federal Highway Administration |
||