2019 Urban Congestion Trends
Leveraging Data to Improve Operations Performance
Printable version [PDF 6.6 MB]
You may need the Adobe® Reader® to view the PDFs on this page.
Contact Information: Operations Feedback at OperationsFeedback@dot.gov

U.S. Department of Transportation
Federal Highway Administration
Office of Operations
1200 New Jersey Avenue, SE
Washington, DC 20590
www.ops.fhwa.dot.gov
FHWA-HOP-20-012
(left to right: Photo by Texas A&M Transportation Institute Communications; Photo by Texas A&M Transportation Institute Communications; Photos by Texas Department of Transportation [top] and Texas A&M Transportation Institute Communications [bottom])
The Federal Highway Administration 2019 Urban Congestion Report details trends and the current state of congestion and reliability on the National Highway System (NHS) in 52 of the largest metropolitan areas in the United States. This report also includes examples of agencies using the National Performance Management Research Data Set (NPMRDS) for performance reporting, as well as a few operational strategies and performance management approaches implemented by State and local transportation agencies in recent years. The report concludes with a brief discussion to familiarize readers with a tool developed through an American Association of State Highway and Transportation Officials (AASHTO)–led pooled-fund study to assist agencies with submitting and utilizing performance measures.
The NPMRDS includes actual, observed travel times on the NHS for freight and passenger vehicles, and is freely available for use by State departments of transportation (DOTs) and metropolitan planning organizations (MPOs) for their performance management activities. The travel time data have been used to calculate congestion and reliability metrics for the FHWA Urban Congestion Report (UCR) for six years.
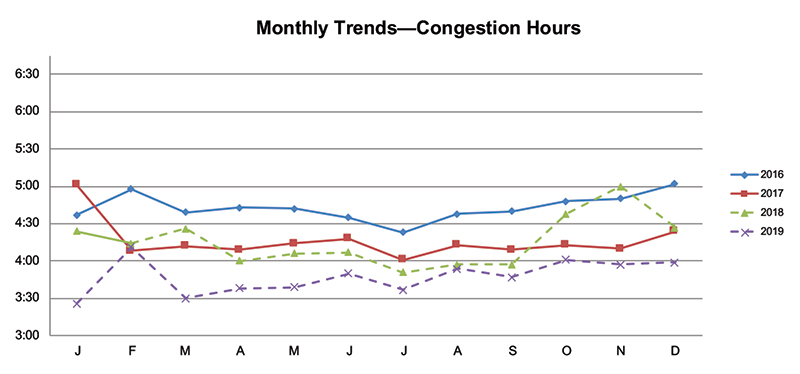
The Urban Congestion Trends graphic below provides 2018 to 2019 congestion trends using the same measures as those found in the quarterly reports from the UCR. Overall, congestion metrics have improved from 2018 to 2019. The national congestion measures across all 52 MSAs included in the UCR are generally down from 2018 to 2019.
Urban Congestion Trends
Year-to-Year Congestion Trends in the United States (2018 to 2019)

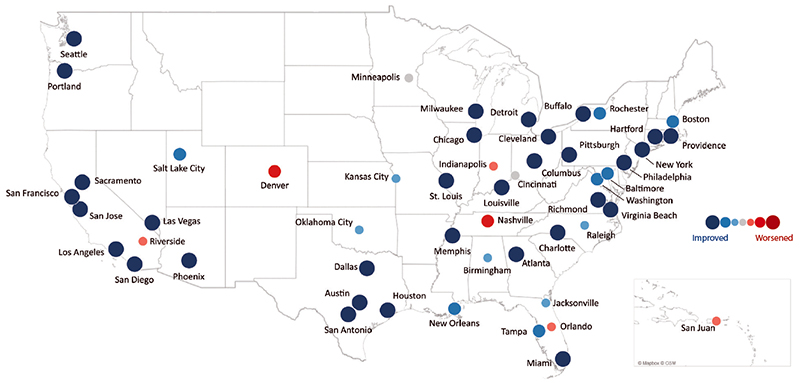
The graphic shows a map of the U.S. with representatively colored/sized dots on each of the 52 Metropolitan Statistical Areas (MSAs) indicating changes in the year-to-year congestion measures from 2018 to 2019.
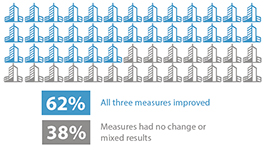
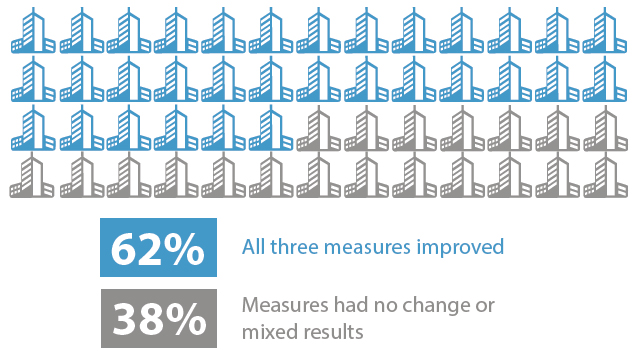
Urban Congestion Trends/Year-to-Year Congestion Trends in the United States (2018 to 2019). The graphic indicates that in 62 percent of the MSAs, all three measures (congested hours, Travel Time Index, Planning Time Index) improved and in 38 percent of the MSAs the measures had no change or mixed results.
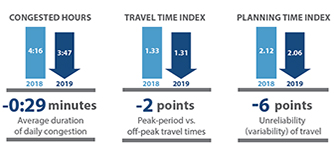
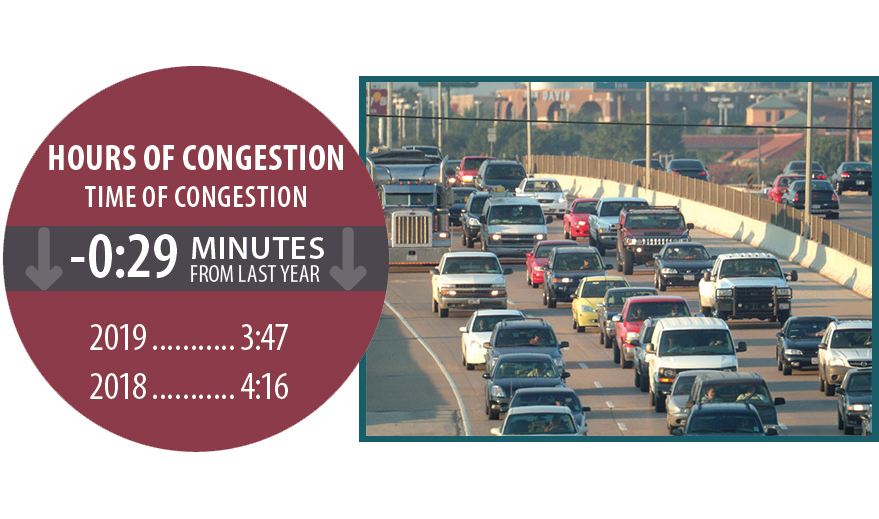
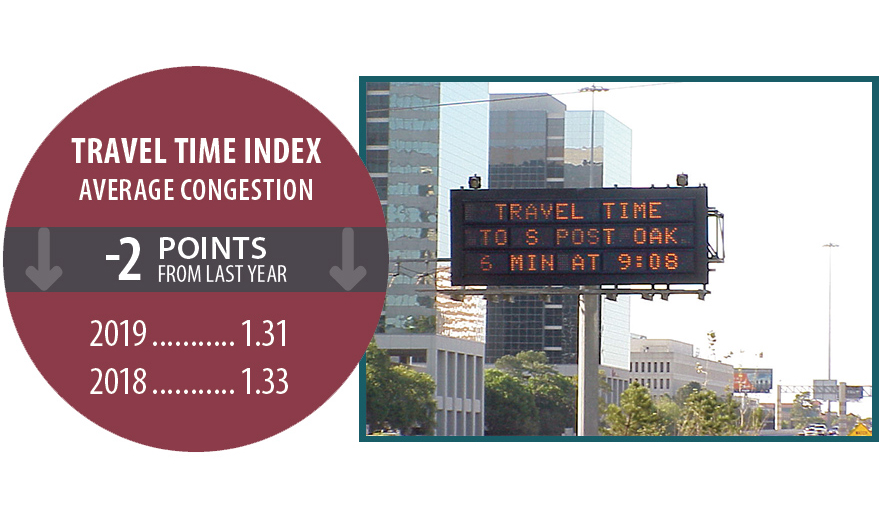
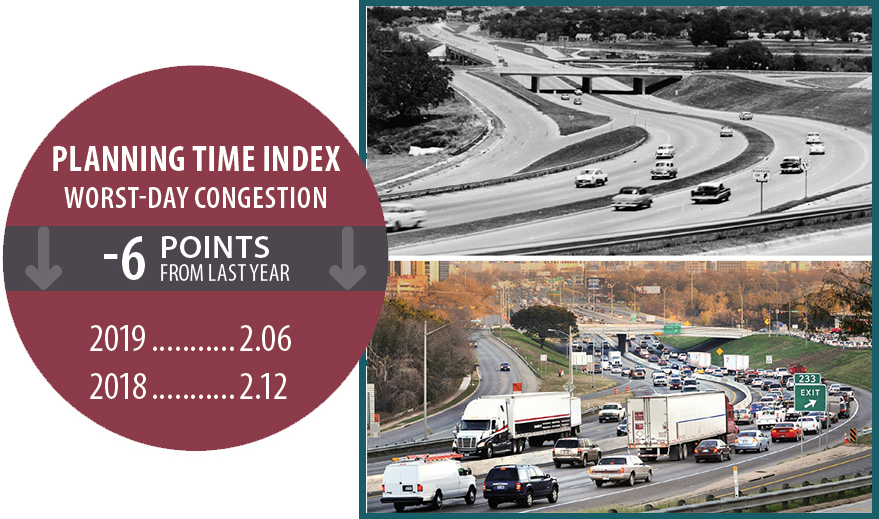
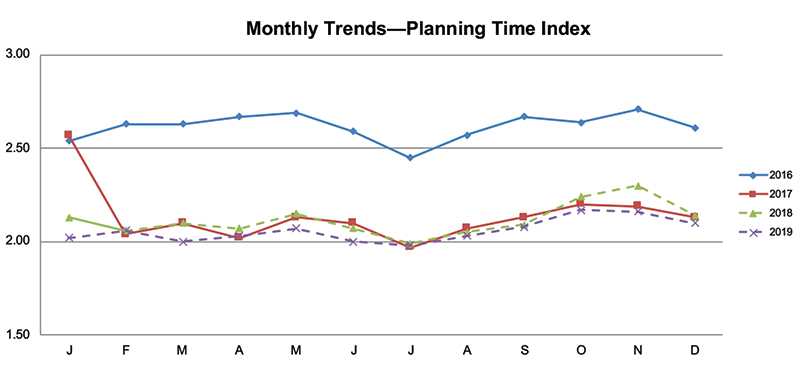
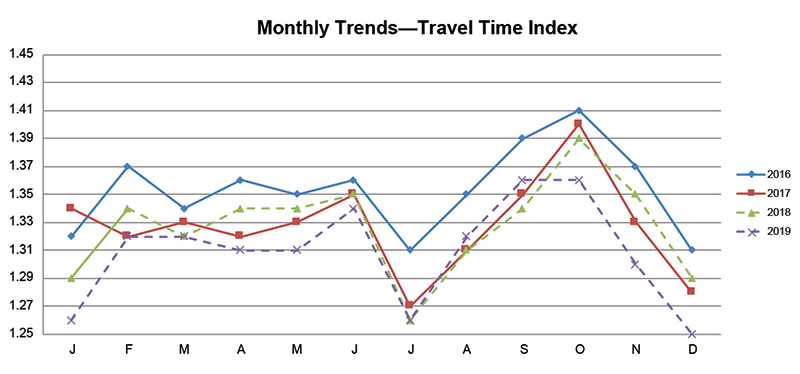
Urban Congestion Trends/Year-to-Year Congestion Trends in the United States (2018 to 2019). The graphic indicates that congested hours decreased 29 minutes from 4 hours and 16 minutes in 2018 to 3 hours and 47 minutes in 2019; the Travel Time Index decreased 2 points from 1.33 in 2018 to 1.31 in 2019; and the Planning Time Index decreased 6 points from 2.12 in 2018 to 2.06 in 2019.
NOTES
The results in this map are annual congestion trends. Quarterly UCR data are available at http://www.ops.fhwa.dot.gov/perf_measurement/ucr/.
Each symbol ( ) represents 1 MSA.
Congestion Facts
- From 2018 to 2019, the congestion measures at the national level improved.
- Across the country, 62 percent (32) of the 52 reported-on metropolitan statistical areas (MSAs) improved in all three of the measures.
- None of the MSAs deteriorated in all three of the congestion measures compared to the 2018 values.
- The time penalty for a trip in an average day, measured with the travel time index, decreased in 87 percent (45) of the MSAs.
- Travel time on the worst day of a month increased (got worse) in 13 percent (7) of the MSAs.
Congestion Measure Definitions
- Hours of congestion—amount of time when freeways operate at less than 90 percent of free-flow freeway speeds.
- Travel Time Index (TTI)—time penalty for a trip on an average day. A TTI of 1.30 indicates a 20-minute free-flow trip takes 26 minutes (20 × 1.30) in the rush hours.
- Planning Time Index (PTI)—time penalty for a trip to be on time for 95 percent of trips (e.g., late for work on one day per month). A PTI of 1.60 indicates a 20-minute free-flow trip takes more than 32 minutes (20 × 1.60) one day per month.
Practical Applications of the NPMRDS
What Is New with the NPMRDS?
The NPMRDS is an archived speed and travel time data set (including associated location referencing geographic information system [GIS] data) that covers the NHS and additional roadways near 26 key border crossings with Canada (20 crossings) and Mexico (6 crossings). New for 2019 is an expanded road network from a new map provider with more coverage of the NHS. The NPMRDS also provides select Highway Performance Monitoring System (HPMS) attributes associated with the road network in both GIS and a database format. FHWA has made the data set available to State DOTs and MPOs to facilitate the application and use of performance measures. There is no charge to access the data, and they have been archived since 2013. The travel time portion of the NPMRDS is updated each month, and the road network is updated each year. Three travel time data sets are available that include speeds (observed, reference, and historical average) and travel times at 5 minute intervals on nearly 400,000 road segments for passenger vehicles, trucks, and trucks and passenger vehicles combined.
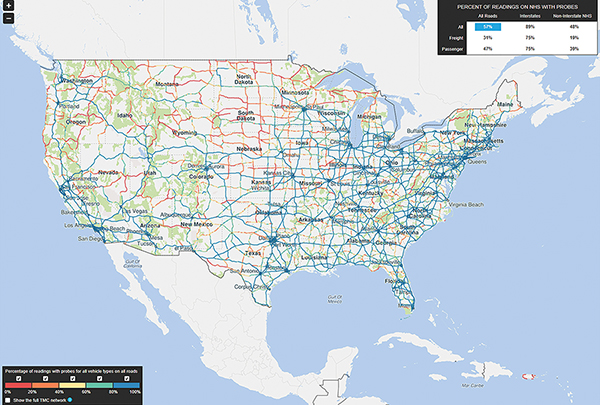
NPMRDS coverage map.
For More Information:
https://npmrds.ritis.org/analytics/
Who Is Using NPMRDS Data?
The examples that follow highlight innovative ways that agencies throughout the United States are using NPMRDS and other probe data.
Using Travel Time Data for Project Selection, North Central Texas Council of Governments (NCTCOG)
Speed data are used to create heat maps on portions of roads being considered for projects.
Texas House Bill 20 mandates that MPO develop 10-Year Plans using performance-based planning and project selection methods. While plans of this nature only recently became legislatively mandated, NCTCOG has been conducting this type of planning for many years. Speed data are one part of the criteria used in the planning process. NCTCOG staff utilize heat charts based on these data as a visual representation of congestion. While the speed data are part of the required process, they also have benefits with a broader audience:
- Congestion heat charts are intuitive (i.e., can be shown to elected officials and the public).
- The charts allow staff to identify issues with both recurring and non-recurring congestion along a corridor.
- While only one of many selection criteria, a heat chart can be a high-level screen (i.e., can filter out corridors that do not have a significant congestion issue).
- Data can be used to assist regional partners.
For More Information:
Brian Dell, Senior Transportation Planner, NCTCOG
bdell@nctcog.org
Prioritizing Project Selections for Operations, Michigan Department of Transportation (MDOT)
A process and methodology that uses NPMRDS to prioritize projects.
MDOT recently created or revised templates under Transportation Systems Management and Operation (TSMO). Two of these templates include programs with an annual allotted dollar amount of to use on Freeway operations (interstate and non-interstate freeways), and non-freeway reliability and operations that focus on improving travel reliability and a safe flow of traffic along these corridors. As a part of the selection process, MDOT is using travel-time-related measures such as TTI, Level of Travel Time Reliability (LOTTR), and PTI along with other measures like safety and benefit/cost ratio to screen and process submittals.
Examples of Eligible Work Types
| Freeway |
Non-freeway |
| Ramp improvements |
Center left-turn lanes |
| Ramp metering |
Indirect left-turns or J-turns |
| Reversible lanes |
Roundabouts |
| Hard shoulder running |
Lane extensions |
| Interchange improvements |
Left- or right-turn lanes |
| Adding auxiliary/weave/merge lanes |
Signal improvements (that add an operational element) |
For More Information:
Jason Firman, firmanj@Michigan.gov
https://www.michigan.gov/documents/mdot/MDOT_TSMO_Imp_Strat_Plan_Version1_2-2-18_612971_7.pdf
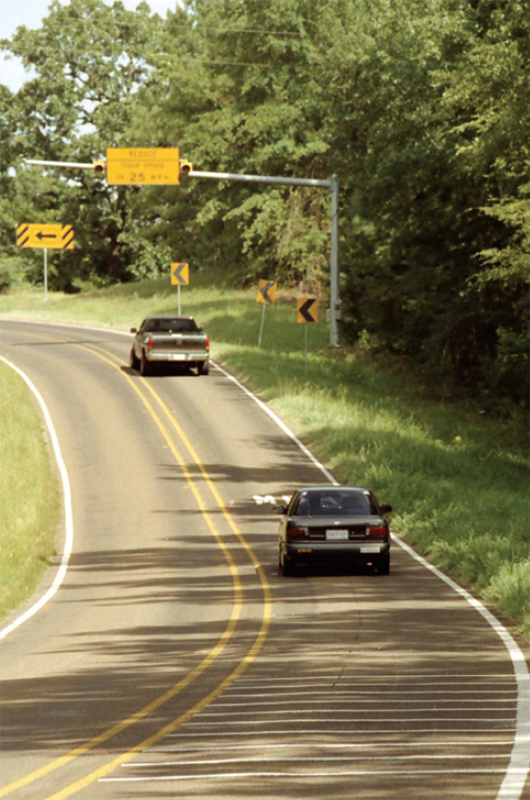
Rural Speed Pilot Program, U.S. Department of Transportation (USDOT)
Identifying heightened risks in traffic speed patterns to inform decision makers.
This project integrates established data on known crashes and highway design with anonymous data from global positioning system-enabled devices, which provide prevailing speeds at five-minute intervals across the entire NHS, from the NPMRDS. For the first time, USDOT will be able to look directly at prevailing operating speeds on a large scale to see how speed and speed differentials interact with roadway characteristics to influence the likelihood of crashes. Every year, speeding is a contributing factor in traffic fatalities, with more than 10,000 roadway deaths involving speed. The project includes the following objectives and some of the desired outcomes:

Source: Texas A&M Transportation Institute Communications
- Integrate crash data, roadway attributes, traffic volumes, and speed information.
- Connect crashes to the traffic speeds on the roadway using time, and determine crash rates at the segment level.
- Quantify the effects the speed differential (travel speed versus posted speed limit) and speed variation over time have on crashes.
- Find heightened risk in traffic speed patterns to inform policy and decision making.
- Potentially provide a tool to identify speed risk at the roadway segment level for State and local governments to use.
- Identify where to invest in engineering, education, and/or enforcement to reduce speeding.
For More Information:
Paul Teicher, Office of the Secretary of Transportation, USDOT
https://www.transportation.gov/briefing-room/dot0318
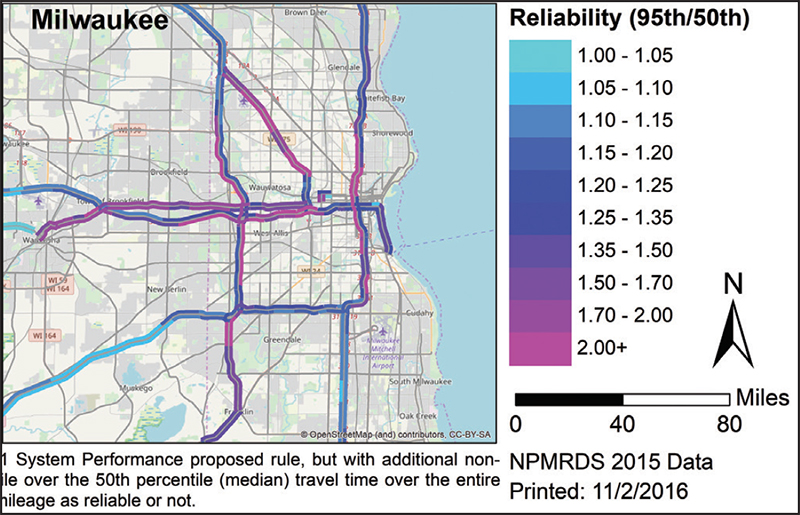
Wisconsin State Freight Plan, Wisconsin Department of Transportation (WisDOT)
Informed freight performance measures integrated with stakeholder, institution, and public inputs to guide the plan development.
WisDOT developed its first State Freight Plan (SFP) in order to guide the policy direction and inform future investment toward a robust multimodal freight transportation system. One of the foundational goals identified in the SFP is to enhance system mobility, operations, reliability, efficiency, and connectivity. WisDOT integrated NPMRDS freight data, along with the stakeholder, institution, and public inputs to guide the plan development. Through the federally available NPMRDS data set, WisDOT was able to calculate the freight performance measures related to travel time reliability, average speed, bottleneck duration, and bottleneck frequency. WisDOT also calculated an Aggregate Z-Score that normalized measures using a mathematical calculation and allowed for a comparison and ranking of the freight bottleneck segment performance.

The Moving Ahead for Progress in the 21st Century Act (MAP-21) identified “Freight movement on the Interstate System” as one of the federally required performance measures. States were required to monitor and report the metrics for the Truck Travel Time Reliability, a ratio of the 95th percentile travel time to the 50th percentile travel time on the Interstate system. WisDOT implemented this freight performance measure beginning January 1, 2018. WisDOT also leveraged NPMRDS data to monitor non-Interstate reliability performance that can help inform the allocation of funding sources based on comprehensive data analysis.
For More Information:
Dan Thyes, Freight Data Analyst, dan.thyes@dot.wi.gov
https://wisconsindot.gov/Documents/projects/sfp/plan.pdf
Operational Improvement Evaluations
The evaluations that follow highlight innovative ways that agencies throughout the United States have improved traffic through effective operations or innovation.
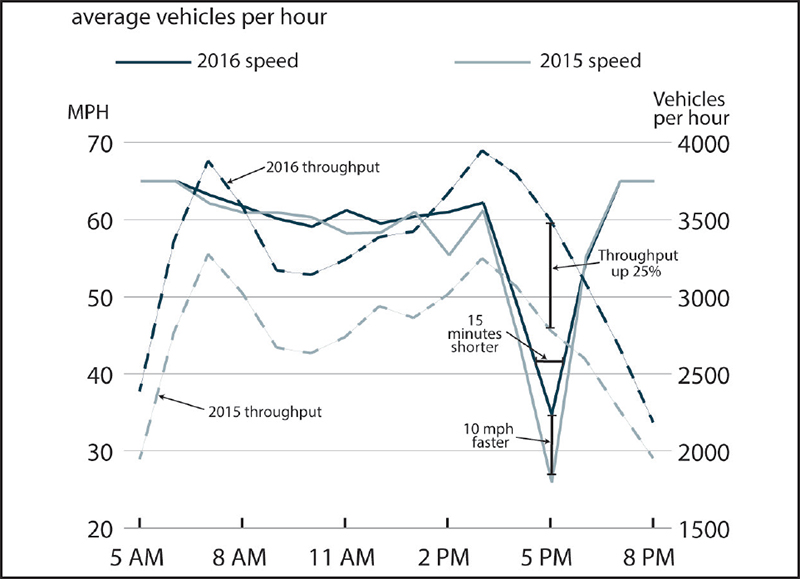
Ramp Metering, Washington State Department of Transportation (WSDOT)
Ramp metering helps with congestion levels and increases throughput during peak times.
(Benefits: reduced congestion, higher throughput.)
The Investment
The WSDOT activated ramp meters in both directions of Interstate 5 (I-5) between Lacey (SR 510) and Lakewood (SR 512) on May 18, 2015. This section of I-5 is known locally as the Joint Base Lewis-McChord (JBLM) corridor. Between 2015 and 2016, the population in Pierce County increased from 842,767 to 861,312 and in Thurston County from 269,183 to 275,222, for a total increase of 24,584 (source: U.S. Census Bureau). While this growth continues to strain the limited capacity of the JBLM corridor, this before and after study shows that ramp meters have helped improve throughput and reduced travel times for many drivers.
The Return
Ramp meters reduce congestion caused by busy on-ramps by creating timed gaps between vehicles entering the freeway, allowing for safer and more efficient merging. Better merging conditions at each ramp ultimately improve the traffic flow for the entire corridor, because the automatic metering process helps balance the demands of vehicles entering the freeway with those already on it. The average travel speed on I-5 at Berkeley Avenue increased by up to 10 mph at 5 p.m. In other locations along the corridor, peak-hour speeds increased between 5 and 20 mph. Peak-hour congestion on Berkely Avenue during evening hours shortened by 15 minutes. Congestion duration at other locations along the JBLM corridor was also shortened by up to 60 minutes. In addition, traffic volumes increased during all hours of the day without negatively affecting the travel speeds. On I-5 at Berkeley Avenue, traffic volumes increased up to 25 percent at 5 p.m.
For More Information:
Sreenath Gangula, Assistant Director, Performance Management, WSDOT, GangulS@wsdot.wa.gov
https://wsdot.wa.gov/publications/fulltext/graynotebook/corridor-capacity-report-17.pdf
Source: Arizona DOT
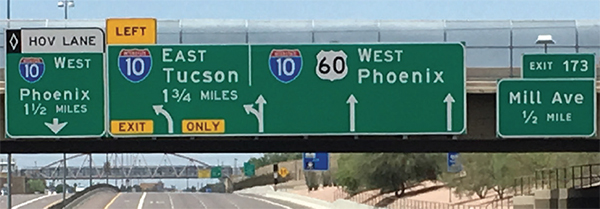
US 60 Sign and Striping Project, Arizona Department of Transportation (ADOT)
Low-cost and high impact improvements made using signs and paint.
(Benefits: reduced congestion, higher throughput, fewer accidents).
The Investment
A 2-mile segment of westbound US 60 just prior to the I-10 interchange in the Phoenix/Tempe area consistently had one of the highest number of overall crashes, and, in 2018, was identified as having the highest number of serious and fatal crashes in the ADOT system. This also had a significant negative impact on congestion and reliability in this corridor.
After thorough review, observation, and analysis by the ADOT TSMO Division, countermeasures for lane adjustments and new signs were implemented in July 2018. Overnight, this $240,000 project improved traffic conditions and dramatically reduced minor, rear-end crashes on the segment of freeway.
The Return
Compared to the 5 years before this improvement, crashes in those lanes have declined by 90 percent during afternoon peak hours. The installation of the westbound US 60 redesign is producing a benefit/cost analysis of over 620 to 1, based on crash data, which does not include first responder or Department of Public Safety resource costs. With all the work done in-house, the project saved the agency money—all while helping motorists get where they need to go safer and more reliably.
For More Information:
Brent Cain, Division Director, ADOT, bcain@azdot.gov
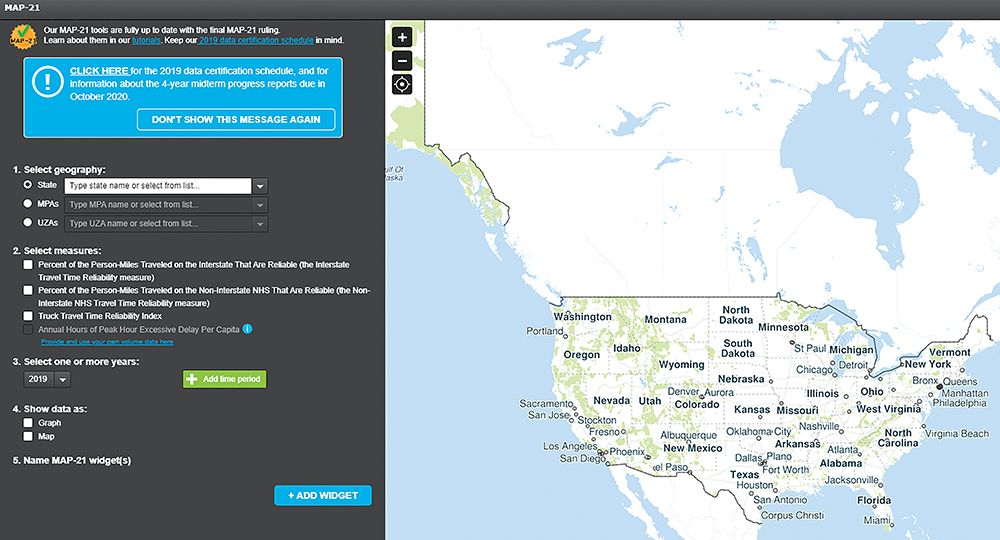
Pooled-Fund Study for PM3 Measures

Screenshot NPMRDS MAP-21 Tool
FHWA published the third performance measures (PM3) final rule back in January 2017. For those agencies that may be looking for more ways to use the NPMRDS data, the Transportation Performance Management Capacity Building Pooled-Fund Study, administered by AASHTO, procured a PM3 analysis tool. The PM3 tool set includes capabilities to compute, visualize, and download all of the PM3 metric and sub-metric data, as required to be reported to FHWA. Agency speed-limit data can be integrated, and trend-line capabilities are helping agencies more easily address target-setting requirements. An “easy button” allows agencies to immediately create all of the necessary files and deliverables required for submission to the HPMS in the PM3 portion of the MAP-21 and the Fixing America’s Surface Transportation Act.
View the Transportation Pooled-Fund Program website at https://www.pooledfund.org/Details/Study/575.
For More Information:
npmrds@ritis.org
https://npmrds.ritis.org/analytics/
Contact Information
Visit the Operations Performance Measurement Program Urban Congestion Reports web page for quarterly congestion trend updates: ops.fhwa.dot.gov/perf_measurement/ucr/index.htm.