Office of Operations
21st Century Operations Using 21st Century Technologies

Research, Development, and Application of Methods to Update Freight Analysis Framework Out-of-Scope Commodity Flow Data and Truck Payload Factors

Chapter 12. Proposed Methodology to Revise Payload Factors

This section proposes a new methodology to revise the estimation of payload factors in light of the shortcomings of the existing methods highlighted in chapter 11. The method relies on the 2002 Vehicle Inventory and Use Survey (VIUS) data along with weigh-in-motion (WIM) and Highway statistics data from 2012 and 2017. The proposed methodology is a three-step process and is detailed below.

Step 1: Revisit 2002 Vehicle Inventory and Use Survey

As a first step, the 2002 VIUS was revisited. The micro data for 2002 VIUS was obtained and examined. The responses to questions in the VIUS allow for the calculation of ton miles and miles by commodity and for error ranges, e.g., standard errors, to be compared for the calculations.

While this new analysis uses the weighting of tons according to the sampling plan, and the weighting of miles also from the sampling plan, the existing method merely presents the percentages of truck size, distance range and truck body type by commodity, but it does not state whether those percentages were derived from the weighted or unweighted survey responses.

The weighed annual trucks for each record was reported as:

TAB_TRUCKS = Expansion (Weighting) Factor for Trucks. Expansion factor used to weight each estimate for calculating trucks.

The weighted annual miles driven were reported for each survey record as:

TAB_MILES = Weighted Annual Miles Driven During 2002. Expansion factor used to weight each estimate for calculating truck miles traveled.

The load carried for each record was computed to be the average weight while loaded,

WEIGHTAVG = Average Weight of Vehicle or Vehicle/Trailer Combination. Question: What was the average weight (vehicle weight plus cargo weight) of this vehicle or vehicle/trailer combination as it was most often operated when carrying a typical payload during 2002?65

Minus the empty weight of the vehicle as reported for each VIUS response.

WEIGHTEMPTY = Empty Weight of Vehicle or Vehicle/Trailer Combination. Question: What was the empty weight of this vehicle or vehicle/trailer combination?

The Principal Product Carried was used in previous analysis to define the commodity carried. While the VIUS commodity codes can be cross walked to the Standard Classification of Transported Goods (SCTG) 2 commodity codes, the Principal Product Carried was not used in this analysis because any record (truck) could carry more than one commodity. Instead the percentage of miles carrying each commodity for each survey response was used.

The reported percentage of miles carrying each VIUS commodity code is given for each record. An example, for Sand—SCTG 11, is shown below.

PSANDS = Percent of Loaded Miles Carrying Natural Sands, SCTG 11. Question: During 2002, what products, tools, equipment, or materials did this vehicle carry, and what approximate percent of LOADED mileage were they carried?

This information can be used to allocate the miles traveled by a truck record to each commodity. This information is sufficient to calculate the cargo load for each record, and the weighted miles for each SCTG2 commodity. The weighted cargo multiplied by weighted miles for each record multiplied by the percentage of miles carrying each commodity gives the ton-miles for each commodity for each record.

It is appropriate for any reported or derived statistic to be differentiated by the sample stratum for those records only. For example, it would not be correct to say with statistically certainty that a certain commodity is carried in certain body types, because neither the body type nor the commodity carried are in the sample stratum.

The ton miles per truck from the 2002 VIUS are as shown in table 34. Also shown in table 34 are the results for strata as defined in table 31. The results for Stratum 1 and 2 are typically combined as Light Trucks. The results for Stratum 3 and 4 are typically combined as Single Units (SU) trucks. The results for Stratum 5 are typically called Combination Unit (CU) trucks. Also shown are the results for all truck strata combined, for only SU and CU trucks, and the standard error using the customary formulae for each for each as calculated from the standard deviation, counts and means of the survey records.

The miles per truck from the 2002 VIUS are as shown in table 35. VIUS also reports miles that are used by truck to transport Tools (powered and nonpowered), and for personal uses. Those miles as well as the percentage of all miles in Service, i.e., carrying tools, in personal use, and carrying cargo by commodities are shown in table 35. The payload factors by SCTG2, as tons per truck, are calculated by dividing the ton-miles in table 34 by the miles per truck in table 35 and are shown in table 36.

It is not proposed that Light Trucks be included for use in the Freight Analysis Framework (FAF). As shown in table 35, light trucks are predominately used for personal purposes, 82 percent of all miles, not to transport SCTG freight. By contrast the combined total of miles for SU and CU trucks are predominately used to transport SCTG2 freight, 81 percent of all miles.

Table 34. 2002 vehicle inventory and use survey ton miles (in billions) by standard classification of transported goods 2 commodity and by truck size.
Commodity Stratum 1&2 Also known as Light Trucks Relative Standard Error Stratum 3&4 Also known as SU trucks Relative Standard Error Stratum 5 Also known as CU trucks Relative Standard Error All Stratums Relative Standard Error Combined SU and CU trucks Relative Standard Error
01 3.22 17.9% 0.55 37.3% 10.55 9.8% 14.32 7.3% 11.10 6.6%
02 1.54 26.4% 2.04 9.3% 25.30 3.3% 28.88 2.1% 27.34 4.5%
03 4.80 26.4% 2.69 9.3% 38.25 3.3% 45.75 2.1% 40.94 5.9%
04 3.03 19.8% 1.59 16.5% 17.63 4.0% 22.25 2.8% 19.22 7.8%
05 1.67 35.3% 1.56 14.6% 47.41 1.4% 50.65 2.8% 48.97 2.9%
06 1.77 36.0% 1.76 11.1% 43.18 1.6% 46.70 2.8% 44.93 3.1%
07 3.29 26.3% 4.80 7.4% 88.76 1.1% 96.85 2.8% 93.56 2.2%
08 0.43 45.8% 0.94 16.9% 16.90 1.7% 18.27 2.8% 17.84 3.8%
09 0.40 39.8% 0.43 34.0% 6.66 3.7% 7.49 2.8% 7.09 8.3%
10 0.52 62.5% 1.40 13.6% 5.07 8.2% 6.99 2.8% 6.47 14.4%
11 0.18 56.6% 6.35 6.1% 11.09 3.4% 17.63 2.8% 17.45 6.3%
12 1.18 52.9% 18.54 4.0% 27.31 4.0% 47.03 2.8% 45.85 6.0%
13 0.09 42.2% 2.51 10.0% 6.24 3.5% 8.83 2.8% 8.75 7.7%
14 0.00 100.0% 0.14 35.5% 0.59 6.3% 0.73 2.8% 0.73 17.0%
15 0.00 57.8% 0.99 16.1% 6.07 2.0% 7.07 2.8% 7.07 5.7%
16 #N/A #N/A 0.34 25.7% 1.77 3.8% 2.11 2.8% 2.11 10.5%
17 0.67 35.6% 0.80 17.1% 14.48 2.1% 15.94 2.8% 15.27 4.4%
18 3.08 26.0% 3.75 8.5% 12.07 7.6% 18.90 2.8% 15.82 12.1%
19 0.87 25.4% 2.67 8.3% 9.53 3.7% 13.07 2.8% 12.20 7.1%
20 1.32 49.1% 1.19 17.6% 10.48 6.7% 12.99 2.8% 11.67 12.3%
21 1.06 39.9% 0.45 30.9% 3.08 15.0% 4.60 2.8% 3.54 26.7%
22 3.15 36.3% 1.11 11.5% 7.96 13.3% 12.23 2.8% 9.07 21.1%
23 10.44 48.2% 1.11 13.7% 17.70 24.6% 29.25 2.8% 18.81 39.4%
24 3.07 28.0% 0.91 17.3% 15.49 5.4% 19.46 2.8% 16.39 9.7%
25 1.18 34.6% 1.33 13.5% 18.21 2.6% 20.72 2.8% 19.54 5.2%
26 10.33 17.9% 3.76 6.5% 43.91 4.0% 58.00 2.8% 47.67 6.7%
27 0.14 45.6% 0.19 50.5% 16.10 0.8% 16.43 2.8% 16.29 2.0%
28 0.99 33.3% 0.84 17.4% 32.94 1.2% 34.77 2.8% 33.77 2.4%
29 4.96 50.1% 0.60 15.2% 9.09 23.7% 14.65 2.8% 9.69 38.2%
30 3.17 33.3% 0.62 17.4% 19.87 1.2% 23.66 2.8% 20.49 16.1%
31 6.64 30.5% 15.19 4.0% 28.80 7.5% 50.63 2.8% 43.99 9.9%
32 9.16 25.1% 2.06 12.9% 38.12 5.6% 49.34 2.8% 40.19 9.7%
33 28.84 16.5% 3.84 10.0% 17.31 24.8% 49.99 2.8% 21.15 36.0%
34 14.38 23.6% 2.31 11.8% 35.44 8.6% 52.12 2.8% 37.74 14.4%
35 25.04 28.4% 1.54 14.4% 17.28 35.6% 43.85 2.8% 18.81 55.8%
36 5.29 27.4% 3.94 10.6% 38.02 4.0% 47.24 2.8% 41.95 7.3%
37 0.72 53.7% 0.35 42.8% 11.47 3.8% 12.54 2.8% 11.82 7.7%
38 15.62 29.7% 0.90 23.9% 4.57 89.0% 21.09 2.8% 5.47 128.4%
39 3.07 23.1% 1.12 10.9% 19.78 3.5% 23.96 2.8% 20.90 6.2%
40 13.36 38.0% 1.84 12.8% 32.30 13.8% 47.50 2.8% 34.13 22.5%
41 2.80 19.1% 17.87 5.5% 19.07 6.2% 39.74 2.8% 36.94 8.6%
42 7.34 26.1% 8.36 21.5% 33.49 8.9% 49.19 2.8% 41.85 17.2%
43 0.26 44.6% 1.14 15.8% 237.94 0.1% 239.34 2.8% 239.08 0.3%
All SCTGs 199.06 29.1% 126.42 9.5% 1,117.28 5.2% 1,442.72 4.3% 1,243.66 8.9%
(Source: Federal Highway Administration.)

Table 35. 2002 vehicle inventory and use survey miles (in billions) by standard classification of transported goods 2 commodity and by truck size.
Commodity Stratums 1&2 Light Trucks Relative Standard Error Stratums 3&4 SU trucks Relative Standard Error Stratum 5 CU trucks Relative Standard Error All Stratums Relative Standard Error Combined SU and CU trucks Relative Standard Error
01 1.21 23% 0.18 39% 0.53 9% 1.93 35% 0.71 23%
02 0.41 26% 0.22 8% 1.11 6% 1.73 20% 1.32 11%
03 1.33 15% 0.57 8% 1.87 6% 3.77 17% 2.44 10%
04 1.08 16% 0.22 12% 1.84 7% 3.13 19% 2.06 12%
05 0.87 24% 0.43 12% 2.46 5% 3.76 18% 2.89 9%
06 1.09 37% 0.93 7% 2.43 5% 4.45 24% 3.36 9%
07 1.60 21% 1.1 6% 6.03 3% 8.72 13% 7.12 6%
08 0.27 66% 0.17 13% 0.93 6% 1.37 33% 1.09 11%
09 0.23 47% 0.07 29% 0.36 13% 0.67 48% 0.43 25%
10 0.25 37% 0.16 16% 0.26 11% 0.67 38% 0.41 19%
11 0.06 36% 0.48 6% 0.49 9% 1.03 17% 0.97 11%
12 0.51 43% 1.25 3% 1.20 6% 2.96 20% 2.45 7%
13 0.05 64% 0.19 8% 0.26 12% 0.50 29% 0.45 16%
14 0.00 100% 0.02 35% 0.03 27% 0.04 55% 0.04 45%
15 0.00 59% 0.05 17% 0.24 14% 0.29 28% 0.29 23%
16 #N/A #N/A 0.05 31% 0.08 28% 0.13 54% 0.13 44%
17 0.53 40% 0.15 13% 0.61 9% 1.29 39% 0.76 15%
18 2.13 32% 0.59 9% 0.51 9% 3.22 42% 1.1 12%
19 0.61 33% 0.63 8% 0.44 12% 1.68 32% 1.07 14%
20 0.56 27% 0.29 13% 0.53 10% 1.39 30% 0.83 16%
21 0.81 30% 0.13 20% 0.17 22% 1.10 48% 0.29 31%
22 0.98 49% 0.22 9% 1.41 9% 2.60 43% 1.63 14%
23 4.29 24% 0.35 10% 0.93 9% 5.56 36% 1.27 15%
24 1.53 25% 0.36 10% 1.92 7% 3.81 26% 2.28 12%
25 0.50 31% 0.17 14% 0.78 6% 1.45 27% 0.95 12%
26 4.39 15% 1.03 6% 2.13 4% 7.55 19% 3.16 8%
27 0.14 46% 0.05 32% 1.86 7% 2.06 20% 1.92 13%
28 0.76 28% 0.24 12% 2.84 5% 3.85 19% 3.09 10%
29 2.83 20% 0.22 12% 0.49 12% 3.53 31% 0.71 18%
30 1.35 32% 0.28 12% 1.13 7% 2.76 35% 1.41 13%
31 3.04 19% 1.47 4% 1.28 6% 5.79 22% 2.75 8%
32 3.53 18% 0.77 9% 1.93 6% 6.23 23% 2.7 10%
33 12.48 10% 1.63 6% 0.91 7% 15.03 17% 2.54 9%
34 4.85 15% 0.89 7% 1.90 7% 7.64 21% 2.79 10%
35 9.39 12% 0.69 9% 2.00 7% 12.08 19% 2.69 11%
36 3.02 19% 1.41 10% 2.18 6% 6.61 22% 3.59 10%
37 0.19 33% 0.05 20% 0.53 15% 0.77 37% 0.57 25%
38 6.66 14% 0.35 13% 0.24 18% 7.26 25% 0.59 22%
39 1.43 20% 0.58 8% 1.16 6% 3.18 22% 1.75 10%
40 5.59 18% 0.68 8% 2.84 6% 9.12 24% 3.53 9%
41 1.39 17% 2.34 4% 0.91 7% 4.63 15% 3.25 7%
42 4.47 21% 2.26 18% 1.99 8% 8.72 29% 4.25 18%
43 0.07 38% 0.38 12% 14.09 3% 14.54 8% 14.47 6%
All SCTGs 86.49 19% 24.3 9% 67.81 7% 178.58 24% 92.13 12%
Tools Powered 34.21 6% 41.03 5% 0.62 9% 38.93 10% 41.65 7%
Tools Nonpowered 46.28 5% 55.68 6% 0.43 10% 52.27 9% 56.11 8%
Total Service (Tools) 80.48 Empty cell. 96.8 Empty cell. 1.06 Empty cell. 91.21 Empty cell. 97.77 Empty cell.
Personal 750.55 Empty cell. 68.68 10% 0.05 21% 757.47 2% 68.73 13%
Total 917.45 Empty cell. 189.69 10% 68.93 8% 1,012.72 6% 258.62 12%
Personal 82% Empty cell. 36% Empty cell. 0% Empty cell. 74% Empty cell. 27% Empty cell.
Service 9% Empty cell. 51% Empty cell. 2% Empty cell. 9% Empty cell. 38% Empty cell.
SCTGs 9% Empty cell. 13% Empty cell. 98% Empty cell. 17% Empty cell. 36% Empty cell.
(Source: Federal Highway Administration.)

Table 36. 2002 vehicle inventory and use survey tons per truck by standard classification of transported goods 2 commodity and by truck size.
Commodity Stratum 1&2 Light Trucks Relative Standard Error Stratum 3&4 SU trucks Relative Standard Error Stratum 5 CU trucks Relative Standard Error All Stratums Relative Standard Error Combined SU and CU trucks Relative Standard Error
01 2.65 29% 3.06 54% 19.91 13% 7.44 13% 15.63 11%
02 3.80 37% 9.27 12% 22.79 7% 16.72 6% 20.71 6%
03 3.61 30% 4.72 12% 20.45 7% 12.14 5% 16.78 7%
04 2.82 25% 7.23 21% 9.58 8% 7.10 6% 9.33 9%
05 1.92 43% 3.63 19% 19.27 5% 13.47 6% 16.94 5%
06 1.62 51% 1.89 13% 17.77 6% 10.50 7% 13.37 5%
07 2.06 33% 4.36 10% 14.72 4% 11.10 4% 13.14 3%
08 1.56 80% 5.53 21% 18.17 6% 13.35 9% 16.37 6%
09 1.71 62% 6.14 45% 18.50 14% 11.25 14% 16.49 13%
10 2.05 72% 8.75 21% 19.50 14% 10.49 12% 15.78 17%
11 2.83 67% 13.23 8% 22.63 10% 17.06 6% 17.99 8%
12 2.30 68% 14.83 5% 22.76 7% 15.87 7% 18.71 7%
13 1.69 77% 13.21 13% 24.00 12% 17.60 9% 19.44 10%
14 1.00 141% 7.00 50% 19.67 28% 17.30 16% 18.25 26%
15 4.04 83% 19.80 24% 25.29 14% 24.41 8% 24.38 11%
16 #N/A #N/A 6.80 40% 22.13 29% 16.60 16% 16.23 22%
17 1.27 54% 5.33 21% 23.74 9% 12.39 12% 20.09 7%
18 1.45 41% 6.36 12% 23.67 12% 5.86 14% 14.38 13%
19 1.44 41% 4.24 12% 21.66 13% 7.79 11% 11.40 10%
20 2.35 56% 4.10 22% 19.77 12% 9.35 10% 14.06 14%
21 1.31 50% 3.46 37% 18.12 26% 4.17 16% 12.21 30%
22 3.23 61% 5.05 15% 5.65 16% 4.70 12% 5.56 22%
23 2.44 54% 3.17 17% 19.03 26% 5.26 12% 14.81 40%
24 2.01 37% 2.53 20% 8.07 9% 5.11 8% 7.19 11%
25 2.37 46% 7.82 19% 23.35 7% 14.26 8% 20.57 7%
26 2.35 23% 3.65 9% 20.62 6% 7.68 7% 15.09 7%
27 1.00 65% 3.80 60% 8.66 7% 7.99 6% 8.48 5%
28 1.30 43% 3.50 21% 11.60 6% 9.03 6% 10.93 4%
29 1.75 54% 2.73 20% 18.55 26% 4.14 11% 13.65 39%
30 2.35 46% 2.21 21% 17.58 8% 8.58 11% 14.53 17%
31 2.18 36% 10.33 6% 22.50 10% 8.74 8% 16.00 11%
32 2.59 31% 2.68 16% 19.75 8% 7.92 8% 14.89 11%
33 2.31 19% 2.36 11% 19.02 26% 3.33 6% 8.33 36%
34 2.97 28% 2.60 14% 18.65 11% 6.82 7% 13.53 15%
35 2.67 31% 2.23 17% 8.64 36% 3.63 7% 6.99 56%
36 1.75 33% 2.79 14% 17.44 7% 7.14 7% 11.69 9%
37 3.75 63% 7.00 47% 21.64 15% 16.36 10% 20.74 12%
38 2.34 33% 2.57 27% 19.04 91% 2.91 9% 9.27 129%
39 2.14 30% 1.93 13% 17.05 7% 7.54 7% 11.94 8%
40 2.39 42% 2.71 15% 11.37 15% 5.21 8% 9.67 23%
41 2.02 26% 7.64 7% 20.96 10% 8.58 6% 11.37 9%
42 1.64 33% 3.70 28% 16.83 12% 5.64 10% 9.85 19%
43 3.50 59% 3.00 20% 16.89 3% 16.46 3% 16.52 2%
All SCTGs 2.30 35% 5.20 13% 16.47 9% 15.66 24% 13.50 15%
(Source: Federal Highway Administration.)

Comparison of Proposed Payload Factors with California Vehicle Inventory and Use Survey

The microdata for California's VIUS (CA-VIUS is not yet publicly available). CA-VIUS, like 2002 U.S. VIUS, is a statistical survey. As such the factors that can be derived cannot be exact, but instead have standard errors associated with them. The sampling was conducted in a manner to minimize the error within the sampling strata. When attributes that are not sampling strata are used, the error associated with factors for these attributes can be computed but will not be the error associated with the sampling strata.

The California Department of Transportation (Caltrans) undertook the CA-VIUS project, a sampling of trucks registered in California which also travel on California roads, and of International Registration Plan (IRP) trucks traveling on California roads, because its ongoing responsibilities required payload factors, tons per truck, which were more current than those available from 2002 U.S. VIUS, which was its current source of those payloads.

Caltrans has not yet made the microdata for CA-VIUS available to this project. This means that the errors and statistics associated with its payload factors cannot be computed or restated for particular attributes. However, the payload factors for the California Statewide Freight Forecasting Model (CSFFM) are available. The computation of those payload CSFFM payload factors was in fact a major impetus for CA-VIUS. The CSFFM commodity groups are aggregations of SCTG2/U.S. VIUS commodity groups. Those aggregations are shown in table 37.

Table 37. California statewide freight forecasting model and standard classification of transported goods 2 commodity groups.
CSFFM Commodity Group SCTG Code
G1 Agriculture products 1–4
G2 Wood, printed products 26–29
G3 Crude petroleum 16
G4 Fuel and oil products 17, 18, 19
G5 Gravel/sand and nonmetallic minerals 8–13
G6 Coal/metallic minerals 14–15
G7 Food, beverage, tobacco products 5–7
G8 Manufactured products 24, 30, 39, 40, 42, 43
G9 Chemical/pharmaceutical products 20–23
G10 Nonmetal mineral products 31
G11 Metal manufactured products 32–34
G12 Waste material 41
G13 Electronics 35, 38
G14 Transportation equipment 36–37
G15 Logs 25
(Source: Federal Highway Administration.)

The payloads for the CSFFM have been computed and are reported for trucks by GVW, as shown in table 38.

Table 38. California statewide freight forecasting model payloads by truck gross vehicle weight.
CSFFM Commodity Group 14–26 k lbs. GVW 4 thru 6 26–33 k lbs. GVW 7 >33 k lbs. GVW 8
G1 Agriculture products 4,856 14,943 39,350
G2 Wood, printed products 3,206 14,160 31,161
G3 Crude petroleum 3,640 Empty cell. 34,458
G4 Fuel and oil products 8,946 Empty cell. 33,078
G5 Gravel/sand and nonmetallic minerals 2,870 14,458 26,792
G6 Coal/metallic minerals 5,013 13,298 38,141
G7 Food, beverage, tobacco products 3,202 9,669 35,812
G8 Manufactured products 4,448 14,745 40,352
G9 Chemical/pharmaceutical products 4,131 6,192 40,471
G10 Nonmetal mineral products 4,089 10,457 33,166
G11 Metal manufactured products 3,820 9,352 37,046
G12 Waste material 3,243 18,637 39,257
G13 Electronics 4,223 10,993 35,151
G14 Transportation equipment 3,602 9,419 30,004
G15 Logs 4,381 10,861 38,919
(Source: Federal Highway Administration.)

There is no CSFFM payload provided for all commodity groups (CG) combined. While the 2002 U.S. VIUS also could be used to compute payload factors by GVW, this has not been done. Payload factors by GVW will not be used in the FAF. There is overlap between the proposed method and CA-VIUS for Combination Unit (CU) tractor-trailer trucks, which are primarily GVW 8. It is possible to compute the standard error for payload factors, from the standard deviation, count of records, and means, for ton miles and miles by SCTG2 commodity, and then to compare those with those for the CSFFM CGs. This can only be done for a comparison to the VIUS derived payload factors. Any updates to the payload factors for years other than 2002 will create additional changes to the standard error, error range, but those new error ranges cannot be computed. If the CA-VIUS payload factors for GVW 8 trucks fall within the error range for the 2002 VIUS payload factors (i.e., Truck Payload Factors) for CU trucks, then it can be assumed that CA-VIUS and 2002 U.S. VIUS derived payload factors are statistically the same. If they are not the same, it could be that the difference reflects usage of trucks by CG that is different in CA than in the United States, or that the more recent CA-VIUS reflects changes in trucking practices. The comparison between the U.S. and CA-VIUS for GVW 8/CU truck is shown in table 39.

Table 39. Comparison of 2002 U.S. vehicle inventory and use survey and California vehicle inventory and use survey payload factors.
CSFFM Commodity 2002 U.S. VIUS—Tons per Truck 2002 U.S. VIUS—RSE 2002 U.S. VIUS—Low Lbs. 2002 U.S. VIUS—High Lbs. CA-VIUS GVW 8—Lbs. per truck CA-VIUS = 2002 U.S. VIUS
G1 Agriculture products 17.15 22% 26,923 41,688 39,350 TRUE
G2 Wood, printed products 13.93 21% 22,110 33,607 31,161 TRUE
G3 Crude petroleum 21.89 32% 29,709 57,865 34,458 TRUE
G4 Fuel and oil products 23.06 24% 34,994 57,241 33,078 FALSE
G5 Gravel/sand and nonmetallic minerals 20.96 28% 30,185 53,642 26,792 FALSE
G6 Coal/metallic minerals 25.60 29% 36,450 65,933 38,141 TRUE
G7 Food, beverage, tobacco products 16.44 10% 29,748 36,014 35,812 TRUE
G8 Manufactured products 15.51 17% 25,736 36,323 40,352 FALSE
G9 Chemical/pharmaceutical products 12.91 53% 12,088 39,558 40,471 FALSE
G10 Nonmetal mineral products 22.45 14% 38,684 51,121 33,166 FALSE
G11 Metal manufactured products 19.17 29% 27,165 49,534 37,046 TRUE
G12 Waste material 21.02 14% 36,311 47,768 39,257 TRUE
G13 Electronics 9.74 70% 5,831 33,139 35,151 FALSE
G14 Transportation equipment 18.29 16% 30,669 42,501 30,004 FALSE
G15 Logs 23.25 9% 42,380 50,610 38,919 FALSE
Note: CSFFM reports in lbs. In FAF payload factors are reported as tons per truck while CSFFM reports payload as lbs. per truck.
(Source: Federal Highway Administration.)

It cannot be concluded that there is no statistical difference between the CA-VIUS and proposed payload factors from 2002 U.S. VIUS. Only 7 of 15 CGs from CA-VIUS are within the error ranges computed from 2002 U.S. VIUS. However, for three additional CGs, shown as shaded rows in table 39 , the CA-VIUS payload for GVW Class 8 differs from the CU proposed payload factors from 2002 U.S. VIUS by less than one ton per truck. For the remaining commodities, it is probable that the differences reflect differences in operations on California roads compared to national roads. For example, the GVW 8 trucks used to transport Sand and Gravel can be expected to be different from the U.S. average. It has not been demonstrated that the proposed truck payload factors (TPF), payload factors, derived from U.S. VIUS, for the CGs and truck sizes used in the CSFFM, are substantially different. It is probable that payload factors in the U.S. have not changed substantially based on a comparison with CA-VIUS. Payload factors from 2002 U.S. VIUS could be computed using the methods that are proposed.

Step 2: Allocation of Tons to Combination Unit and Single Unit Trucks

The FAF Origin-Destination (O-D) database reports commodity flows by tons that are carried by truck, but it does not report commodity carried by unit truck. In the current FAF assignment results does not differentiate between SU and CU trucks. A method to convert FAF tons by commodity to FAF trucks by commodity and by truck size (limited to Single Unit, SU, and Combination Unit, CU, trucks, not the many truck sizes in current FAF TPF methods) would be desirable. This allocation of FAF truck volumes could be stated as the more commonly reported CU and SU trucks.

Information to make this allocation can be developed using the 2002 U.S. VIUS. For example, allocating by the share of ton-miles, the payload factor will be applied to tons by truck moving between an Origin and a Destination with a defined distance. Because the flow unit will be tons for a defined number of miles, allocating to SU and CU trucks based on their share of ton-miles would be consistent. The expanded ton-miles for each record by SCTG2 commodity estimated by truck strata (which can be aggregated to SUs and CUs) is shown in table 34. The percentage split between SU and CU trucks by annual ton-miles is shown in table 40. Also shown in that table is the Standard Error, SE, associated with that percentage, (which is square root of the sum of the squares of the SEs of SU and CU ton-miles).

Table 40. Single unit and combination unit ton-miles by standard classification of transported goods 2 from 2002 U.S. vehicle inventory and use survey.
SCTG2 Commodity SU Trucks CU trucks Standard Error
01 Live Animals and Fish 5% 95% 39%
02 Cereal Grains (including seed) 7% 93% 10%
03 Other Agricultural Products, except for Animal Feed 7% 93% 10%
04 Animal Feed and Products of Animal Origin, n.e.c. 8% 92% 17%
05 Meat, Fish, and Seafood, and Their Preparations 3% 97% 15%
06 Milled Grain Products and Preparations, and Bakery Products 4% 96% 11%
07 Other Prepared Foodstuffs, and Fats and Oils 5% 95% 7%
08 Alcoholic Beverages 5% 95% 17%
09 Tobacco Products 6% 94% 34%
10 Monumental or Building Stone 22% 78% 16%
11 Natural Sands 36% 64% 7%
12 Gravel and Crushed Stone 40% 60% 6%
13 Nonmetallic Minerals, n.e.c. 29% 71% 11%
14 Metallic Ores and Concentrates 19% 81% 36%
15 Coal 14% 86% 16%
16 Crude Petroleum Oil 16% 84% 26%
17 Gasoline and Aviation Turbine Fuel 5% 95% 17%
18 Fuel Oils 24% 76% 11%
19 Coal and Petroleum Products, n.e.c. 22% 78% 9%
20 Basic Chemicals 10% 90% 19%
21 Pharmaceutical Products 13% 87% 34%
22 Fertilizers 12% 88% 18%
23 Chemical Products and Preparations, n.e.c. 6% 94% 28%
24 Plastics and Rubber 6% 94% 18%
25 Logs and Other Wood in the Rough 7% 93% 14%
26 Wood Products 8% 92% 8%
27 Pulp, Newsprint, Paper, and Paperboard 1% 99% 51%
28 Paper or Paperboard Articles 2% 98% 17%
29 Printed Products 6% 94% 28%
30 Textiles, Leather, and Articles of Textiles or Leather 3% 97% 17%
31 Nonmetallic Mineral Products 35% 65% 9%
32 Base Metal in Primary or Semi-Finished Forms and in Finished Basic Shapes 5% 95% 14%
33 Articles of Base Metal 18% 82% 27%
34 Machinery 6% 94% 15%
35 Electronic and Other Electrical Equipment and Components, and Office Equipment 8% 92% 38%
36 Motorized and Other Vehicles (including parts) 9% 91% 11%
37 Transportation Equipment, n.e.c. 3% 97% 43%
38 Precision Instruments and Apparatus 17% 83% 92%
39 Furniture, Mattresses and Mattress Supports, Lamps, Lighting Fittings, and Illuminated Signs 5% 95% 11%
40 Miscellaneous Manufactured Products 5% 95% 19%
41 Waste and Scrap 48% 52% 8%
42 Mail, Empty Containers and Other Special 20% 80% 23%
43 Mixed Freight 0% 100% 16%
Empty cell. All SCTGs 10% 90% 11%
(Source: Federal Highway Administration.)

As expected, the usage across all SCTG commodities by ton-miles is primarily by CU trucks, 90 percent, and its standard error is only 11 percent. However, the usage by individual commodities for CU trucks ranges from a high of 100 percent by CU for SCTG 43 to a low of 52 percent for SCTG 41. Additionally, the Standard Error for an SCTG2 commodity varies from a low of 6 percent for SCTG 12 to a high of 92 percent for SCTG 38.

With the caution that the split between SU and CU trucks is based on nationally observed percentages, the Tons per Truck, payload factor, by SCTG2 for both SU and CU trucks can be applied. The payload factors by individual SCTG2 commodity and truck size are shown in table 36.

A method to produce FAF truck assignments by SCTG2, differentiated between SU and CU trucks, is described below.

  • Step 1. For each O/D/C/Truck cell, apply the percentage usage by SU and CU trucks to the flow in Tons reported in FAF. This will produce two additional tables for each SCTG2: 1) FAF tons by SU trucks and 2) FAF tons by CU trucks.
  • Step 2. For each O-D table created in Step 1, convert from tons to trucks using the payload factors as shown in table 36. This will not change the number of tables but will produce SCTG2 tables of annual SU FAF trucks and annual CU FAF trucks, in addition to the current table of total FAF trucks.

It is cautioned that the VIUS used to develop this information was only intended to produce overall national averages. While those national percentages themselves have errors associated with them, and that error typically increases with increasing commodity detail, the national averages may not be applicable to the actual trip distances for any given O-D pair. On average, aggregating nationally, the estimated number of trucks and vehicle miles traveled (VMT) across all commodities can be expected to be correct, but the application and assignment on any given link can be expected to vary from observed counts.

The annual national information in VIUS does not support any analysis for individual trips or distances. The average distance range as reported in VIUS applies to all miles traveled by the surveyed truck, not the miles for specific commodities.

If an assignment is done with all three tables, SU trucks, CU trucks, and Combined SU and CU trucks, then the Combined SU and CU truck volume on any highway link will not be equal to the sum of the SU and CU truck volumes. As noted in table 36, these payload factors have an error associated with them. Additionally, the allocation percentages proposed in table 40 also are not exact but have associated standard errors. If the payload factors are applied to each O-D cell for SU, CU and Total, i.e., Combined SU and CU, FAF Trucks, and each cell is assigned to the network, then it is highly improbable for the flows on a link level for the assignment of SU and CU tables to be equal to the assigned volumes of Combined SU and CU trucks. Instead, the following method is proposed.

Assign only two tables, 1) SU FAF trucks, and 2) CU FAF trucks, and never create or assign a table of Total trucks. Define the Combined SU and CU FAF truck volumes on a link as the sum of the assigned SU and CU trucks. This will ensure that, on each highway link, the addition of the volume of SU and CU FAF trucks will be equal to volume of the Combined SU and CU FAF trucks.

It is cautioned that while the assignment is expected to produce reasonable results in the aggregate, the results on any given link be used with care. Because the observed flows on a link will not only include trucks carrying FAF commodities, but also trucks that do not carry FAF commodities (e.g., non-FAF trucks can carry payloads not considered to be freight, e.g., are part of the manufacturing process or local delivery of reported freight, or to provide services) there will be no way to validate these FAF truck assignments.

Step 3: Factoring 2002 Vehicle Inventory and Use Survey Truck Payload Factors Using Miles and Tons Growth

The previous step, step 2, describes methods to apply payload factors that will result in SU and CU truck assignments. However, these methods rely on values from the 2002 VIUS that are not consistent with the 2012 base year of the FAF and have not been updated for future years. VIUS had previously been collected as part of the U.S. Economic Census conducted in years ending in 2 and 7. VIUS was discontinued in 2002 and no new data collection is expected. Regardless, VIUS still remains the only viable source for the SCTG2 usage of the contents of trucks.

While the changes in payload factors by SCTG2 commodity are not available, the overall changes in miles and payloads are reported separately. National changes in miles traveled by truck size are reported in Highway Statistics table VM-1. Changes in payload is reported by State in Vehicle Travel Information System (VTRIS) table W-3 and can be summarized to develop national changes. If it is assumed that the changes by SCTG2 are the same as these overall changes, the revisited 2002 VIUS payload factors can be updated to any year.

Table 41 shows the changes in VMT from 2002, the year of VIUS, to 2012, the base year of Freight Analysis Framework Version 4 (FAF4), and to 2017, the presumed base year for the upcoming FAF5.

Table 41. Vehicle miles traveled growth in single unit and combination unit trucks.
Empty cell. SU VMT (millions) CU VMT (millions) SU Truck Registrations CU Truck Registrations
2002 75,866 138,737 5,650,619 2,276,661
2012 105,605 163,602 8,190,286 2,469,094
Growth 02 to 12 39% 18% 45% 8%
CAGR 02 to 12 3.4% 1.7% 3.8% 0.8%
2017 116,102 181,490 8,746,518 2,752,043
Growth 02 to 17 53% 31% 55% 21%
CAGR 02 to 17 2.9% 1.8% 3.0% 1.3%
(Source: Federal Highway Administration.)

The growth in Vehicle Miles of Travel, VMT, is consistent with the growth in registrations. The growth in ton-miles will be a function of both the growth in tons and the growth in miles. The share of ton-miles is used to allocate tables of total tons to separate tables of tons by SU and tons by CU Trucks.

WIM data is submitted by States to Federal Highway Administration's (FHWA) VTRIS, which is part of its Travel Monitoring Analysis System (TMAS). WIM data only reports the average weight and vehicle class of a truck, where the classification is based on the truck types and number of axles that are used in FHWA's 13 vehicle classification system. As passively collected data, WIM cannot directly determine the contents of the truck, either the type of commodity that is being carried, or whether a truck is empty, or fully, or partially, loaded. VTRIS table W-3 makes an estimate of loaded and empty trucks and then uses that information to estimate the payload of loaded vehicles. This estimation is made with user‑defined "breakpoints," which are not the empty weight of a truck, but the point which minimizes the errors of that estimation. Ideally, the actual empty weights follow a normal distribution. The breakpoints are total observed weights that are designed to minimize false negatives (e.g., a vehicle is estimated to be empty when in fact it is partially loaded). From W-3, the national estimates of payload are shown in table 42. While the ratios to 2002 are shown, it does appear from the data that changes in payloads, particularly for observed CU trucks, may be expected statistical variation, and payloads are not changing significantly over time.

Table 42. Weigh-in-motion estimated payloads.
Empty cell. Empty cell. Total Observed Estimated loaded Estimated Total Payload (tons) Estimated Average Payload (tons) Ratio to 2002
2002 SU 18,687 10,638 70,269 6.61 1.000
2002 CU 35,154 30,313 492,145 16.24 1.000
2002 Total 53,841 40,951 562,414 Empty cell. Empty cell.
2012 SU 18,262 11,152 88,291 7.92 1.199
2012 CU 34,586 29,959 491,794 16.42 1.011
2012 Total 52,848 41,111 580,085 Empty cell. Empty cell.
2017 SU 424,351 256,372 1,610,721 6.28 0.951
2017 CU 1,205,516 1,058,233 16,804,501 15.88 0.978
2017 Total 1,629,867 1,314,605 18,415,222 Empty cell. Empty cell.
(Source: National Summaries developed from State W-3 tables.)

If it is assumed that the changes in miles and the changes in tons can be applied equally to each SCTG2 commodity in VIUS/FAF, then the changes from 2002 can be used to adjust the payload factors from 2002 VIUS.

The basic equation for Ton miles by commodity can be expressed as:

An Equation. Figure 68. Equation. Ton miles by commodity.
(Source: Federal Highway Administration.)

Where

Ton-Miles for truck size s during year y for commodity c. = Ton-Miles for truck size s during year y for commodity c.

Truck Payload Factor for truck size s during year y for commodity c. = Truck Payload Factor for truck size s during year y for commodity c.

Loaded Miles for truck size s during year y for commodity c. = Loaded Miles for truck size s during year y for commodity c.

Then by definition

Figure 69 is an equation. Figure 69. Equation. Payload factors by size, year, commodity.
(Source: Federal Highway Administration.)

The 2002 VIUS reports truck sizes as SU and CU trucks, commodities as SCTG2, loaded miles, and an expansion factor, for each survey record. It also reports the average loaded weight, the empty weight and the percentage of loaded miles carrying each VIUS commodity.

As proposed in chapter 12, the ton-miles and miles carrying each SCTG2 commodity, in VIUS can be used to compute payload factors by truck size, e.g., Single Unit (SU) and Combination Unit (CU) trucks, for the VIUS year of 2002.

The truck sizes in VIUS can be expressed as SU and CU trucks. The commodities are the SCTG2 commodities. The Loaded Miles and Ton-miles for 2002 by SCTG2 commodity in VIUS records can be found as:

Figure 70 is an equation. Figure 70. Equation. Loaded miles (2002).
(Source: Federal Highway Administration.)

And

An equation where ton miles carrying commodity SCTG2 for 2002 equals average loaded weight reported for 2002 minus the empty weight reported for 2002, multiplied by the loaded miles carrying commodity SCTG2 for 2002. Figure 71. Equation. Ton miles (2002).
(Source: Federal Highway Administration.)

Where

Percentage of loaded miles carrying commodity SCTG2 for each survey record. = Percentage of loaded miles carrying commodity SCTG2 for each survey record.

Expanded loaded miles for each survey record. = Expanded loaded miles for each survey record.

Average loaded weight reported for a survey record. = Average loaded weight reported for a survey record.

Empty weight reported for a survey record. = Empty weight reported for a survey record.

The Ton-Miles and Miles by SCTG2 for Single Unit trucks are found by summing over VIUS records whose size is reported as SU. The Ton-Miles and Miles by SCTG2 for Combination Unit trucks are found by summing over VIUS records whose size is reported as CU. The payload factors for 2002 VIUS, for Combined SU and CU trucks by SCTG2, are found by dividing the sum of their ton-miles by the sum of their miles.

The payload factors for the combined SU and CU trucks payload factor is also the payload factors for the individual payload factors by truck size weighted by the share of miles of that particular truck size. Using the miles and payload factors from 2002 VIUS, that combined payload factor is:

An equation that calculates the combined SU/CU payload factors.
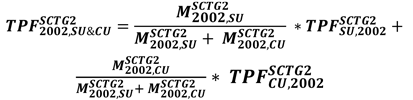
Figure 72. Equation. Combined single unit/combined unit payload factors.
(Source: Federal Highway Administration.)

In order to update these payload factors to a year y other than 2002, it would be necessary to know the following variables:

percentage of loaded miles carrying commodity Standard Classification of Transported Goods 2 (SCTG2) in year y = Percentage of loaded miles carrying commodity SCTG2 in year y.

expanded loaded miles in year y = The expanded loaded miles in year y.

average loaded weight in year y = The average loaded weight in year y.

empty weight reported in year y = The empty weight reported in year y.

There is no source besides the VIUS to estimate how the percentage of miles by SCTG2 commodity have changed for a year y other than 2002. If it is assumed that this percentage did not change, then it is only necessary to estimate how the miles and the cargo weight (e.g., the difference between average loaded and empty weight) have changed between 2002 and a future year y.)

As shown in table 41, Highway Statistics table VM-1 reports the total miles for CU and SU trucks. If it is assumed that the percentage of loaded miles to total miles has not changed, then the growth in VMT for those trucks can be found by examining table VM-1 for 2002 and some additional year y.

As shown in table 42, VTRIS/TMAS table W-3 reports the loaded weight for trucks observed by State WIM stations and estimates the number of loaded and empty trucks, as well as their cargo weights, from user defined breakpoints between empty and loaded trucks. Since what is being sought is only the growth over all trucks nationally, the average loaded weight (empty plus cargo weight) is computed for all WIM stations. Using the default (no variation among States or years) breakpoints, empty trucks, the growth in cargo weight also can be computed if:

a = the growth in SU miles between 2002 and year y, according to VM-1.

b = the growth in CU miles between 2002 and year y, according to VM-1.

c = the growth in SU Cargo weight between 2002 and year y, according to W-3.

d = the growth in CU Cargo weight between 2002 and year y, according to W-3.

Then for truck sizes SU and CU, the following equations can be developed:

An equation that calculates single unit miles. Figure 73. Equation. Single unit miles.
(Source: Federal Highway Administration.)

An equation that calculates combination unit miles. Figure 74. Equation. Combination unit miles.
(Source: Federal Highway Administration.)

An equation that calculates single unit ton miles. Figure 75. Equation. Single unit ton miles.
(Source: Federal Highway Administration.)

And

An equation that calculates combination unit ton miles. Figure 76. Equation. Combination unit ton miles.
(Source: Federal Highway Administration.)

If TPF = TM/M, Payload factor = Ton-Miles/Miles, then

An equation that calculates single unit payload factors. 
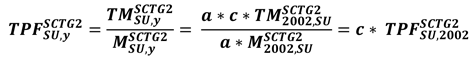
Figure 77. Equation. Single unit payload factors.
(Source: Federal Highway Administration.)

An equation that calculates combination unit payload factors. Figure 78. Equation. Combination unit payload factors.
(Source: Federal Highway Administration.)

An equation that calculates single unit/combination unit payload factors. 
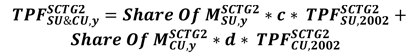
Figure 79. Equation. Single unit/combination unit payload factors.
(Source: Federal Highway Administration.)

Figure 79 is equivalent to:

An equation that calculates single unit/combination unit payload factors for the expanded form.
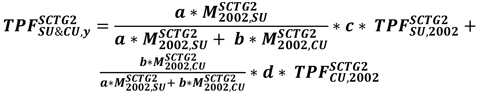
Figure 80. Equation. Single unit/combination unit payload factors (expanded form).
(Source: Federal Highway Administration.)

Appendix D works through an example for SCTG 20—Basic Chemicals so that it is clear how these equations are used.

From the 2002 VIUS payload factors, the change in miles for SU and CU trucks from VM-1, and the change in payloads according to W-3, it is possible to compute the payload factors for SU, CU, and the Combined SU and CU trucks, for any year for which VM-1 and W-3 have been reported. From table 41 and table 42, the ratios between 2002 and 2012 can be determined to be a=1.39, b = 1.18, c=1.199 and d=1.011. Using the 2002 payload factors shown in table 36 and figure 77, figure 79, and figure 80 the payload factors, TPFs, for 2012 are as shown in table 43.

Table 43. Proposed freight analysis framework version 4 payload factors (2012).
SCTG2 Commodity Tons per SU truck Tons per CU truck Weighted tons per SU and CU truck Share of total tons carried by SU trucks Share of total tons carried by CU trucks
1 3.66 20.12 15.42 6.8% 93.2%
2 11.12 23.04 20.79 10.1% 89.9%
3 5.66 20.68 16.71 8.9% 91.1%
4 8.67 9.69 9.56 11.2% 88.8%
5 4.35 19.48 16.90 4.4% 95.6%
6 2.27 17.97 13.09 5.4% 94.6%
7 5.23 14.88 13.17 7.0% 93.0%
8 6.63 18.37 16.29 7.2% 92.8%
9 7.37 18.70 16.59 8.3% 91.7%
10 10.49 19.71 15.84 27.8% 72.2%
11 15.86 22.88 19.12 44.4% 55.6%
12 17.78 23.01 20.13 48.7% 51.3%
13 15.84 24.26 20.37 36.0% 64.0%
14 8.39 19.88 14.83 24.9% 75.1%
15 23.74 25.57 25.21 18.6% 81.4%
16 8.15 22.37 16.34 21.2% 78.8%
17 6.39 24.00 20.04 7.2% 92.8%
18 7.62 23.93 14.52 30.3% 69.7%
19 5.08 21.90 11.34 28.1% 71.9%
20 4.92 19.99 14.08 13.7% 86.3%
21 4.15 18.32 11.60 17.0% 83.0%
22 6.05 5.71 5.76 16.3% 83.7%
23 3.80 19.24 14.50 8.1% 91.9%
24 3.03 8.16 7.23 7.6% 92.4%
25 9.38 23.60 20.70 9.3% 90.7%
26 4.38 20.84 14.87 10.7% 89.3%
27 4.56 8.75 8.62 1.6% 98.4%
28 4.20 11.73 11.04 3.4% 96.6%
29 3.27 18.76 13.40 8.4% 91.6%
30 2.65 17.78 14.36 4.2% 95.8%
31 12.39 22.75 16.79 42.4% 57.6%
32 3.21 19.97 14.61 7.0% 93.0%
33 2.82 19.23 8.10 23.7% 76.3%
34 3.11 18.86 13.26 8.3% 91.7%
35 2.68 8.74 6.98 11.1% 88.9%
36 3.35 17.63 11.46 12.6% 87.4%
37 8.39 21.88 20.53 4.1% 95.9%
38 3.08 19.25 9.03 21.6% 78.4%
39 2.32 17.24 11.71 7.3% 92.7%
40 3.24 11.50 9.68 7.4% 92.6%
41 9.16 21.19 12.14 56.7% 43.3%
42 4.44 17.01 9.82 25.9% 74.1%
43 3.60 17.07 16.66 0.7% 99.3%
All SCTGs 6.24 16.65 13.56 13.6% 86.4%
(Source: Federal Highway Administration.)

From table 41 and table 42, the ratios between 2002 and 2017 can be determined to be a=1.53, b = 1.31, c=0.951 and d= 0.978. Using the 2002 TPFs as shown in table 36 and figure 77, figure 79, and figure 80, the payload factors, TPFs, for 2017 are as shown in table 44.

Table 44. Proposed freight analysis framework version 4 payload factors (2017).
SCTG2 Commodity Tons per SU trucks Tons per CU trucks Weighted tons per SU and CU trucks Share of total tons carried by SU trucks Share of total tons carried by CU trucks
1 2.91 19.47 14.76 5.6% 94.4%
2 8.82 22.29 19.76 8.4% 91.6%
3 4.49 20.00 15.93 7.4% 92.6%
4 6.87 9.37 9.06 9.3% 90.7%
5 3.45 18.85 16.24 3.6% 96.4%
6 1.80 17.38 12.57 4.4% 95.6%
7 4.15 14.40 12.60 5.8% 94.2%
8 5.26 17.77 15.57 5.9% 94.1%
9 5.84 18.09 15.83 6.8% 93.2%
10 8.32 19.07 14.58 23.9% 76.1%
11 12.58 22.13 17.04 39.4% 60.6%
12 14.11 22.26 17.78 43.5% 56.5%
13 12.56 23.47 18.45 31.4% 68.6%
14 6.66 19.23 13.73 21.2% 78.8%
15 18.83 24.74 23.58 15.6% 84.4%
16 6.47 21.64 15.24 17.9% 82.1%
17 5.07 23.22 19.17 5.9% 94.1%
18 6.04 23.15 13.32 26.1% 73.9%
19 4.03 21.18 10.45 24.1% 75.9%
20 3.90 19.34 13.32 11.4% 88.6%
21 3.29 17.72 10.91 14.2% 85.8%
22 4.80 5.52 5.41 13.7% 86.3%
23 3.02 18.61 13.85 6.6% 93.4%
24 2.40 7.89 6.90 6.3% 93.7%
25 7.44 22.83 19.71 7.7% 92.3%
26 3.47 20.16 14.14 8.9% 91.1%
27 3.61 8.47 8.32 1.3% 98.7%
28 3.33 11.34 10.62 2.8% 97.2%
29 2.59 18.14 12.79 7.0% 93.0%
30 2.11 17.20 13.81 3.4% 96.6%
31 9.83 22.01 15.03 37.5% 62.5%
32 2.54 19.32 13.99 5.8% 94.2%
33 2.24 18.60 7.53 20.1% 79.9%
34 2.47 18.24 12.66 6.9% 93.1%
35 2.12 8.45 6.63 9.2% 90.8%
36 2.66 17.06 10.86 10.5% 89.5%
37 6.66 21.17 19.73 3.3% 96.7%
38 2.45 18.62 8.43 18.3% 81.7%
39 1.84 16.68 11.21 6.0% 94.0%
40 2.57 11.12 9.25 6.1% 93.9%
41 7.26 20.50 10.57 51.6% 48.4%
42 3.52 16.46 9.08 22.1% 77.9%
43 2.85 16.52 16.10 0.5% 99.5%
All SCTGs 4.95 16.11 12.82 11.4% 88.6%
(Source: Federal Highway Administration.)

In looking at the payloads in table 43 and table 44, commodities SCTG 4—Animal Feed and Products, SCTG 15—Coal, and SCTG 22—Fertilizer show SU payloads that are within 40 percent of the CU payloads. This can be attributed to several factors.

  • For SCTG 4—Animal Feed and Products, this is a time sensitive commodity, and while most commodities could wait until a truck became fully loaded, it possible that these goods are shipped in whatever equipment is available, either SU or CU trucks. In this case the "payload" computed is most probably a reflection of the shipment size, and not the capacity of CU trucks transporting this commodity. Record the information if the TPFs for CU trucks are ever used to assign only this commodity.
  • For SCTG 15—Coal, while typically an SU truck has a smaller payload than CU truck, according to VIUS of the survey records whose principal product carried is Coal, 81 percent of the Sus have a body type of dump truck, and 100 percent of the CUs are transported in dump trailers. It is probable that the payload of very large SU dump trucks is not appreciably different than the payload of CU trucks hauling dump trailers. This may be why the analysis based on VIUS shows that the payload for SU trucks is close to the payload for CU trucks for SCTG 15. Record the information if the TPFs for SU trucks are ever used to assign only this commodity.
  • For SCTG 22—Fertilizer, most of the CU survey records in VIUS are in trailers whose Principal Product is Powered or Unpowered tools, which do not contribute to the ton-miles reported for SCTG2 commodities. If a truck carries mixed commodities, as reported in VIUS, it cannot be determined if this is 25 percent of the contents of 100 percent of the trips, or 25 percent of the trips. It has been assumed that it is the latter in this analysis. If it is former, this will significantly understate the payload factors for SCTG 22 that are included shipped with Powered or Unpowered tools, since these uses do not contribute to the ton miles reported for SCTG2 commodities. This may be why the CU payload is so low for this commodity and record the information if the TPFs for CU trucks are ever used to assign only this commodity.

If used in isolation, caution is suggested when using VIUS payloads for these three SCTG2 commodities. If they are bundled with other commodities, as is shown in the next chapter, these issues are not apparent.

65 It is acknowledged that the average payload weight can be expected to vary by commodity, and even vary within commodities depending on whether they are carried with other commodities within the same truck. However, this is the only payload weight question that is asked of respondents and, as such, it is assumed that it is applicable for all conditions. [Return to footnote 65]