A Methodology and Case Study: Evaluating the Benefits and Costs of Implementing Automated Traffic Signal PerformanceAppendix A. Case StudiesGeorgia Department of TransportationGeorgia Department of Transportation (GDOT) operates and maintains approximately 6,800 traffic signals across the State, plus 200 ramp meters in the Atlanta metro area. Additionally, approximately 100 local agencies rely on GDOT to help operate and maintain their traffic signals. GDOT has seven districts across the State, each with its own traffic operations group, consisting of engineers and technicians to operate and maintain traffic signals. This is the largest deployment of traffic signals equipped with high-resolution data-collection capability. All GDOT traffic signal controllers log high-resolution data. Open-source software for automated traffic signal performance measures (ATSPM), developed by Utah Department of Transportation (UDOT), provides tools and reports for traffic signal monitoring. 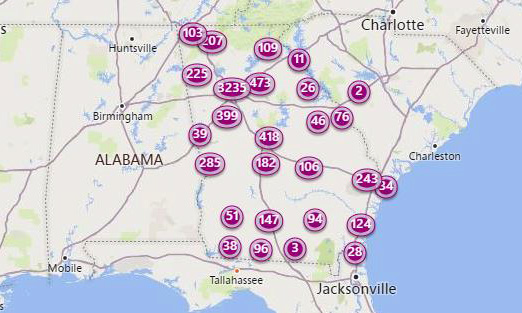
The figure shows a map of the State of Georgia with 27 circles superimposed above 27 cities and towns. Each circle shows the number of traffic signals in the associated city or town. The highest number, 3,235, is naturally shown above the city of Atlanta. The next highest number, 473, is located very close to Atlanta, directly to the East. The next highest number, 418, appears to be superimposed above the city of Macon in central Georgia. The next highest number, 399, is located very close to Atlanta, directly to the South. The next highest number, 285, appears to be superimposed above the city of Columbus on the western border. The next highest number, 243, appears to be superimposed above the city of Savannah near the Atlantic Ocean. The next highest numbers, 225 and 207, are located near the northwestern corner of the State. All other towns and cities are shown to have fewer than 200 traffic signals.
Figure 11. Map. Traffic signal quantities and locations in Georgia.Original map: © 2019 Microsoft® Bing™ Maps. Map overlay: Georgia Department of Transportation. GDOT has changed the way it manages traffic signals by using data and reports from the ATSPM system. It uses the ATSPM system to review data at a finite level (e.g., phase termination, coordination diagram, split monitor) to optimize operation and at an aggregated level (e.g., volume, split failures, progression) to track trends.
Business Processes and Signal Systems BenchmarkingGDOT manages a large number of its traffic signals via two main programs:
GDOT is considered an innovator with regard to the diffusion of innovation concept. Its system is robust, it knows where it wants to go, and it chooses to take on higher risks than other agencies. It is building upon what UDOT and Purdue University have started, and is trying to make it even better for the majority of agencies. GDOT has a high level of capability and maturity when it comes to operating and maintaining its signal system. The following is a summary of its capabilities in each of the categories:
Approach to ImplementationHistorically, GDOT has had strong support from management for traffic signal operations, starting more than 20 years ago with standardizing on a single software platform prior to the 1996 Summer Olympic Games. In 2013, GDOT participated in pooled fund study TPF-5(258) (INDOT, forthcoming), which led to creation of the high-resolution data enumerations and resulting ATSPMs. GDOT staff saw the benefit of using the high-resolution data to measure quality of service in its system and better manage traffic signal operations. In 2017, GDOT upgraded its local controllers and central traffic signal system and included requirements for local controllers to collect high-resolution data. The upgraded system would provide new tools to measure and monitor performance. The communication infrastructure was upgraded where necessary as the new controllers were deployed in the field. GDOT started using ATSPMs to remotely assess signal operations and troubleshoot issues before deploying staff to the field. Much of this is focused on detection maintenance. The data are useful to help determine what equipment, such as a bucket truck, may be needed for a field visit. ATSPMs also provided the tool to determine appropriate timing adjustments to reduce intersection delays when detection failures occurred. In recent years, GDOT has developed several documents to help it efficiently operate and maintain its signal system, including:
The first two documents are geared toward operating the traffic signals in Georgia. The last three documents are geared toward any agency that plans to install and use the ATSPM source code software. To support creation of the ATSPM reports, GDOT reviewed and updated the detection design standards to accommodate creation of the various metrics. Most intersections had appropriate vehicle detection needed to create the common performance metrics; however, not every intersection can collect data to produce every metric. GDOT's new vehicle detection standard layout (using radar) is used at all new installations. Configuring detection for each intersection to align with ATSPM requirements is time consuming on its own. It has become part of the GDOT business process and one of the tactics to operate and maintain their system. GDOT is well resourced from a staffing perspective, using both internal staff and consultant resources. Traffic control personnel were trusted by executive staff to direct investments in innovative technology, and the agency had adequate resources to carry out the implementation. It has been able to demonstrate an adequate return on that investment. A wide range of personnel use ATSPM data and reports, including GDOT engineers and technicians and supplemental consultant staff. There has been a paradigm shift in traffic signal operations and maintenance, with virtually all traffic signal staff using information provided by ATSPM data for one reason or another. GDOT's website analytics reveal more than 450 unique monthly users. The ATSPM website is public-facing, and GDOT believe some of this traffic comes from external users, such as consultants, other agencies curious about the system, or the general public, and not from users for specific operational purposes. In the draft TSMP, GDOT has identified the following 11 objectives for the traffic signal program:
These objectives are meant to guide the traffic signal program. On-street operational objectives are more specific; they are based on intersection/corridor context and used to determine the metric(s) GDOT monitors. The TSMP has a section devoted to measuring performance, divided into maintenance, design, and operations. Automated Traffic Signal Performance Measures UseGDOT is using ATSPMs for both day-to-day operations (proactive operations and maintenance) and project-specific tasks (corridor retiming). Day-to-Day OperationsPrior to implementing the ATSPM system, GDOT relied on phone calls and complaints as the trigger to dispatch staff to review operations in the field. Sometimes this resulted in 2 hours (h) of driving to observe intersection operations to troubleshoot the issue and possible additional time to fix the problem. Using ATSPM, it can review the intersection operation remotely (once the complaint is received) to do initial troubleshooting and send out staff with the appropriate resources. It is also able to discover problems before getting calls from the public by configuring the system to send real-time alerts and develop summaries that can be reviewed daily. Project SpecificThe approach to data collection for signal timing projects has moved away from manual methods. Before implementing the ATSPM system, GDOT engaged in a traditional signal retiming process, which happened every few years (based on available funds). This involved field data collection (sending out crew to collect traffic counts), building a Synchro model, and performing before-and-after travel time and delay studies. This model was for project-driven signal retiming, whereas day-to-day signal fine-tuning and adjustments were mostly triggered by complaints from the public. According to GDOT, the process of updating signal timings was done "slowly, manually, and with a lot of paperwork."1 Most of the evaluation was based on limited field data collection (1 day), including floating-car studies and manual observations, which had opportunities for unintentional (or perhaps intentional) bias and provided a small snapshot of performance. Many metrics were based on modeled or simulated results; for example, congestion mitigation and air quality improvement (CMAQ) projects requiring estimates of quantities such as emissions, speed and travel time, or number of stops. GDOT has started to use the ATSPM system for corridor signal timing. The biggest change is related to data collection. Turn movement counts now can be collected using high-resolution data from the traffic signal controller instead of manual counts. This not only saves money, but also provides the opportunity to review data from more than a single day. The other benefit of using ATSPMs for signal timing is using the volume and performance data to determine if and when signals timings need to be updated. This changes the process from a time-based event to a needs-based event. Performance measures for signal timing projects now focus on operational objectives related to the context (reduce delay, smooth flow, equitably serve green times, minimize phase failures), and is not solely the floating-car travel time survey. Most-Used MetricsThe following performance measures are the most frequently used, with the Purdue Phase Termination and Coordination Diagram the top-queried measures:
At present, GDOT primarily has used data from the ATSPM system for maintenance and operations, as opposed to communicating with decision makers or the public. Nevertheless, the data have allowed GDOT to "tell the story" about the results of its signal management efforts with greater confidence, since the data enable GDOT to verify the impact of the efforts. Benefits and CostsController Upgrade CostsGDOT recently chose a new local controller/software and central signal system to replace its legacy system. The new standard local controller is an adaptive traffic control (ATC) operating MAXTIME firmware. Part of the signal system upgrade project was to replace all legacy Type 170 and Type 2070 controllers with ATC controllers capable of collecting high-resolution data. Therefore, GDOT did not have a cost related to traffic signal controller upgrades, specific to ATSPM. Communications and Detection CostsExisting communication and detection systems at most intersections were adequate to provide high-resolution data back to the central and produce most ATSPM metrics. GDOT wants remote access to every traffic signal in the State and would need the communications infrastructure regardless of whether it was collecting ATSPM data. Therefore, no specific cost is associated with the communications network. The detection at each intersection was capable of providing inputs for efficient traffic signal operations, but may not have been configured for ATSPM metrics. GDOT included field verification of detector input wiring as part of the routine maintenance inspection and estimated that 20 percent of intersections needed detection reconfiguration (e.g., redefining detection zones in a noninvasive detection system). Three hours per intersection were estimated for this task at a labor rate of $50 per hour (h).2 Assuming $50/h × 3 h/signal × (0.2)*5,784 signals = $173,520. Additionally, GDOT estimated that configuring intersection detection in the ATSPM system (assigning the inputs) took about 30 minutes of staff time at $50/h for all 6,804 signals. Assuming $50/h × 0.5 h/signal × 5,784 signals = $144,600. These are both classified as deployment costs. Server and Software CostsGDOT leveraged existing efforts that allowed it to reduce overall implementation costs. GDOT recently upgraded and installed new servers to accommodate multiple applications for traffic operations, including the new central signal system. Server requirements for the ATSPM system did not call for additional equipment; therefore, the server and server maintenance were estimated to have no additional costs. These functions were already being undertaken by the agency's information technology (IT) staff and did not drastically change with implementation of ATSPM. As new data storage is desired, additional server space (or cloud service) may be added. GDOT is using open-source software developed by UDOT as the ATSPM system, which is free for agencies to download (no license costs). The cost to deploy the open-source software system was approximately $200,000 (consultants to configure and set up reports). GDOT estimates that about one quarter of a full-time employee's (or 500 h) is spent operating and maintaining the ATSPM system during a year. A labor cost of $50/h and a 10-year (yr) life cycle were assumed. As the open-source software is updated, it will be necessary for GDOT staff to update the version on the server. Some costs and benefit items are estimated for the 10-year life cycle. Assuming a discount rate of 5 percent, the (P|A) factor for determining net present value is 7.72. The present value of this 10-year cost is 500 × $50 × 7.72 = $193,000 (included in operation cost). Training and Usage CostsGDOT provides periodic training for traffic operations and maintenance staff (GDOT and consultants). There is specific training for ATSPM use, since it is a new topic/procedure and will be integrated into normal operations training in the future. GDOT estimated each ATSPM training costs $3,000 for a 2-hour session, plus staff time. The training is offered four times per year. The present value of this 10-year cost is 4 × $3,000 × 7.72 = $92,640 (included in operation cost). GDOT also had the three manuals listed above developed at a cost of approximately $75,000 (included in deployment cost). BenefitsFor this case study, only agency direct benefits were considered, such as reduction of staff time and resources, as this was the agency's the most readily available data. The benefits to the public (reduction in delay and stops) have not been estimated in this initial analysis. The benefits of ATSPMs can be observed for day-to-day operations and also for specific projects, such as corridor retiming or a special event. Before implementing ATSPM, GDOT relied on phone calls and complaints as the trigger to dispatch staff to review operations. Sometimes this resulted in 2 hours of driving to observe intersection operations to troubleshoot the issue and possible additional time to fix the problem. Now GDOT can review the intersection operation remotely to do initial troubleshooting and send out staff with the appropriate resources. It is also able to discover and appropriately address detection problems before getting a call from the public. GDOT estimates staff spent many more hours troubleshooting issues prior to ATSPM. For one program, it used to visit 1,500 intersections each month for field checks of detection. Now those detector checks are limited to locations where trouble tickets have been created or where the ATSPM system alerts there may be a problem. This has resulted in a 70 percent reduction in the number of locations that require field visits, and many of the issues can be resolved remotely. If each field visit takes 1 hour, with a labor rate of $50/hour, and the number of intersections is reduced by 1,050 × 12 = 12,600, the yearly benefit is $630,000. The present value of this 10-year cost is $630,000 × 7.72 = $4,863,600. GDOT estimated a savings of $600,000 in one district (across 17 signal timing projects) by using ATSPM data versus the traditional signal timing approach. The cost savings were due to reduced effort in field data collection, simulation, fine-tuning, and before-and-after comparison. These benefits were spread across numerous activities and were realized in a relatively short time after system implementation. The present value of this 10-year cost is $600,000 × 7.72 = $4,632,000. The benefits discussed above result in cost savings of $12,230,000/yr and represent just a small portion of the signal system. It should be noted that public benefits in terms of travel time savings or delay reductions have not been estimated in this case study. Lessons LearnedGDOT provides an excellent example of how executive support for agency operations is valuable for establishing a strong program. Georgia's ATSPM system was relatively easy to implement given the large scale of other programmatic improvements to the State's signal infrastructure, such as controllers, communications, and detection. Further, the State had a strong IT program that had already been undertaking numerous roles in managing systems requiring servers and other computing infrastructure, making it easy to include the new ATSPM system. GDOT participated in the pooled fund study and recognized the systemwide benefits that could be afforded at a relatively low cost. It documented the system goals and objectives and incorporated performance measurements into its normal processes. At the time GDOT was deploying ATSPM, it was making investments in communication, detection, and updated controllers as a matter of maintaining good condition of its signal infrastructure. Implementation of ATSPM built upon the existing system with minimal investment. The value of ATSPM includes providing data collection at a fraction of the cost of traditional methods, plus the ability to remotely troubleshoot operational issues before dispatching staff. GDOT is able to maintain a level of quality (on-street operations) more efficiently by using ATSPM data and reports. Measuring the benefit of using ATSPMs for day-to-day operations is difficult, since the tasks have been incorporated into the signal operations and maintenance process. There was no good, clear data on how much time and money were spent troubleshooting issues before implementing ATSPM to provide a comparison. Benefit-cost Methodology Application Tables
Utah Department of TransportationThe Utah Department of Transportation (UDOT) is one of the first agencies to implement ATSPMs systematically on a statewide basis. As one of the first agencies, it invested considerable resources to develop software that uses high-resolution data from traffic signal controllers to provide reports that help more efficiently manage and maintain the signal system. It has made the software available as an open-source release, saving this effort for others. It also has provided limited technical support to local agencies that have downloaded the UDOT source code software to use with their signal system. The agency rated itself at Level 4 in categories of performance measurement, organization and workforce, culture, and collaboration, and at Level 3 in categories of business processes and systems and technology. This rather high-level result is consistent with the proactive approach exhibited by UDOT in its signal management practices, and the leadership role it has fallen into. This leadership has included development of open-source ATSPM software and considerable outreach to other agencies and practitioners through numerous workshops, webinars, and other forums. In the diffusion of innovation theory, UDOT clearly exhibits characteristics of innovators with regard to its traffic signal practices. The development of the open-source software is the strongest evidence of this, but integration of that software with its business practices may be even more innovative. Indeed, usage of the technology and variety of practical examples UDOT has communicated to other practitioners has been important to the spread of ATSPM in traffic engineering practice. Approach to ImplementationUtah's involvement with ATSPMs began in 2011. UDOT Executive Director John Njord challenged the agency to figure out what would be needed for UDOT to establish "world-class traffic signal maintenance and operations" (UDOT 2011, ES-1). This question inspired the following further questions:
UDOT's signal operations staff found it did not have good answers to these questions, so they formed a Quality Improvement Team to look at its program in more detail. This team examined levels of funding, staffing, organizational structure, policies, and business practices, and came up with several recommended actions for UDOT that would make its system world-class. The following three recommendations had a particularly strong impact on the future of UDOT's signal operations:
At the 2012 Transportation Research Board Annual Meeting, the director of UDOT's Transportation Management System met with Darcy Bullock, from Purdue University, and Jim Sturdevant, from INDOT, who were beginning a pooled fund study to continue their work in developing performance measures for signal systems. Shortly after this meeting, UDOT began to develop a system to harvest high-resolution data from signal controllers and deliver performance measure graphics to users through a web interface. Ultimately, UDOT invested 12,000 person-hours to create that system, using existing in-house information technology (IT) resources. This investment has since paid dividends not only for UDOT in establishing ATSPM as a resource for the State DOT, local State agencies, and consultants, but also for numerous agencies across the US that have been able to implement the software through UDOT's open-source release. Additionally, several vendors have developed commercial ATSPM delivery systems that use the UDOT source code as the base. Although UDOT's development costs were relatively high, it faced a unique situation as the first agency to take on the task of implementing at a large scale. Other agencies have been able to benefit from UDOT's work, since they are generally able to avoid repeating UDOT's effort. UDOT's ATSPM program probably would not have been successful had it not been for the agency staff who became champions for the program. In UDOT's case, several individuals became closely involved in developing the open-source software. Two members of the engineering staff, who had both a hand in the process and roles managing signal operations for the State, would come to act not only as champions for UDOT's signal performance measure program, but for ATSPMs in general, leading numerous workshops and presenting several webinars. They were Mark Taylor, PE, PTOE, traffic signal operations engineer, and Jamie Mackey, PE, PTOE,3 statewide signal engineer. It is largely through their efforts, use of performance measures, and strong interest in understanding their impact, that most of the information in this document was originally developed. Bringing the System TogetherThe large investment Utah made to develop open-source ATSPM software was the critical component for implementation of performance measurement. The open-source software began from the foundation laid by INDOT and was brought to the level necessary to roll out ATSPMs statewide; the software has since been used by other State and local agencies, including some that have perhaps 3–4 times as many signals as Utah, thus demonstrating the system's ability to scale agencywide. This investment in the development of the open-source software would only have reached a small number of signals in the State if UDOT had not also been proactive in its communication and detection practices. For several years preceding the ATSPM effort, UDOT had prioritized establishment of communication to intelligent transportation systems (ITS) and signal assets throughout the State. It accomplished this by exchanging right-of-way access for communication links from telecommunications operators in the State. Between 2006 and 2015, the State's fiber network expanded from 731 miles (mi) (with 100 traded mi) to approximately 1,960 mi (with about 1,000 traded mi). As a result, the State had working communication to nearly all signalized intersections in the State. Similarly, the State's previous practices in its controller and detection system made UDOT well positioned to implement ATSPMs. The State had previously invested in upgrades to its controller inventory and had proactively maintained them with the newest firmware versions. Consequently, most of the controllers in the system were already capable of recording high-resolution data. In addition, the State had established uniform practices for its detection systems, and most intersections already were set up for ATSPMs, although in some cases detection zones in nonintrusive systems needed to be revised. For example, a desired revision in some places was to break apart large approach detection zones into smaller lane-by-lane zones. However, as noted by UDOT Traffic Signal Engineer Mark Taylor, in many presentations given on ATSPMs, even without fine-tuning detection zones, useful information can still be acquired out of high-resolution data. For example, the phase termination charts can be used to view the proportion of max-outs versus gap-outs, providing a basic view of phase utilization. Figure 12 shows the number of intersections in Utah for which certain metrics are available through UDOT's website. Metrics for Preemption Details, Pedestrian Delay, Split Monitor, and Purdue Phase Termination are available for all 2,029 intersections without detector mapping. The other metrics involve both detector mapping and certain detector types in some cases. For example, Purdue Coordination Diagram, Approach Delay, and Arrival on Red metrics all use setback detection data, while Approach Speed uses radar speed sensor data. Some of the metrics with lower numbers likely represent signals where detector mapping has not been entered, or where setback or radar speed detectors are not deployed. 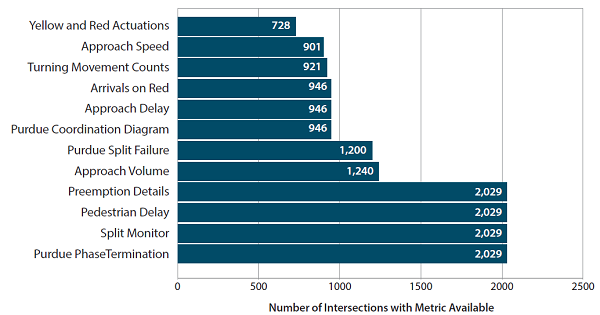
The bar chart graphically illustrates the number of traffic signals in Utah that offer each of the twelve signal performance metrics. Twelve performance metrics having twelve horizontal bars are listed along the y-axis. The x-axis is labeled "Number of Intersections with Metric Available". The total number of traffic signals in Utah is 2,029. Four out of the twelve signal performance metrics (i.e., preemption details, pedestrian delay, split monitor, Purdue phase termination) are available at all 2,029 signals. Approach volume is available at 1,240 signals. Purdue split failure is available at 1,200 signals. Three out of the twelve signal performance metrics (i.e., arrivals on red, approach delay, Purdue coordination diagram) are available at 946 signals. Turning movement counts are available at 921 signals. Approach speed is available at 901 signals. Yellow and red actuations are available at 728 signals.
Figure 12. Bar Chart. Performance measure availability (based on analysis of intersections with metrics available on the Utah Department of Transportation website on May 31, 2019).Source: FHWA Given that most of UDOT's intersections had compatible controllers, communication, and detection systems, once the ATSPM system was functional, intersections could be integrated into that system by providing information about detector mapping (i.e., assignment of detectors to phases) and other information such as controller IP address; internal interfaces were included in the ATSPM system to permit users to do so; these changes only affected the display of the performance measures, meaning that users could not reach the signal controller itself through the system. This separation of access enabled a secure web-based system (in that none of the actual control systems could be reached) and also promoted inclusion of multiple vendor products, which was a vital concern from the beginning of ATSPM research in Indiana. Integration of Automated Traffic Signal Performance Measures into Agency PracticesA vision statement of "traffic data for everyone" associated with ATSPMs has been reiterated in several presentations given by UDOT engineers. What it means is that the traditional approach of clustering agency personnel into task-oriented silos that rarely communicate with each other brings inefficiencies that can undermine an agency's purpose. A breakdown of individual performance measure usage for 2018 shows that turning movement counts and approach volumes have a combined usage rivaling the Purdue Phase Termination diagram. This indicates growing use by planners and consultants. Importantly, this breakdown of metrics usage reflects only the metrics delivered by the web front end. It does not include automated email alerts provided to technicians and others for maintenance uses. Institutionalization through UsageUDOT's position as the first agency to implement ATSPM statewide necessitated the involvement of many of its signal engineers during development, which made the engineers intimately familiar with the system's function. UDOT institutionalized ATSPMs among its engineering staff through usage. For its technicians, UDOT has training sessions approximately every 3 months. Other agencies and consultants in Utah would have likely learned of ATSPMs because of attention they have received in the past few years as a focus technology of the American Association of State Highway and Transportation Officials (AASHTO), the Every Day Counts program, and through UDOT workshops, technical meetings, and Train the Trainer sessions intended to enable participants to inform others. It remains to be seen whether using ATSPM will continue to be self-sustaining, but the high level of use is likely to promote this. New Methods of Managing Signal TimingThe availability of ATSPMs has completely transformed the way UDOT manages its signal timing. Figure 13 highlights the differences between the traditional and new process.
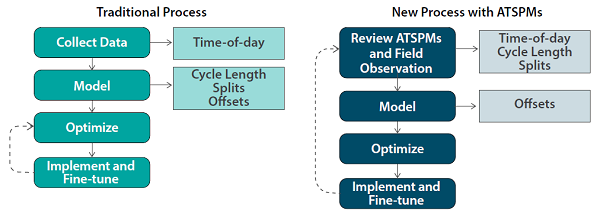
The figure contains two flowcharts side-by-side, from left to right. Both flowcharts illustrate a four-step process with step one on the top, step four at the bottom, and solid lines connecting all four steps. Both flowcharts contain modification steps illustrated as shapes to the right of steps one and two. On the left, the first flowchart is labeled "Traditional Process". Step one is "Collect Data". A modifier for step one is "Time-of-day". Step two is "Model". A modifier for step two is "Cycle Length, Splits, and Offsets". Step three is "Optimize". Step four is "Implement and Fine-tune". A dashed line flows back from step four to step three, to indicate that the process of optimizing, implementing, and fine-tuning may be iterative. On the right, the second flowchart is labeled "New Process with ATSPMs". Step one is "Review ATSPMs and Field Observation". A modifier for step one is "Time-of-day, Cycle Length, and Splits". Step two is "Model". A modifier for step two is "Offsets". Step three is "Optimize". Step four is "Implement and Fine-tune". A dashed line flows back from step four to step one, to indicate that the full process may be iterative.
Figure 13. Flowchart. Transformation from traditional signal timing to a new process enabled by automated traffic signal performance measures.Source: Jamie Mackey (Utah Department of Transportation) Improved Response to Public CallsPrior to ATSPMs, UDOT responded to every complaint call with a field visit. This was necessary because without any feedback from the system, UDOT simply would not know if a complaint call was valid. Further complicating matters, some reported problems were ambiguous about whether they were a signal timing or a detection issue—affecting the type of technician sent to the field. Sometimes, for example, a timing technician would be sent only to find the problem was related to detection, which meant that a different technician would have to make a site visit to resolve the problem. To avoid this, sometimes both a timing and a detection technician might be sent when the source of a problem was unclear. Another issue is that reports often were vague, which meant the technician might not be able to resolve the issue if the problem did not occur while the technician was on site or if it was unclear which approach or time of day the problem occurred. With ATSPMs, these practices have changed. When fielding calls from the public, the staff member speaking to the caller can retrieve information about the location and discuss the situation with the caller while triaging the problem. In many cases, a site visit can be avoided altogether. In approximately half of complaint calls, a work order is not generated because the problem can be remotely resolved, the reported observation reflects desired operation, or a situation that cannot be resolved through signal timing changes (such as saturation during rush hour conditions). In February 2019, for example, 226 public calls were received and only 137 work orders were generated as a result—compared to 226 work orders as would have been the case previously. When work orders are generated, much more specific information can be given to technicians about the type of problem, where it is occurring, and how it could likely be resolved. The number of wasted trips is thus reduced by targeting technician time and expertise to the problem. Automated Detector Anomaly DetectionAt present, the ATSPM system is proactively used for detector maintenance issues, thanks to an automated checking tool that identifies detection anomalies by analyzing the counts of events on a daily basis. Anomalies are based on a series of heuristics that look for detection channels with missing data, excessive max-outs and force-offs, and too many or too few pedestrian calls. If a new problem is found that was not previously reported, it will be communicated to maintenance staff through an automatically generated email. Using this tool, malfunctioning detectors are restored before public complaint calls come in; UDOT engineers estimate they may be able to see the problems about a month before a call might come in. Signal timing issues are still frequently identified through public complaint calls, but these calls can be much more efficiently addressed because the problems can be investigated with data before they are checked in the field. Benefits and CostsThe cost associated with development of the UDOT system can be extracted from the estimated 12,000 person-hours of development time. If a fully loaded labor cost of $84/h is used, this comes to approximately $1 million in labor costs. It is important to note this high level of investment is unique to UDOT as the original developer of a new software system. Further, the hours for this project were spent by staff already employed by UDOT, so this cost represents an allocation of existing resources that otherwise would have gone to other tasks. Considering there are 2,111 signals currently polling high-resolution data for ATSPMs, this investment comes to about $474 per signal. For an agency seeking to adopt the existing open-source software, a UDOT estimate of the potential costs are provided in table 13. The estimated cost per signal for ATSPM deployment (for the system itself, if not added field components) is $230–$400 per signal, with the lower values possible due to economies of scale in larger systems.
In Utah, most of the signals already had the necessary communication and detection systems in place, along with a controller with up-to-date firmware. Little information was obtained about costs of these investments, as these activities were undertaken as part of the regular program for maintaining functional signal systems in the State. UDOT engineers estimated that about 10 percent of one FTE was needed for maintaining the ATSPM system itself. In general, system maintenance needs are rather minimal; keeping the server functional is integrated into the regular duties of IT personnel and is not available as a separate cost item. What does require some effort is to maintain the detector mapping; this is a critical task because if detector assignments are changed, performance measures no longer accurately reflect conditions in the field. This can happen if a field technician forgets to enter the data after making such a change. According to UDOT engineers, a few hours a week of their time is dedicated to chasing down such problems. The automated system for detecting anomalies is useful for catching such errors. Table 14 shows an example calculation of effort over a 10-year period for the UDOT implementation. Because much of the State was ready for implementation, many of the line items represent system elements that did not have to be addressed, hence there are amounts of $0 in much of the table. For development of the system, 12,000 hours of developer time were estimated. A rate of $84/hour was used to calculate this total "installation cost" of $1,008,000. The numbers of hours used for software development, maintenance (management of detector configuration data), training, and use of the software (assumed 10 hours/week) were extracted from the interview with UDOT signal personnel. For maintenance of the system, it is assumed that 50 technician hours are applied per week, each week of the year, with an hourly rate of $58/hour, for a total cost of $150,800 per year. Using an interest rate of 5 percent, the net present value of the cost over a 10-year period is $1,164,176. Training activities are assumed to involve 48 person-hours in each session, with four sessions occurring per year. $86/hour is assumed for this activity, leading to an annual cost of 48 × 4 × $86 = $16,512. Over a 10-year period the net present value is $127,473. Finally, the cost to make use of the software is estimated based on the following assumptions. First it is assumed that 25 technicians make use of the software for about 10 hours per week on average, with a rate of $58 per hour, while 10 engineers make use of the software, also for 10 hours per week on average, with a rate of $86 per hour. The annual cost arising from these amounts is equal to (25 × 10 × 52 × $58) + (10 × 10 × 52 × $86) = $1,201,200 per year. The net present value over 10 years is $9,273,264. This represents the person-time involved in using the software, which could be offset by fewer hours spent for the same purposes by conventional means. Hourly rates used for effort in these calculations are based on average salaries in the state of Utah for computer programmers (for IT personnel), traffic engineers, and traffic signal technicians. An overhead rate of 150 percent was applied. Over a 10-month period from August, 2013, to May, 2014, UDOT tracked usage of the ATSPM system for assisting in signal system management. Every time a work order was generated, the system was checked in response to complaint calls, or performance measures were consulted in response to signal timing projects, a log entry was made. The log entries included 804 recorded uses, of which 436 originated from consultants and 368 from State and local governments (the vast majority being State government). There were 419 different intersections represented in the logs, or about 20 percent of the total number of signals in the State. Figure 14 presents a breakdown of the reported ATSPM uses from this 10-month period. When filling out a log entry, users could select multiple use cases. Some system users selected as many as nine different use cases, but the median was three. The breakdown of selected use cases indicates the system was used for many different needs in both maintaining signal timing and detection. Detection issues were present in 46 percent of recorded use cases, indicating it was one of the dominant uses. The log information also shows modeling as a prevalent use, in addition to numerous aspects of signal timing. 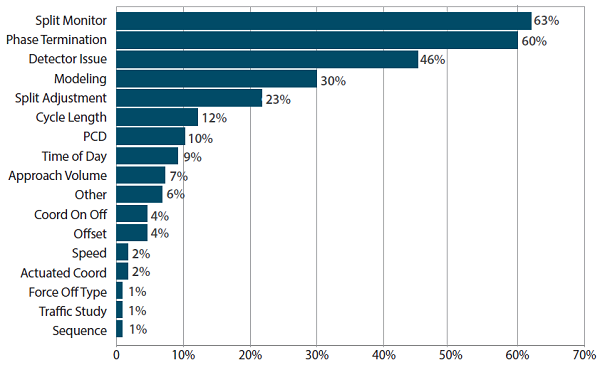
The bar chart graphically compares the popularity of 17 automated traffic signal performance measure use cases in Utah over a 10-month period. Seventeen use cases having seventeen horizontal bars are listed along the y-axis. The x-axis is labeled "Percentage of ATSPM Usage Logs Including this Use Case". The x-axis ranges from zero percent to 70 percent. The most popular use case is "Split Monitor" (63 percent). The second most popular use case is "Phase Termination" (60 percent). The third most popular use case is "Detector Issue" (46 percent). The fourth most popular use case is "Modeling" (30 percent). The fifth most popular use case is "Split Adjustment" (23 percent). The sixth most popular use case is "Cycle Length" (12 percent). The seventh most popular use case is "Purdue Coordination Diagram" (10 percent). The eighth most popular use case is "Time of Day" (9 percent). The ninth most popular use case is "Approach Volume" (7 percent). The tenth most popular use case is "Other" (6 percent). The next two most popular use cases are "Coordination On Off" and "Offset" (4 percent). The next two most popular use cases are "Actuated Coordination" and "Speed" (2 percent). The three least popular use cases are "Force Off Type", "Traffic Study", and "Sequence" (1 percent).
Source: FHWA Table 15 presents calculations of benefits yielded by implementation and use of ATSPM. The first four items represent cost savings to the agency.
The total cost reduction per year is therefore $3,486,464. Assuming a 5 percent interest rate, the net present value of this savings over 10 years is $26,915,502. For public benefits, UDOT had previously developed a very conservative estimate of public benefits, which assigned value to certain activities being taken by the agency such as fixing a broken detector or adjusting an offset. A similar analysis can be formed here:
The assumed values are rather conservative estimates, given that other studies have shown much larger benefits for both detection and timing changes, especially when those numbers are annualized. Nevertheless, even using these assumptions, a user benefit of $10.5 million per year in public benefits would result. The net present value over a 10-year period is $81,060,000. Of this, about $58 million is attributed to addressing broken detection. The total benefit including both agency savings and public benefit is approximately $108 million. Lessons Learned
Benefit-cost Methodology Application Tables
Pennsylvania Department of TransportationThe original intention for this case study was to cover Pennsylvania Department of Transportation (PennDOT) similar to the other ATSPM-deploying agencies. However, soon after an interview started with PennDOT, it was clear that PennDOT does not control any traffic signals, and its role is to only support other signal-controlling agencies (e.g., counties, townships, and cities). Based on inputs from the interview with PennDOT we reached out to Cranberry Township, which was identified by PennDOT as one of the leading traffic signal control agencies in the State of Pennsylvania. Cranberry Township is a township in Butler County, PA, near the crossroads of Interstate 76 (I–76) and Interstate 79 (I–79) (see figure 15). It is one of the fastest growing areas of the Pittsburgh metropolitan area, and its population is projected to grow from 28,098 in 2010 to around 50,000 by 2030. 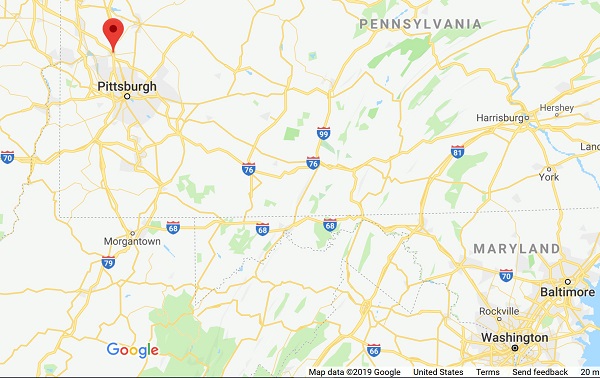
The figure is copyright Google. This regional map shows western Pennsylvania, western Maryland, northern Virginia, and northern West Virginia. The city of Harrisburg, Pennsylvania is shown and labeled in the upper right-hand quadrant of the map. The cities of Baltimore, Maryland and Washington DC are shown and labeled in the bottom right-hand quadrant of the map. The city of Morgantown, West Virginia is shown and labeled in the lower left-hand quadrant of the map. The city of Pittsburgh, Pennsylvania is shown and labeled in the upper left-hand quadrant of the map. A red pin is shown slightly to the north of Pittsburgh, indicating the location of Cranberry Township.
Figure 15. Map. Location of Cranberry Township.
The idea was to combine the two agencies in a single case study, with PennDOT assessed as a potential investor in the ATSPM technology and Cranberry Township seen as a beneficiary. However, this plan was slightly disturbed for two reasons. First, Cranberry Township does not yet have much to share because it is on the cusp of implementation. Second, it has never used the UDOT platform. Instead, Cranberry Township has used Econolite's commercial version of ATSPM technology, despite the fact that PennDOT provided a statewide license for Intelight's commercial ATSPM (as a part of a bigger package to cover arterial operations). Due to all of these inconsistencies, one could question the meaningfulness and benefits of this case study. However, we believe this case study can be an excellent compilation of lessons learned, as this situation reflects many similar regional cases (e.g., where central and local governments do not act in unison due to open-market provisions and various operational and political constraints). Such lessons can help identify research questions that in turn can help us propose a solution to improve the overall state-of-practice of signal monitoring and maintenance. Thus, we proceed with this case study by providing parallel inputs for each of the two agencies (PennDOT and Cranberry Township) whenever such inputs are relevant. Table 16 summarizes some of the relevant traffic signal characteristics for PennDOT and Cranberry Township, respectively.
Approach to Implementation (Pennsylvania Department of Transportation)PennDOT has a long history of studying and actively investing in traffic signals. A corridor modernization program started around 2012 that investigated PennDOT's ownership of traffic signals on critical corridors. PennDOT developed an implementation plan for traffic signals in 2013, which supported incorporating dedicated funding for traffic signals into the comprehensive transportation funding bill passed in November 2013 (commonly called Act 89). The funding stream in Act 89 led to development of the Green Light-Go program, which was originally set up with three elements:
The PennDOT project element has been mostly phased out due to Act 101 passing in 2016, which allowed more projects to be treated as local grants. The PennDOT management element is the part of the program that would include PennDOT ownership and/or operational control of signalized corridors. This part of the program required legislative changes to allow PennDOT to assume ownership of traffic signals. Act 101 included this provision when passed in 2016, which says PennDOT needs to do a pilot project and prepare a report for the legislature by 2022. PennDOT is currently working on a pilot on arterials parallel to I–76 in Montgomery County and Philadelphia. PennDOT is entering into agreements with each affected municipality that will culminate in an official transfer of ownership of all traffic signal equipment from the local municipality to PennDOT when all preconditions are met. All municipalities except Philadelphia have already signed the agreement. Regarding ATSPM, PennDOT was an active participant in the ATSPM pooled fund studies 1 and 2 that focused on enhancement of ATSPM. PennDOT started working on its own ATSPM implementation in 2016 when it modified an early version of the UDOT code. From that perspective, PennDOT could be considered an early adopter with regard to the diffusion of innovation theory. Approximately 13,600 signals exist across the State of Pennsylvania. However, only three are actually owned by PennDOT, while the others are owned and operated by local municipalities. PennDOT does review the signal design processes (provides permits) for traffic signals on its facilities, but it is local agencies' responsibility to operate and maintain the signals once installed. PennDOT has a signal unit in each of the 11 districts that varies between three and 10 staff per district (mostly focused on traffic signal design). It also collaborates after a signal design project is finished and turns on new approved signals, but that is where its involvement ends. Despite the fact that it does not own traffic signals, PennDOT wants to help local jurisdictions improve their signalized operations. The current level of maintenance of those municipal traffic signals is not very advanced. For this reason, PennDOT felt it is its place to assist local agencies with ATSPM implementation. PennDOT does not have consistent communication with signalized intersections, and there are few traffic controllers capable of logging high-resolution data. For example, PennDOT only has access to 100–200 signals with ATSPM data (mainly in the Philadelphia region). Most of those signals have controllers capable of ATSPM data collection at the time they were originally installed. There were some efforts in the Philadelphia region to build a fiber network between the regional district office and signals in the field. As a result, the district office has started helping local agencies monitor and operate their signals. These efforts have been supported by two consultants and one PennDOT staff within District 6 (Philadelphia region). PennDOT originally started with the ATSPM implementation of the UDOT open-source software. However, in 2015, PennDOT had issues with servers crashing when it implemented ATSPM at 100–200 traffic signals (all that were equipped at that time). In 2018, PennDOT obtained a statewide Intelight MAXVIEW license; the newer version of this software has the Utah source code software built into it and PennDOT uses it as an ATSPM platform. Despite these upgrades, ATSPM usage by PennDOT staff and consultants is minimal. Considering the lack of highly developed infrastructure with controllers, detection, or communications, PennDOT decided to leverage the data it was purchasing to support the 511 platform and its message boards. Along these lines, PennDOT worked with Purdue University to come up with performance data for arterials using these purchased data from INRIX. PennDOT was looking for ways to pull meaningful measures out of arterials for performance. PennDOT used a normalization process to normalize travel times based on length of the corridor. PennDOT applied this methodology using some corridors in the Philadelphia area. PennDOT later worked with University of Maryland to develop an analytic suite platform, which would allow flexibility to expand this software statewide. The platform has many features: it is used to monitor reliability of speed and travel times but also to do a before-and-after analysis of the performance of a corridor (e.g., after retiming, or when adaptive signals are installed). PennDOT does not currently have a way to track the number of users of this platform. Approach to Implementation (Cranberry Township)Cranberry Township is at the beginning stages of using ATSPMs. Cranberry Township is currently working on programming Econolite controllers for ATSPM use but it is having some administrative issues (details not given), which are expected to clear soon, and the system is supposed to be in operation in a month or two. In addition to regular use of the ATSPM features (for monitoring of signal operations), Cranberry Township will be the first agency in Pennsylvania to use ATSPMs to adaptively control its traffic signals. This will be achieved through Centracs® Edaptive system, which utilizes Purdue/UDOT ATSPMs to adjust signal timings accordingly. (Centracs® Edaptive is a new cloud-based adaptive signal control product from Econolite that optimizes cycle, offset, and splits using one-tenth of a second high-resolution data.) Cranberry Township has a total of 49 signals with ATSPMs that are mainly managed by Whitman Requardt & Associates Limited Liability Partnership (WRA LLP) at the traffic operations center. Out of those 49 signals, 18 signals on three corridors are under Centracs® adaptive traffic control (not based on ATSPM), whereas seven signals are tested under Centracs® Edaptive. Operationally, Cranberry Township is facing a constant growth in traffic demand. The township has a very unique mix of commercial and residential developments similar to a suburban environment. The area is becoming a traffic hub on the crossroads of I–76 and I–79, two major freeway routes in the northwest-southeast and north-south directions, respectively. These conditions, with multiple freeway interchanges in the township, create situations where the roadways often operate at or above their capacities. Staff-wise, Cranberry Township has a total of four technical staff. There is a professional-level operations engineer who manages traffic engineering and operations for Cranberry Township's public works. Another engineer manages traffic communications. There are also two other engineers who assist with Streets & Properties in Cranberry Township's Public Works division. Cranberry Township completed a capability maturity self-assessment offered on the Federal Highway Administration's (FHWA) website. While the detailed answers on the assessment questions are beyond the scope of this study, it is important to note that Cranberry Township staff assessed themselves as follows:
It should be noted here the above self-assessments are based on subjective opinions of agency staff who answered the survey questions, which may or may not reflect (as with any other agency) the true nature and quality of the components of the self-assessments. From that perspective, one could question Cranberry Township and any other agency's processes and measurements used to derive answers for this assessment. In each case it is important to illustrate how agencies define their signal programs, goals, and objectives, and how their operational strategies and tactics map to those goals and objectives. Although Cranberry Township's business processes for managing and operating traffic signals are focused on proactive operations versus reactive, it still has a long way to go to demonstrate its claims and illustrate exactly how its actions align with its intentions. However, there is no doubt that Cranberry Township staff continually seeks ways to improve business processes and which emerging technologies to adopt. Cranberry Township does not have a formal traffic signal management plan (TSMP), i.e., similar to the concept proposed and encouraged by FHWA (documenting operational objectives of the agency). The township only evaluates performance measures (PM) annually and uses them for grant applications. That being written, Cranberry Township is very proactive in how it monitors and maintains its signals; township crew members are in the field all the time performing either emergency or routine maintenance. Its operational objectives can be described as follows:
It should be noted here that some of these objectives (e.g., being proactive versus reactive) are not so much operational objectives as they are administrative objectives to ensure good customer service. It is also interesting to note that Cranberry Township has not capitalized on any ATSPM efforts made by PennDOT. PennDOT installed a server with UDOT open-source ATSPM code, but it moved away from that platform because it was too difficult to maintain, which is an indication of lacking workforce capability. Although PennDOT enabled a statewide ATSPM through Intelight MAXVIEW, Cranberry Township has not used this infrastructure or technical support from PennDOT. Collaboration between the two entities is excellent (e.g., the township got support from PennDOT to receive funding for the ATSPM project; the two entities have video- and data-sharing agreements in place). However, it simply has its own policies and priorities, and its activities are not always synchronized (like many other similar partnerships around the country). Business Processes and Signal Systems Benchmarking (Pennsylvania Department of Transportation)PennDOT has not developed a formal TSMP. However, such plans are anticipated to be established in the future; for now, it seems PennDOT closely follows initiatives and developments from the FHWA Resource Center, until its own plans are developed. Similarly, PennDOT could not identify three formal signal operations objectives. However, its three informal objectives are: ensuring safety (including pedestrians) by not delaying people so much that they are inclined to make unsafe decisions, providing equitable service (trying to make sure there are no split failures), and enabling smooth flows (high percentage of arrivals on green and good progression). It is important to note here that it does not seem that PennDOT has established any specific strategies to attain these objectives (or measure whether or not it is attaining them). As can be deduced from above—PennDOT uses ATSPMs to meet these operational objectives, but this is occasionally done by connecting some of the ATSPMs to each operational objective, and the process has not been institutionalized yet. PennDOT staff believes one of the obstacles (for broader ATSPM use) is lack of features to automatically identify problems and thus avoid the need to constantly monitor ATSPMs. In this way, the agency's resources would be more effectively used. The training component is also very important as new employees cannot easily start making decisions based on ATSPM data. PennDOT feels there is a need for a strong ATSPM training program to make it exponentially grow. Before ATSPM technology was available, PennDOT was using traditional means to optimize traffic signal operations. It would conduct manual traffic counts and run a Synchro model to obtain level of service (LOS) on a network under consideration. Floating-car studies were also used, but not frequently (it was not a standard practice). Even with ATSPM available, it is not regularly used to report signal performance to decision makers. One reason is because PennDOT's major focus is freeways. Also, structurally deficient bridges and other deteriorating infrastructure receive higher priority. PennDOT staff have a difficult time justifying investments in signals unless it can be proven that operations are on the verge of capacity or unsafe conditions. However, PennDOT does see the potential of controller-based data as a reporting tool, beyond just reporting to the signal operations group. PennDOT is looking to ATSPMs to help them "tell the story" by providing reliable measures that can be used to classify a segment of road as deficient in terms of operational condition, which somewhat explains its approach to using INRIX data. PennDOT staff likes that ATSPMs are currently calculated automatically and autonomously, but the results have to be interpreted by someone. It would help if problem identification (i.e., identifying specific sites and corridors) were automated; this would help reduce staff resources needed to use ATSPMs effectively. It seems that PennDOT belongs to a group of agencies hoping to use ATSPMs in the way adaptive traffic control works by delegating its objectives to an automated system. It also believes that to properly integrate ATSPMs in its business model, adequate training is needed. For this reason, ATSPM is one of the innovations being pursued by the State Transportation Innovation Council (STIC). One way PennDOT perceives using ATSPM is to integrate its performance measures in its system of evaluating operations of signalized arterials (and get away from LOS). Business Processes and Signal Systems Benchmarking (Cranberry Township)Cranberry Township takes care of maintenance of all of its traffic signals, which are connected to the township's traffic management center (TMC). Cranberry Township has a technician who is solely dedicated to perform traffic signal maintenance. Cranberry Township's main signal consultant (WRA LLP) takes care of analyzing signal data. Cranberry Township has not yet determined which PMs it will be using to meet its objectives. In addition, unlike PennDOT, Cranberry Township is not using any tools to measure travel times on their own (e.g., Bluetooth). However, the agency does use Streetlight data, access to South Pennsylvania Council travel time data, and PennDOT's interstate travel time data. Also, Cranberry Township has developed an algorithm that generates an advanced warning notifying them of events (e.g., crashes) that occur on interstate road segments in the township's boundaries. This algorithm helps estimate when adverse freeway traffic conditions may affect local roads. Since Cranberry Township gives an important role to proactive maintenance of traffic signals, the agency is institutionally ready to integrate performance measures from the ATSPM platform into its business model. This has been testified through some collaborative efforts with universities. For example, Cranberry Township has worked with Purdue University to turn on logging of highresolution data and share these data with the university. Given the agency has been active in keeping the existing infrastructure up to date, the cost of implementation (e.g., getting controllers up to date) has been assimilated by this proactive effort and has not been exclusively related to implementing ATSPMs. Benefits and CostsThere was no direct cost for the original ATSPM implementation, considering that PennDOT used in-house IT resources (time spent establishing the ATSPM platform was not tracked). In addition, a virtual server was used in the initial deployment approach to host the ATSPM open-source code from UDOT. For this reason there were no hardware purchases, either. Later when PennDOT switched to commercial ATSPM in Intelight's MAXVIEW, there were no costs for the ATSPM. Intelight claims the ATSPM module is free when MAXVIEW is purchased for other purposes, and thus no maintenance costs for MAXVIEW can be associated with ATSPM. Intelight staff also helps PennDOT with maintenance of the virtual server, which is located on PennDOT premises. On the other hand, PennDOT spent between $300,000 and $400,000 to develop the previously mentioned tool for monitoring probe speed and travel time data, and purchases such data from INRIX. INRIX data are used to obtain statewide traffic performance measures, understand reliability of speed and travel times, and compare before-and-after traffic conditions in the case of major interventions (e.g., signal retiming). Some ATSPM investments are helpful for basic signal operation as well. When it comes to costs for upgrading intersections, the major overlap between ATSPM and non-ATSPM operations is detection. PennDOT prefers nonintrusive technologies where it has flexibility to add more zones and move zones, which is not present in traditional inductive loop detection. For example, the detection cost specific to ATSPM may be as low as 0 (e.g., because an intersection is already equipped with detection prior to ATSPM implementation) or as high as $45,000 (e.g., detection specifically installed for ATSPM). PennDOT staff estimates it costs approximately $7,500 per approach to cover stop-bar detection on the side street for normal operations, not considering ATSPM. It would also have stop-bar detection for mainline exclusive left-turn phases (but not through lanes). Advanced detection is trickier to estimate as PennDOT has been using radar technology for dilemma zone detection, which is estimated to cost around $7,500 per mainline approach. So, a total of $45,000 per intersection is estimated for detection costs. From this number, costs attributed to ATSPM could be anywhere between 0 and $30,000. In general, Cranberry Township believes it has a very educated staff capable of doing most of the work in-house (e.g., programming and adjusting of detection zones), except for major installation projects. Cranberry Township is still not able to report on the costs of their system, which is somewhat contradictory with the level of institutional readiness to document business processes (level 4)—this will have to wait until after the test period. It is difficult to estimate how much of Econolite's support for Cranberry Township signals is directly related to ATSPM, and how much is related to regular signal operations. One thing is sure—Cranberry Township staff meets with the vendor almost weekly for various reasons, including its detection software, ATSPM module, and the adaptive traffic control systems. PennDOT has not been able to scale its system enough to be able to quantify the benefits. On the other hand, similar to other ATSPM users, it witnessed cases where a problem was detected before public complaints were received. For example, PennDOT staff were able to identify several stuck pedestrian push buttons. ATSPM was very instrumental in identifying such issues. In addition, Steve Gault helped a town when it was losing communications to a couple of intersections. This type of problem would have taken months to be identified if not for ATSPMs. Without ATSPM, it would have had to wait for someone to complain, with operations affected for weeks. With ATSPM, such problems are identified within a day. PennDOT also sees strong potential for achieving future benefits. One of the tracks is automating ATSPMs within adaptive traffic control (ATC). Some such systems already use the high-resolution data to inform the adaptive algorithms. It seems that some PennDOT districts jumped in blindly with ATC. One of PennDOT's goals regarding ATSPMs is to evaluate ATC performance. Considering the strong interest in ATC in PA, PennDOT believes some combination of ATC and ATSPM may produce a breakthrough. Similarly, there was an attempt to see how ATSPM could work with the signal phasing and timing (SPaT) messages, but this was done as a demonstration project. Signal controllers that support SPaT can usually support ATSPM. So the interests of connected and automated vehicles (CAV) and ATSPM advocates are aligned. On the executive level, PennDOT is very interested to test innovative technologies and become a pioneer in the CAV industry. While none of the benefits from ATSPM have yet been realized, the agency anticipates using ATSPMs to primarily make the signals as efficient as possible for drivers (improve mobility) and, secondarily, to use the data to report signal system conditions to decision makers (benefits and costs at small scale). Right now, Cranberry Township has high-resolution data and can create reports of the collected data, but does not have any ATSPMs tied to these data. The report is still very useful, as it provides data related to every cycle for every connected signal. This helps validate information when there is a complaint. Cranberry Township expects ATSPM will help avoid such complaint calls, which represent less than 25 percent of the daily efforts from Cranberry Township's customer service department. Answering such calls is not a big part of its job, but it is an important part of the job. Cranberry Township plans to start with ATSPMs on one corridor and then scale ATSPM use to the entire signal system after initial testing is done. Cranberry Township also expects ATSPMs will help it secure future grants for signal improvements by using quantitative ATSPM data to justify signal improvements. Cranberry Township also sees the value of using ATSPM to replace its current signal retiming efforts, which are usually done every 2 years. After such retiming efforts, Cranberry Township usually commits before-and-after delays studies by using the floating-car technique (usually done by a WRA consultant). Lessons LearnedBoth PennDOT and Cranberry Township could be considered as early adopters with regard to diffusion of innovation, but for various reasons they have not yet achieved much. While PennDOT's efforts are purely to strategically help various signal jurisdictions in the State (it does not control any signals), it seems its early efforts with the UDOT open-source system have not led to full success. Once the ATSPM platform (supported by PennDOT) has been replaced by a commercial Intelight MAXVIEW system, the operations have been stabilized but it is still uncertain how many agencies have truly capitalized on this opportunity. Cranberry Township has taken its own way with some early tests through Purdue University, followed by a fully commercial Econolite platform. In terms of system procurements, Cranberry Township went even one step ahead of many others—by deploying a commercial ATC based on ATSPM (Econolite Edaptive). However, neither ATSPM nor Edaptive has been fully utilized—they are procured and installed but still not used operationally. Thus, on one hand we can say both agencies are moving toward very successful ATSPM use. While PennDOT's investment in a statewide commercial Intelight license will certainly bring benefits in the future, Cranberry Township is probably only a few months away from concrete benefits of its ATSPM and Centracs® Edaptive deployments. However, at this point it is very difficult to assess any concrete benefits of these systems, and unfortunately neither agency kept good records of costs made to adopt and implement the ATSPM platforms. Benefit-cost Methodology Application TablesTable 18 below gives estimated benefits and costs of deploying ATSPM at Cranberry Township as the only agency (of the two covered in this case study) that is a primary benefactor and also an agency incurring costs of ATSPM installation, operations, and maintenance. Costs incurred by PennDOT are all for a greater good and cannot ever be justified by relevant benefits, as PennDOT does not control traffic signals in the field. One should also note that, given the early stage of ATSPM deployment in Cranberry Township, the benefit and cost estimates are quite speculative and based on the assumption that ATSPM-supportive infrastructure exists (e.g., detectors and communications) and only traffic controllers (100 for a hypothetical case of scalability) need to be reconfigured to enable ATSPM operations.
Maricopa County Department of TransportationMaricopa County, AZ, is the fifth populous county in the U.S., with a population of 4.4 million (larger than 24 States), an area of 9,224 square miles (mi2) (larger than four States), and several cities and towns with their own independent transportation operations. The Maricopa County Department of Transportation (MCDOT) operates and maintains roadways that are outside of municipalities in the county. Figure 16 shows a map of those roadways, illustrating how they are widely distributed across the county. 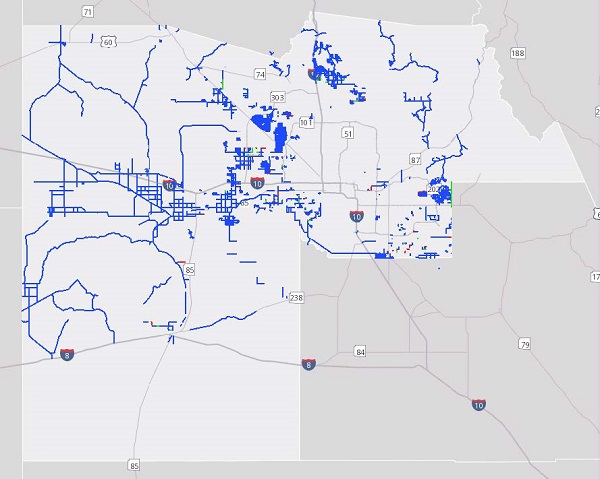
This regional map shows Maricopa County in central Arizona. Maricopa County contains the city of Phoenix. Maricopa County also contains large areas to the northeast, northwest, and southwest of Phoenix. Interstate 10 runs horizontally from east to west through the middle of Maricopa County. Interstate 8 runs horizontally from east to west through the southwest quadrant of Maricopa County. Local roadways maintained by Maricopa County are denoted with blue lines. Some of these local roadways are grid systems near Phoenix and its suburbs. Others are curved rural roadways further away from Phoenix.
Figure 16. Map. Roadways maintained by Maricopa County Department of Transportation.© Maricopa County Department of Transportation AZTech is a regional partnership among 24 member agencies across the Phoenix metropolitan area, including MCDOT, Arizona Department of Transportation (ADOT), and the Maricopa Association of Governments (MAG). AZTech was formed in 1996 as a federally sponsored Model Deployment Initiative, one of four experimental regional organizations for traffic operations in the U.S. For more than 20 years, AZTech has facilitated deployments of ITS technology in the region, including integrated TMC facilities, traffic monitoring and travel time measurement infrastructure, communications infrastructure, and ramp metering. In recent years, AZTech has published the Traffic Management and Operations Performance Indicators Book (AZTech 2015), which includes several performance measures of regional transportation system performance, including reports on peak travel times along several key arterial corridors. The AZTech ATSPM implementation is operated by MCDOT but is a cooperative effort with seven other transportation agencies: the cities of Tempe, Peoria, Gilbert, Scottsdale, Mesa, Phoenix, and ADOT. Of these, MCDOT has the largest number of signals currently reporting data in the ATSPM system: 117 of 170 total signals operated by the county. The other agencies each have between 10 and 108 signals online as part of a regional pilot, with expectations to expand to all signals in the pilot locations that have communications and to other regional agencies interested in participating in the AZTech ATSPM system; altogether, about 10 percent of the more than 3,000 total traffic signals across all agencies in the county are currently reporting data to the AZTech regional ATSPM system. MCDOT's signals are mainly in the outer limits of urban areas or in suburban or rural locations. MCDOT is one of the first agencies other than a State DOT to incorporate data from many different local agencies into one ATSPM system. In the diffusion of innovation theory, which describes how ideas or products gain acceptance, MCDOT has characteristics of both early adopter and early majority users. The effort to implement ATSPM was initiated by traffic operations management, who recognized the potential of the software and how it could benefit traffic signal operations and transform MCDOT's practices from reactive to proactive. At the same time, as the agency has worked to institutionalize ATSPMs, it has identified the need for more high-level metrics to allow for better use of the overall system. Developing answers to those needs is not a task MCDOT is likely to fill itself, but it is likely to implement such solutions as it emerges through continued development of ATSPM software by innovating users. An important characteristic that positioned MCDOT to implement ATSPM relatively easily is recognizing the need to keep the system and components up to date, and executive staff has supported these efforts. The ATSPM project was initiated while the county was investing in both adaptive signal control and new detection systems. In that effort, the agency worked with several vendors to identify specifications for detection systems that would support future adaptive systems deployment. At the time of this writing, procurements of those systems are in final stages. MCDOT's engineers saw ATSPM as a potentially valuable tool for evaluating these investments.
MCDOT's signal systems capability maturity self-assessment revealed the agency ranks itself at level 2 across most categories and level 4 in the area of collaboration. Although this self-ranking is rather modest, agencies that collaborate under the umbrella of AZTech have taken numerous steps that move toward a performance-driven approach to traffic operations. The agency has regularly tracked its performance using a performance dashboard, as published in its annual Traffic Management and Operations Performance Indicators Book (AZTech 2015), which examines highlevel metrics, such as percent of miles congested and peak-hour arterial travel times, while considering trends over time. It seems likely the addition of ATSPM will further increase this trend toward performance-based management to which these previous first steps lead. Approach to ImplementationIn 2017, AZTech collaborated with FHWA, the City of Phoenix, and ITS Arizona to host an ATSPM workshop, inviting agencies that had previously adopted the technology and vendors working on related commercial products, to share information with local traffic operations personnel. Interest in ATSPMs was sparked by AZTech Operations Committee members who had participated in a previous workshop in Utah. The AZTech ATSPM Regional Pilot Project was initiated later that year to make the technology available to traffic signal operators in the region. Ten signals from each participating agency were included in the project; this was followed by a second phase to expand the number of signals for MCDOT and the City of Tempe, bringing them to their current numbers. In the coming year, it is anticipated that existing pilot agencies will have the majority of their signals added into the ATSPM system, and agencies in the region wanting to participate will be integrated into the ATSPM system as well. While AZTech initiated the process of bringing ATSPMs to the region, MCDOT has taken on the role of leading development and maintenance of the system for the region. A version upgrade is anticipated to be completed in the upcoming year obtained through the ATSPM GitHub portal. Implementation of the AZTech ATSPM system was facilitated by the following particular factors:
Business Processes and Signal Systems BenchmarkingPrior to implementation of ATSPM, MCDOT and other agencies in Maricopa County had conventional retiming practices. MCDOT would undertake about three coordination projects per year; it tried to develop new base timing plans every 5 years and revisit coordination plans every 3 years. These studies would be typically assessed using floating-car studies and probe data from data sources like https://here.com (HERE 2019). In the future, it wants to eventually replace arbitrarily scheduled activities with triggers based on the data and use metrics from high-resolution data to assess the impact of retiming. Table 20 shows a comparison (Wire 2018) between conventional practice and ATSPMs, as presented by MCDOT Arterial Operations Program Manager April Wire, PE, PTOE.
One of MCDOT's immediate uses of ATSPM was to proactively identify detector failures using the email alert system in the UDOT open-source software. In addition, MCDOT is also able to validate problems reported by the public. Before ATSPMs, most of the time the agency was simply unaware of detector issues. Problems reported by the public often occurred at unusual times and could not be reproduced. For example, a citizen might call to report a problem such as not getting enough green time. MCDOT's approach to a call was to observe operations using CCTV, or send a technician to the field to examine the problem. However, once the technician arrived at the intersection, the problem was unlikely to recur during the site visit. Either a site visit or remote observation were limited to the time when agency staff could attend to the problem. With ATSPM, MCDOT staff can now validate whether such problems occur by monitoring conditions 24 h/day. Typical evidence of a detector problem is a phase maxing-out during every cycle during overnight hours, when demand is usually low. With the ability to view this performance, such problems can more easily be assessed. Further, by proactively scanning for such problems, it is possible to mitigate their impact before public complaint calls; and, field visits can often be avoided. Limiting field visits has been key in the success of the system at MCDOT, as staff time can be reprioritized to other competing priorities. Sometimes, adjustments to signal timing are often found to be necessary to resolve an operational issue that generated a call from the public. MCDOT has used ATSPMs to evaluate adjustments to splits and time-of-day (TOD) plan schedules. At present, the agency has not extensively used performance measures to assess progression, but that is anticipated as it continues to improve its detection systems to become capable of measuring vehicle arrivals. Evaluating the impacts of preemption by assessing the time spent during transition is another important use case it intends to explore in the future. An additional use of ATSPM strongly anticipated by MCDOT is the ability to establish a baseline to reflect its current performance and assess the impact of new technology, such as adaptive signal control and connected vehicle (CV) applications. The ability to monitor such changes is a core function of traffic signal systems that has not been available in most systems in the past. MCDOT has been able to monitor traffic conditions simultaneously with pilot tests of CV applications in the Anthem, AZ, SMARTDrive test bed. At present, applications related to preemption and priority control are being piloted in the test bed. So far, ATSPMs have not revealed significant changes in the daily signal operation. However, the data also show there is no disruption to the system caused by running these applications. As MCDOT has worked through implementing ATSPMs, they identified a few additional system needs that were not immediately apparent at the beginning:
User training and development of aggregate, high-level metrics are anticipated to help support future adoption of ATSPM technology in the region. Benefits and CostsAn important point for the context of MCDOT's implementation costs is that many signal infrastructure components were already in the process of being upgraded. The agency's regular practices prioritized keeping equipment up to date, but an ongoing project seeking to ready signal systems in the region for future technology had increased the agency's preparedness even further. Starting in 2013, an effort to implement adaptive signal control was initiated; the first stages of this process sought to identify system requirements, particularly that of detection systems. Deployment of new detection systems with simplified detector layouts was facilitated by this process, and was nearing completion as of 2019. As a result of these practices, most controllers had already been upgraded to models and firmware versions that could support high-resolution data collection prior to initiation of the ATSPM project. Therefore, no costs for controller deployment were necessary as part of ATSPM implementation. This finding is also observed in other early adopters, in that organizations that keep infrastructure up to date, usually by spreading out the costs over time, tend to be well-positioned to take advantage of new technologies. At the start of the implementation, MCDOT worked with consultants to inventory its intersections and analyze the level of readiness for each intersection in the system, using "levels" as defined below.
A countywide study was completed to identify the implementation plan for upgrading the detection to accommodate lane-by-lane detector layouts. In total, 38 locations were upgraded. On average, about 4 hours per intersection were needed to accomplish this task for each intersection. Because the detection plans had been standardized, no cost is associated with documentation of the detector layouts. The detection systems were supplied to the contractor for installation. The cost of new detection was about $250,000. Several other costs were also associated with this project, totaling about $765,000. These costs were considered to be sunk costs because these investments would have been made by the county for signal improvements independent of the ATSPM installation. Of the 170 signals operated by MCDOT, 122 signals (about 70 percent) already had communication via fiber, radio, or cellular modems. The remaining locations are mainly rural intersections beyond the reach of fiber networks. A few additional improvements to communication system were made during the course of readying the system for collecting high-resolution data. Similar to detection system upgrades, these costs were also considered as sunk costs not directly applicable to the benefit-cost analysis, because they represent system investments that would have been undertaken even if ATSPMs were not deployed. MCDOT uses the UDOT open-source system, so a software license was not required for the ATSPM implementation. The agency did not use the county's IT department to manage the software installation. MCDOT has a dedicated team as part of the ITS branch to manage and oversee the ITS communications network and other resources related to the TMC. The MCDOT team is supported by on-call consultants. The integration cost paid for consultant services was approximately $50,000. MCDOT incurred costs of $1,000 and $2,800 for its server hardware and software licenses. Some costs and benefit items are estimated for the 10-year life cycle. Assuming a discount rate of 5 percent, the (P|A) factor for determining net present value is 7.722. It has been less than 2 years since the Maricopa County ATSPM system pilot project was initiated, and during that time, many of the intersections were being upgraded to have new detection systems as part of a separate effort. So far, the performance measures are being actively used for a limited number of use cases, as mentioned earlier. Thus, only items 2 and 3 are listed in the table of benefits. The total benefit amount listed here is therefore probably greatly underestimated since not all of the different possible use cases are yet being realized, which is likely to change after the use of ATSPMs is expanded. Currently, MCDOT performs intersection counts once every 3 years at an estimated cost of $400 per intersection. Since there are 170 intersections, an average of 57 intersections per year are counted. The present value of this 10-year cost is 57 × $400 × 7.72 = $176,016. MCDOT currently performs four preventative maintenance visits per year at each intersection. It is assumed that these visits require 4 hours of labor, and that the use of automated alerts from the ATSPM system will enable the number of visits to be reduced from four to one. A rate of $55/hour is used for this calculation. A savings of 3 hours per intersection is assumed for 170 intersections. The present value of this savings is 4 × 3 × 170 × $55 × 7.72 = $866,184. A reduction in the response time for public complaint calls is identified as another potential benefit yielded under current uses of ATSPM by MCDOT. The number of calls received is estimated at 28 calls per month, or 336 per year; it is estimated that 4 hours can be saved in response time to each call through use of ATSPM. A rate of $55/hour is used for this calculation. The present value of this savings is 336 × 4 × $55 × 7.72 = $570,662. Finally, the operation cost for the use of ATSPM is estimated as requiring 20 hours per week at a rate of $55/hour. The net present value is 20 × 52 × $55 × 7.72 = $441,584. Lessons LearnedSimilar to other agencies that have served as case studies for this research, MCDOT benefited from a previous history of agency investments in traffic control infrastructure. In this case, Maricopa County had a regional partnership, AZTech. Led by MCDOT and ADOT, AZTech is a regional traffic management partnership in the Phoenix metropolitan area that guides application of ITS technologies for managing regional traffic. It carefully integrates individual traffic management strategies and technologies for the region's benefit while preserving operational control protocols important to individual jurisdictions. Not all ITS-focused organizations have strongly focused on traffic signals. Perhaps because of its large grid network, AZTech has included traffic signals and arterial operations in its repertoire of projects, alongside freeway-oriented efforts, to provide a seamless transportation system to the traveling public. In addition, over the years, MCDOT has made a commitment to keep its traffic control infrastructure up to date and functional. For the ATSPM project, specifically, detection needs were largely met through a parallel effort to make signals ready for deployment of other advanced technologies. The detection upgrade projects were sparked by the pilot implementation of ATSPM and management seeing the benefit of using a data-driven process for signal operations. While MCDOT has seen successes in early use of its ATSPM system, it has also discovered needs to support a transition to active management and operations: (1) the low level at which most metrics are reported (individual movements), (2) a need to orient performance measures toward specific tasks, and (3) a need for additional training to bring TMC operators and other signal operations staff up to speed on using the metrics. To overcome these, MCDOT appears to be waiting for further development of the open-source software by innovators to address the first two points (although it may explore solutions using its own consultants), and anticipates training activities and creation of documentation for the third point. As ATSPM implementation moves rightward along the adoption curve in the diffusion of innovation theory, such concerns will become increasingly important, as they reflect key needs of the industry: to package the performance measures into useful formats for system-level management for both managers and operators, and to equip staff with the knowledge necessary to use the performance measures to their fullest extent. Benefit-cost Methodology Application Tables
Lake County Department of TransportationLake County Department of Transportation (LCDOT) in Illinois is one of the most active local agencies in following the trends and opportunities of utilizing and applying automated traffic signal performance measures (ATSPMs) for traffic signal monitoring. However, it still has not fully deployed an ATSPM system of its own to gain substantial benefits and make a good case study for the others to follow. The LCDOT controls 180 signals, out of which 133 are currently under an ATSPM system. LCDOT uses the ATSPM, with effectively 1.5 FTEs, in daily operations for monitoring and tweaking of traffic signals. However, so far, the system has not been used to validate the major signal retiming projects although such a use of the ATSPM is planned for the near future. LCDOT is an excellent example of a relatively small agency with limited resources, which has been using its enthusiastic and resourceful staff to implement and utilize the ATSPM technology. LCDOT benefits from the fact that it has a suitable communication and detection infrastructure which makes application of the ATSPM and similar technologies a relatively easy process. Also, the management decision-making processes are quick and smooth which removes some of potential institutional barriers to implement the ATSPM and similar technologies. Lake County is located in the northeastern corner of Illinois along the shores of Lake Michigan (see figure 17 below). According to the 2010 census, it has a population of 703,462, which makes it the third populous county in Illinois. Also, Lake County is the second wealthiest county in Illinois, per capita income, and the 27th wealthiest county in the nation. These socio-economic characteristics of Lake County may have an important role in the county's ability to maintain proper road infrastructure and invest in ITS. The first ATSPM implementation in Lake County took place in November, 2017, under the leadership of the county traffic signal engineer, who was first exposed to ATSPM while working with the Wisconsin Department of Transportation (WisDOT). His enthusiasm for innovation and interest in improving signal operations were the major driving forces behind adopting the ATSPM in Lake County. The LCDOT staff plans to use ATSPMs for both day-to-day functions to proactively support operations and maintenance of traffic signals and for stand-alone signal retiming activities. While the former ATSPM use has already been in place, the latter ATSPM use has not yet been fully realized, but there are a few corridor retiming projects on the way, during which impact of the ATSPM will be thoroughly evaluated. 
This regional map shows several States in the Great Lakes area. The bottom half of the map has Illinois on the left, Indiana in the center, and Ohio on the right. The top half of the map has Wisconsin on the left, Michigan in the center, and Canada on the right. The city of Chicago is shown near the northeastern corner of Illinois. A red box is shown slightly to the north of Chicago, indicating the location of Lake County.
Figure 17. Map. Location of Lake County, Illinois.Source: © Google Maps™
LCDOT has access to a total of 740 signals, but only owns 180. The remaining signals are owned by either the Illinois Department of Transportation (IDOT) or local municipalities. These other signals can be monitored but not managed by LCDOT. Of those 740 signals, 602 can be accessed through Centracs® active traffic management system (ATMS) while only 202 are part of the joint ATSPM system. All 180 signals owned by LCDOT are remotely accessible, but only 133 are under ATSPM. LCDOT will replace the remaining 47 signalized intersections controllers (in summer 2019) to meet ATSPM requirements. The entire region (multiple jurisdictions) is expected to have around 300 signals under ATSPM by the end of 2019, as few planned projects will be completed by the end of 2019. When it comes to capability to generate relevant performance measures—all intersections under LCDOT jurisdiction have stop-bar detectors and are capable of reporting all PMs that are based on stop-bar detection. Similarly, most LCDOT-controlled intersections have advanced detectors. For example, out of 133 currently active ATSPM intersections (owned by LCDOT), 116 have advanced detectors on all (four) approaches, whereas 17 have advanced detection only on mainline approaches. Approximately 1.5 full-time employees (FTE) (all engineers) currently use ATSPM within LCDOT. This FTE value only denotes staff who are available to be fully utilized (if needed) on ATSPM. In practice this means that two LCDOT engineers use some of their time (information on this is provided later) to work with ATSPM. Data on ATSPM implementation costs, given in table 24 below, show the details on specific use of FTEs for ATSPM operations and maintenance. LCDOT expects the number of FTEs will grow after procurement of a commercially developed and maintained ATSPM system expected to become operational in the second half of 2019. LCDOT has a plan to train TMC operators to use ATSPM on a routine basis. This will increase the number of ATSPM-trained staff to four or five, as two TMC operators and a TMC manager are expected to acquire this knowledge. LCDOT completed a capability maturity self-assessment offered on the FHWA website. While the detailed answers on the assessment questions are beyond the scope of this study it is important to note that the LCDOT scored as follows:
More specifically, the following statements describe LCDOT operational conditions:
Approach to ImplementationThe overall approach to ATSPM implementation was not exactly planned ahead of time with the specific vision of what LCDOT wanted to achieve through ATSPM deployment, and how. Instead, as is probably the case with many small agencies with a similar institutional profile, the implementation decisions were driven by highly motivated and knowledgeable staff who were ready to try out the latest and greatest affordable techniques. It should be noted here that, like many other cases, the decision to deploy ATSPM was impacted by effective outreach activities supported by UDOT, Purdue University, and FHWA, among others. LCDOT is in the process of procuring a vendor-supported, commercial ATSPM system. It had a chance to pilot and configure the open-source UDOT system, which gave LCDOT a chance to test how the technology works and what benefits it could bring, and LCDOT realized there were enhancements it wanted to make to the software. Business Processes and Signal Systems BenchmarkingLCDOT's primary objectives for traffic signal management are very clearly stated but somewhat unorthodox. Its first objective is to optimize mobility, which according to LCDOT,4 means "being able to facilitate movement of emergency vehicles (EV), transit vehicles, and other higher-priority users by making traffic signals optimal and by equalizing signals' LOS with different weights for various users." Its other objectives are more traditionally defined: "reduce delay and travel time for commuters" and "reduce vehicular emissions." The LCDOT staff thinks ATSPM helps address the first objective by equally distributing right of way (ROW) through properly balanced green times. Success in attaining this objective is evaluated through split failure, split monitor, and similar performance measures (and relevant charts) for proper allocation of green times. For the second objective, reduction of travel times and delays, it is interesting that LCDOT staff does not identify any specific signal performance measures as a key assisting factor; it credits the entire process of using ATSPM. It believes the public benefits (in reduced travel times) from LCDOT's ability to proactively identify problems as opposed to reacting to issues based on citizen complaints. Regarding the third objective of reducing emissions, LCDOT staff is not yet sure how ATSPM can help. However, it recognizes that an increased percentage of arrivals on green provides smoother traffic flows and most likely reduces fuel consumption and emissions. Of all available ATSPM performance measures (and corresponding visual aids), the following four are most frequently used by LCDOT (in descending order):
Prior to implementing the UDOT source code ATSPM system, LCDOT staff primarily used a responsive approach where a signal (or detection) failure would only be acted upon after receiving a complaint call from the public. Such a call would trigger an action from an LCDOT signal engineer who would spend, on average, a couple of hours trying to identify the issue. Identification of the issue would be followed by contacting a maintenance contractor, who would dispatch a crew to the field to resolve the issue (this process would take, on average, around 4 hours of contractor time). After initial ATSPM implementation, the process changed as more of the issues could be proactively identified (before receiving complaint calls). For example, an engineer would observe a suspicious trend in the ATSPM (e.g., a phase is on a constant recall) and then investigate the cause, which would lead to identifying the problem (e.g., failed detector). Consequently, it is no longer necessary to wait for a driver to observe abnormal operation in the field and make a complaint call to the engineer, who then dispatches a contractor to the field to find and fix the issue. Such a proactive approach has reduced both the time needed to identify issues and number of events when the contractor has been called to intervene in the field. At this point these numbers are not easy to quantify but there is a plan to develop such functionalities with ATSPM in the future. Before deployment of ATSPM, LCDOT engaged in a traditional signal retiming process, which happened every few years (based on available funds) and involved collecting field data (sending out a crew to collect traffic counts), building a Synchro model, and performing before-and-after travel time and delay studies. This was a model for project-driven signal retiming, whereas day-to-day signal fine-tuning and adjustments were mostly triggered by complaints from the public. As a matter of fact, LCDOT has yet to employ ATSPM into the process regarding project-specific signal retiming. This is mostly due to limited funds for signal retiming projects. However, use of ATSPM for project-specific signal retiming is firmly planned for the near future. As a matter of fact, LCDOT is planning to use ATSPMs as part of the decision-making process for selecting new projects, as part of the County Highway Improvement Program Request (CHIPR). The goal of this program is to select signal retiming projects for the next 5 years. The county would like to use ATSPM as a partial scoring component for the project selection process. This would help to more efficiently prioritize projects based on need rather than a specific time interval. Currently, performance measures from the ATSPM system are not reported to anyone outside of the signal operations group but there are plans to do this once the new commercial ATSPM is operational; annual reports with key performance measures will be sent to the Lake County Board of the elected officials. Benefits and CostsLCDOT exclusively uses controller-based data collection (no auxiliary equipment to collect high-resolution data). Most controllers were hardware-ready for collection of high-resolution data but required a firmware upgrade. In total, LCDOT upgraded 116 out of 180 controllers (64 controllers already had correct firmware). The firmware licenses were free, but it was necessary to hire a crew of two people (one from a signal maintenance contractor and one from an electrical maintenance contractor) who spent approximately 30 minutes per intersection to complete the upgrade. This resulted in a total firmware upgrade cost of approximately $322 per intersection (approximately $155 for signal maintenance contractor and approximately $167 for the electrical contractor). It should be noted there are still 47 intersections that will soon be upgraded with brand new controllers. This purchase was based on replacing old controllers to enhance normal operations, not specifically for ATSPMs. These 47 signals already have necessary communication and detection infrastructure to support ATSPM. So, the total costs for firmware upgrades were: $322/intersection × 116 intersections = $37,352. LCDOT's signal network was already well equipped in terms of communication (mostly fiber) and detection infrastructure when the concept of deploying an ATSPM system was originally conceived. Thus, ATSPM installation benefited from a traffic signal infrastructure that already included many of the necessary components. This is indeed very fortunate considering the existing LCDOT programs and procedures do not justify installation of new communications and detectors solely for the purpose of enabling ATSPM functionalities. Thus, ATSPM installation did not incur any additional detection and communication costs. For detection system reconfiguration (e.g., redefining detection zones in a video detection system), LCDOT staff needed about 2.5 hours per intersection. This reconfiguration was needed for 131 out of 180 intersections, which are equipped with video detection systems. An exact labor rate (including benefits) of the LCDOT staff member (who did detection system reconfiguration) is $63/h. The total costs for detection system reconfiguration were: $63/hour × 2.5 hours/intersection × 131 intersections = $20,633 In addition to detection reconfiguration, the only other cost associated with ATSPM installation is purchasing Ethernet switches, which costs (including purchase, installation, and programming) around $5,000 per a switch. This is an important upgrade when the ATSPM is deployed on the 47 intersections with brand new controllers, which will cost, altogether, around $30,000. Server and server maintenance costs were not seen (by LCDOT) as significant costs of ATSPM deployment. As a matter of fact, LCDOT classified the cost of acquiring the server as free because LCDOT staff had just created a virtual machine (VM), using a licensed version of Microsoft® Windows Server® 2016, in an existing server. This VM sits on the host server with all the other VMs and servers. However, had it bought a new one, it would have cost around $15,000. Considering that all network hardware equipment is routinely replaced, we have estimated $15,000 (from a recent purchase of a server by another Lake County division) as a cost of purchasing server hardware when the ATSPM is installed and run locally. Licensing issues added complexity to the installation program. The original and existing versions of the software required no licensing costs, as the UDOT open-source software was used. However, LCDOT is currently in a procurement process to deploy a commercial version of the ATSPM software and hire a private contractor to maintain the software. A commercial version of the ATSPM will cost around (only an estimate at this point) $100,000 per year for 750 signals. Considering that only 180 of those 750 signals are under jurisdiction of LCDOT, LCDOT estimates that participation in the licensing costs of its future commercial ATSPM license is $24,000 per year. Applicable for UDOT's platform but not for a commercial platform (which is installed at LCDOT in meanwhile) are actual costs of installation. Installation of UDOT's open-source ATSPM software may require several days by highly technical staff familiar with programing and database management. In the past LCDOT participated in two installations of the UDOT source code ATSPM. The first version of the ATSPM (4.0.1) was installed exclusively with in-house resources. The traffic signal engineer at LCDOT invested around 200 hours (with an hourly rate of $63/per hour) in that process. In the next software upgrade (from 4.1.0 to 4.2.0) LCDOT hired an outside contractor to complete the upgrade. This upgrade incurred a cost of $52,173 and revealed several bugs in the software, which is one of the reasons why UDOT soon released version 4.2.1. So, the total installation costs for LCDOT reached: $63/hour × 200 hours + $52,173 = $64,774. When it comes to costs of routine server and database maintenance, this is not a big concern to LCDOT. Once the SQL database is up and running its storage is protected from overdrawing because of the implemented "delete commands." So far, the server has needed a couple of reboots. For the future commercial ATSPM system it is difficult to estimate installation costs, but LCDOT staff knows there will be separate expenses from monthly or annual subscription fees. LCDOT has not engaged in any formal training specifically related to ATSPMs, outside of its regular continuing education activities. Any ATSPM training primarily occurs during normal use of ATSPM when some of the practices and identified issues are informally discussed among LCDOT staff. Normal ATSPM use can be defined as a practice when ATSPM-proficient LCDOT staff spends approximately 2–6 h/wk using the ATSPM. These numbers are anticipated to increase once LCDOT engages TMC operators in daily usage and operations of ATSPM. Such involvement of TMC staff will require additional training provided by LCDOT staff familiar with the system. LCDOT estimates it will take approximately 100 hours to train future TMC operators who will be operating a commercial ATSPM on daily basis. Thus, the costs of training or integration are estimated as $63/hour × 100 hours = $6,300. When we summarize all these different costs in one total figure (see table 24 below), we get an estimated total cost of ~$300,000 for deploying and using the ATSPM in a 10-year cycle, assuming a discount rate of 5 percent (the [P|A] factor for determining net present value [NPV] is 7.722). Most of these costs are associated with active usage, installation, and maintenance of the ATSPM system. While these numbers may be significantly smaller than the costs incurred by one of the large DOTs, which significantly invested in the development of the ATSPM concept and system, they may be like the costs that many small agencies would experience when deploying an ATSPM system. Similarly, to some other case studies, we could not find a lot of information to quantify public benefits from the ATSPM deployed by LCDOT. However, it seems the key benefit is awareness of infrastructure and operations relative to goals and objectives. Such a benefit is not easy to quantify, and the major benefactor seems to be the public (driving population). For this reason, we mainly focused on direct agency benefits, although some overlap with public benefits exists. LCDOT staff are in the process of validating turning movement count data collected through ATSPM. There is a test intersection for which turning movement counts collected through historical methods are compared with observations from the pan-tilt-zoom (PTZ) cameras and the ATSPM platform. Considering that common stop-bar detectors are longer than optimal for counting cars, LCDOT staff had to create extra zones in its video detection software to ensure proper and fair comparison (already accounted as a detection configuration cost). Once the ATSPM turning counting methods are validated, LCDOT expects (based on its last signal coordination and timing [SCAT] project) an average traffic count savings of $2,600 per intersection. Thus, we estimate that potential benefits/savings from deploying ATSPM to automatically count data equals: $2,600/intersection × 180 intersections × 7.72 (NPV factor for using ATSPM for counting for the next 10 years) = $3,612,960. When it comes to using ATSPM to identify potential communication failures, LCDOT is not aware of any case when ATSPM was used to identify the communication failures. It has an asset management program, included with its active traffic management system (ATMS), that is used to detect communication failures across all the ITS devices. LCDOT has not completed any before-and-after studies (e.g., measuring delays or travel times) to provide an estimate of benefits to commuters by reducing travel times. However, there was an intersection case study at Illinois Route 22 (IL–22) and Kelsey Road where LCDOT was able to identify that the signal behaved oddly due to a travel time alert (Waze was used with 170 percent travel time threshold). The problem turned out to be a detection failure caused by a construction contractor who ground out a loop detector. LCDOT was able to reduce the maximum green time for that phase until the loops were replaced. Diagnosis of the failed detector was done in less than 10 minutes, which was a significant benefit to the public as travelers would experience unnecessary delay had the detector stayed in a malfunctioning state by putting a max recall into the signal. In general, such investigation of public complaints is one of the major benefits that LCDOT has observed while using ATSPM data. Since ATSPM was deployed, it has become normal practice for an engineer to talk with citizens and back up their responses using data provided by ATSPMs. Use of ATSPMs makes such conversations much easier because the engineer's responses are backed by data and the engineers are better prepared for such conversations. LCDOT has used the split logs and preemption logs to determine if operations of a specific signal were due to a one-time event (EV or pedestrian call) or an ongoing issue. They can also use these data to explain traffic signal operations to the citizen who called with a complaint. While these benefits are difficult to precisely capture we estimate that LCDOT saves around 2 hours of engineers' time and around 4 hours of field crew's time per week. When these savings are accumulated for a period of 10 years their NPV value comes to: ($63/hour × 2 hours + $243 × 4 hours) × 52 weeks × 7.72 = $440,781. From the safety perspective, LCDOT has not identified ways to use ATSPM data to understand crash patterns and relationships with signalized operations. A barrier to accomplishing this is that the crash data reside with IDOT and are not frequently and timely shared with Lake County. LCDOT has recognized a potential for reduced maintenance effort with use of ATSPM. LCDOT hires a maintenance contractor to take care of regular traffic signal maintenance and troubleshooting tasks. Thus, it would be logical to expect the number of troubleshooting calls and resulting maintenance costs to be reduced. However, at this point it is difficult to estimate how much benefit can be achieved from avoided maintenance because of ATSPM. Currently, LCDOT's maintenance contracts are competitively bid through the plans, specifications, and estimate (PS&E) process. Thus, it is difficult to quantify the difference between maintenance activity before and after the ATSPM implementation. The lump sum fee per intersection is based on multiple variables, of which most could not be solved with ATSPM (i.e., signal flash, video detection malfunction, ITS equipment malfunction). LCDOT sees the biggest benefit of maintenance-related use of ATSPM in early identification of detection and signal issues. Such early problem identification reduces a potential delay to which drivers are exposed. After entering in all of the estimated LCDOT benefits, we came up (see table 25 below) with a total benefit, over a 10-year life cycle, of around $4.05 million NPV. These benefits mainly come from the savings on not hiring traffic data collection contractors to collect traffic counts in the field, and from reduced contractor's and LCDOT staff's time involved in resolution of the signal and detector issues. It should be noted, again, that, in this case, the benefits do not include any direct benefits to the public which are arguably much larger than those experienced by the agency itself. Lessons LearnedLCDOT is an excellent example of a relatively small agency with limited resources that has been using its enthusiastic and resourceful staff to implement and utilize ATSPM technology. LCDOT benefits from the fact that it has a suitable communication and detection infrastructure, which makes application of ATSPM and similar technologies a relatively easy process. Also, the management decision-making processes are quick and smooth, which removes some of the potential institutional barriers to implement ATSPM and similar technologies. LCDOT has still not made full use of ATSPM capabilities, since it was in the process of procuring a vendor-supplied ATSPM system at the time of this case study. It was quick to realize the benefits laid in integrating ATSPM in daily operations of TMC staff and educating TMC staff to proficiently use ATSPM functionalities. While TMC education and ATSPM technology transfer have not yet happened, it is evident that LCDOT staff have a clear plan for how to accomplish these tasks. Moreover, LCDOT staff realized that using ATSPM has two components: maintenance of the system hardware and software and practical use of ATSPM functionalities for a routine daily activity. While the latter process is determined for the in-house staff of future TMC operators, the former tasks will be assigned to an outside contractor who will support system hardware and software maintenance. It is expected that this type of labor division will ensure ATSPM operations are sustained over a long period of time and usage of ATSPM reaches its full potential in the next few years. Finally, instead of just soliciting a request for proposal (RFP) that will ask vendors to support existing ATSPM features (prescribed by the standards of the open-source code developed by UDOT), LCDOT staff took a proactive role to challenge potential vendors to propose and implement new functionalities that will address some of the specific objectives of LCDOT's signal operations. In this way, LCDOT has shown leadership in trying to push the boundaries of what can be achieved with the future version of ATSPM as opposed to just requesting to replace existing open-source functionalities with a commercially packaged product. In summary, the case of LCDOT shows how a small, well-staffed, and educated agency with good infrastructure has the potential to become a leader in ATSPM implementation and achieve relatively significant potential for future benefits. Benefit-cost Methodology Application Tables
† Future costs based on a quote (specific to LCDOT). ‡ Hypothetical costs, fairly estimated based on a relevant comparable cost (LCDOT did not have such a cost, but many other agencies would). § Projected costs for future based on a sample of incurred costs.
Clark County, WashingtonClark County, Washington, owns, operates, and maintains approximately 100 traffic signals (mix of rural and urban intersections). Clark County is located in southwestern Washington across the Columbia River from Portland, Oregon. It also operates and maintains approximately 25 traffic signals for three small agencies and the Washington Department of Transportation (WSDOT). The local and central signal system is Trafficware. Clark County signals operate in a variety of control modes, including free, time of day coordinated, traffic responsive, and traffic adaptive. It is still figuring out what the right values of the different performance measures are, so it can focus its resources in the best possible way. It should be noted that the City of Vancouver (located in Clark County) operates and manages all of its signals connected to a separate Trafficware central system. The two Trafficware systems are currently not integrated. Clark County can be considered an early adopter with regard to diffusion of innovation. Its system is robust, it knows where it wants to go, and it chooses to take on higher risk than other agencies. It has innovator tendencies, however, when it comes to ATSPM. It is building upon what UDOT, GDOT, and Purdue University have started, and is trying to make it even better for itself and other agencies. Clark County has been upgrading its traffic signal hardware and software over the past 10 years with a goal of providing good basic service to the traveling public. It has the equipment in place to collect high-resolution data from the controllers and worked with the central system vendor to develop performance measure reports in the same platform. This made ATSPM deployment straightforward and cost effective. ATSPMs are just one tool it uses to manage the signal system. Its next steps include answering the question of what the right values are for each metric and creating automatic notifications when the values are out of range.
Approach to ImplementationClark County learned of ATSPMs through a variety of Institute of Transportation Engineers (ITE) papers and presentations. It attended the ATSPM workshop hosted by UDOT in January 2016. Prior to using ATSPMs and high-resolution data to create reports, the county used logs and reports available in ATMS.now as a tool to operate and manage its signal system. In doing so, it realized how important good detection was for local intersection operations, and how important good communication was for remote monitoring. The county also installed a Bluetooth sensor system to collect and track travel time along different corridors. Bluetooth sensors were installed at 55 intersections, and multiple routes can be created to measure travel time. In 2013, it began working with Trafficware and the local vendor to develop a software application. This application would use high-resolution data to create reports, similar to what UDOT developed. In 2014, Clark County asked Trafficware to create five reports so it could monitor the operations based on its operational objectives. The reports include:
Clark County began collecting high-resolution data at six intersections in 2015. Attending the 2016 workshop at UDOT reinforced confidence that ATSPMs would be a game changer in the signal operations field. It continues to work with Trafficware to deploy ATSPMs at all of its signals and identify enhancements to the base source code. Implementing ATSPMs was relatively straightforward because the county had new controllers, robust detection, and good communications in place. These upgrades happened over many years of capital projects aimed at improving signal operations (after decades of neglect). The only ATSPM-specific improvement needed was to install an advanced central processing unit (CPU) in the controller, which would enable collection of high-resolution data. Almost all traffic signals in the county now collect high-resolution data, which is stored in the cloud. The county's signal design standards support the ATSPM system with regard to detection layout, controllers, and communications. Clark County developed a concept of operations (ConOps) to document signal performance measures. The ConOps documents operational needs (intersection and corridor level), lists multiple performance metrics and their applications, and includes several operational scenarios for how Clark County can use the data. Business Processes and Signal Systems BenchmarkingClark County completed a capability maturity self-assessment offered on the FHWA website. While the detailed answers on the assessment questions are beyond the scope of this study, it is important to note that Clark County assessed itself as follows:
It should be noted here that the above self-assessments are based on subjective opinions of agency staff who answered the survey questions, which may or may not reflect (as with any other agency) the true nature and quality of the components of the self-assessments. Clark County's business processes for managing its signal systems are focused on proactive operations versus reactive. It is continually looking at ways to improve process, especially to reduce the burden of reviewing data produced by ATSPMs. The main signal operation goals are:
The operational objective(s) of a particular intersection or corridor are based on the context (time of day, land use, geometry, etc.) in order to meet the goals. The county developed corridor atlases, which include a map of a corridor (or group of signals) along with operational issues, and what the signal operations should accomplish. It uses these as a guide when developing timings and responding to complaints. The county uses ATSPM on a regular basis, albeit in ways that are more ad hoc than programmatic. The measures they use most often include:
IssuesWhile the county was implementing ATSPMs, an issue arose related to atypical phasing at intersections operating flashing yellow arrow (FYA) for protected/permissive phases. The county programmed the intersections with FYA in a unique way to disallow FYA to be active with the opposing pedestrian phase. The base source code did not recognize this phasing and therefore was not able to produce appropriate reports. A new version of local firmware was developed with enhancements to the FYA operations, and the county is in the process of deploying it. FYA intersections will then be reconfigured in the ATSPM system. After implementing ATSPM, the county realized the systems provided a lot of data. It is difficult to know what to do with all the data, determine when the data are abnormal, and focus on the most important locations and metrics. The county would also like to understand which metric is the right metric for a specific intersection—for example, at ramp terminals, the side street delay (which could lead to queuing) is more important than mainline progression. It has a general concept of what triggers (abnormal operations) for what context would be useful, and will work to fine-tune this once it has ATSPMs enabled at all intersections. It would also like to create a baseline, such as arrival on green at a specific location during the morning (a.m.) peak, so it knows what values to focus on. Clark County will use ATSPMs for both day-to-day operations (proactive operations/ maintenance) and project specific tasks (corridor retiming). Prior to implementation of ATSPMs, the county relied on phone calls and complaints and then had to dispatch staff to review the operations (sometimes this would result in 2 hours of driving to observe the intersection operations). Using split logs and reports from Trafficware, it can review intersection operation remotely to do initial troubleshooting and send out staff with the appropriate resources. It is also able to discover problems with detection prior to getting a call from the public. Once the ATSPM system is fully operational, its goal is to produce daily reports that summarize problem locations so staff can address the issues. It also envisions the system sending alerts when metrics are outside of a typical range (given the context). Similar to GDOT,5 prior to the implementation of ATSPMs, the process of evaluating signal operations was done "slowly, manually, and with a lot of paperwork." Most of the evaluation was based on limited field data collection, including floating-car studies and manual observations. These methods had opportunities for unintentional (or perhaps intentional) bias and provided a small snapshot performance. Many of the metrics were based on modeled or simulated results such as number of stops, delay, and fuel. Clark County recently implemented SynchroGreen adaptive signal operations at 28 intersections (three corridors). It will use ATSPMs to evaluate and fine-tune the operations. It will use various performance metrics to evaluate operations across time periods, such as travel time, arrival on green, split times, and split failure. In summary, Clark County feels that ATSPM is a valuable tool that helps to efficiently operate and maintain signals. It also feels there is room for improvement, especially in the automated component of the system. It has invested time and money to push innovation of ATSPM further and feels there will be a positive return on investment. Benefits and CostsIt is difficult to distinguish the infrastructure costs associated with ATSPMs from the general traffic signal system. The controller, detection, and communications needed for ATSPMs are also used by the general traffic signal system to provide good basic operational service. Clark County has been heavily investing in its signal system after many years of inattention and change in technical staff. It has installed Type 2070 controllers, installed new detection, and upgraded the communications infrastructure, using funds from several capital projects aimed at improving signal operations. It was able to leverage the existing hardware and, therefore, all of its signals were set up to easily deploy ATSPMs. The only ATSPM-specific improvement needed was to install a 1-C CPU in the controller, which would enable collection of high-resolution data. This is classified as a deployment cost. The cost of a 1-C CPU is about $1,300 per unit, based on a recent quote. The time required to install the 1-C CPU was 20–30 minutes. A labor rate of $65/h6 was assumed. Assuming $1,300 /1-C CPU × 125 signals = $162,500 and $65/hr × 0.5 h/signal × 125 signals = $4,062.50. The county found that firmware upgrades on a 1-C CPU take about 1 minute, compared to 20–30 minutes for a 1-B or 1-E CPU. This has proved to be an unexpected large return on investment. As a note: a new controller capable of collecting high-resolution data is about $500 more than the Type 2070 controller that does not collect the high-resolution data. The costs of communication and detection system development were not available, since such investments were made over many years preceding the implementation of ATSPM, making it difficult to determine a value. For detection system reconfiguration (e.g., redefining detection zones in a non-invasive detection system), about 2 hours per intersection was assumed to be needed for this task. This is classified as a deployment cost. Most intersections did not require any reconfiguration, so 10 percent of intersections were assumed to need this. A labor rate of $65/hour was assumed. Assuming $65/h × 2 h/signal × (0.1)*125 signals = $1,625. Documentation of the detection system and entry of metadata into the ATSPM system were estimated to require about 15 minutes per intersection, as the interface makes this straightforward. This is classified as a deployment cost. This task was assumed to be needed for all 125 intersections, with a labor rate of $65/hour assumed. Assuming $65/h × 0.25 h/signal × 125 signals = $2,031. Clark County uses the Trafficware ATSPM system, a cloud solution, which costs $200 per signal per year (above and beyond the cost for ATMS.now and SynchroGreen). It also has an in-house server used for the ATMS.now central system. The long-term vision for Trafficware is to host everything in the cloud, which will have a fee associated with it, but county staff will no longer need to provide server and system maintenance. Clark County invested $50,000 in seed money to Trafficware to develop the ATSPM software (enhancements over the base source code) that could run specific reports. The county also invested approximately $150,000 in consultant help to identify the appropriate measures of effectiveness (MOE) on each corridor, plus critical factors that impact them. These are both classified as deployment costs. A signal performance measures ConOps and an MOE framework were developed, and potential graphics and dashboards were created to display the MOEs for further enhancements. The largest item in the cost estimation is the cost of usage, representing the amount of time that agency staff make use of the system. This represents the other side of the cost reduction items described under benefits. This is classified as an operation cost. The staff currently use the data on an as-needed basis. The level of effort is estimated as 5 percent of the total labor of an FTE, across nine personnel (900 hours/year), over a 10-year period. It is expected this may go up when a more formalized program is developed, and when the SynchroGreen adaptive system is deployed. A labor cost of $65/hour was estimated. Some cost and benefit items are estimated for the 10-year life cycle. Assuming a discount rate of 5 percent, the (P|A) factor for determining net present value is 7.72. The present value of this 10-year cost is 900 × $65 × 7.72 = $469,685. For this case study, it was difficult to quantify the direct agency benefits. This is because the agency is still building up to full deployment. It previously used logs and reports from ATMS.now to help review operations and troubleshoot issues. The ATSPM system is another tool it is able to use, and not necessarily a wholesale different way of operating. In the future, it expects to see additional benefits with the creation of daily summaries, triggers, and alerts. This will allow staff to focus on issues and solutions without having to wade through all the data. Benefits to the public have not been estimated in this initial analysis. The county expects to see benefits during the deployment of the adaptive signal system. These benefits include reduced staff time to evaluate and fine-tune the system. Instead of spending weeks or months in the field to observe operations, it will be able to review split logs and percent arrival on green, and make adjustments based on real-time data. The county's maintenance costs have significantly decreased due to all of the recently completed system upgrades. It has used alarms and TS2 detector diagnostics for 10 years to determine where problems exist and need to be fixed. ATSPMs will help them to know the system is working (flagging values outside the norm), as opposed to finding problems. For this case study, no maintenance benefit is assumed. Lessons LearnedClark County has been upgrading its signal system for the past 10 years, after many years of neglect. One big lesson learned is that investments in the traffic signal system to optimize intersection operation (controller, detection, communication) made ATSPM deployment straightforward and low cost. A second lesson learned is that large data quantities aren't valuable if you don't know what to do with them. It is difficult to know what to do with all the data, determine when the data are abnormal, and focus on the most important locations and metrics. There is also a benefit to understanding which metric is the right metric for a specific intersection—for example, at ramp terminals, the side street delay (which could lead to queuing) is more important than mainline progression. Clark County has a general concept of what triggers (abnormal operations) in what contexts would be useful, and will fine-tune this once ATSPMs are enabled at all intersections. It would also like to create a baseline, such as arrival on green at a specific location during the a.m. peak, so it knows what values to focus on. The county has invested in developing an MOE framework for each corridor to determine the most important metrics given the context. They created corridor atlases to document operational issues and objectives at each intersection. In this manner, when new timings are developed or complaints responded to, there is a common understanding. Focusing on the appropriate metric (data) results in effective use of staff time. Benefit-cost Methodology Application Tables
1 Interview with Alan Davis, April 16, 2019, Georgia Department of Transportation. [ Return to note 1. ] 2 This rate is an average of the direct rates for a junior engineer and a senior engineer. [ Return to note 2. ] 3 Taylor and Mackey are both licensed Professional Engineers who have further obtained Professional Traffic Operations Engineer certification. [ Return to note 3. ] 4 Interview with Justin Effinger, April 24, 2019, Lake County Department of Transportation. [ Return to note 4. ] 5 Alan Davis interview, April 16, 2019. [ Return to note 5. ] 6 This rate is an average of the rates for traffic engineer, senior signal tech, and journey level signal tech (for high-level estimate). [ Return to note 6. ] | ||||||||||||||||||||||||||||||||||||||||||||||||||||||||||||||||||||||||||||||||||||||||||||||||||||||||||||||||||||||||||||||||||||||||||||||||||||||||||||||||||||||||||||||||||||||||||||||||||||||||||||||||||||||||||||||||||||||||||||||||||||||||||||||||||||||||||||||||||||||||||||||||||||||||||||||||||||||||||||||||||||||||||||||||||||||||||||||||||||||||||||||||||||||||||||||||||||||||||||||||||||||||||||||||||||||||||||||||||||||||||||||||||||||||||||||||||||||||||||||||||||||||||||||||||||||||||||||||||||||||||||||||||||||||||||||||||||||||||||||||||||||||||||||||||||||||||||||||||||||||||||||||||||||||||||||||||||||||||||||||||||||||||||||||||||||||||||||||||||||||||||||||||||||||||||||||||||||||||||||||||||||||||||||||||||||||||||||||||||||||||||||||||||||||||||||||||||||||||||||||||||||||||||||||||||||||||||||||||||||||||||||||||||||||||||||||||||||||||||||||||||||||||||||
|
United States Department of Transportation - Federal Highway Administration |
||