2019 Road Weather Management Performance Measures UpdateChapter 3. Application of Road Weather Management Tools and TechnologiesOverviewThis section focuses on the specific tools and technologies used by agencies for road weather management, including the number of State departments of transportation (DOTs) that have adopted them to date. Performance FindingsUse of Fixed and Mobile ObservationsThe first set of road weather management tools pertains to the collection of fixed and mobile road weather observations, which can take the form of real-time or archived road weather data. The objective is not only to examine the availability of such data, but to review State DOTs' subscription rates and use of observational data—which gauge the impact of the availability of data on strategic and tactical decision-making for weather-related maintenance and traffic operations. The overall success of this objective has been assessed by four performance measures, which track the number of State agencies that use these types of road weather data collection systems and strategies. Through the 2019 State DOT survey, respondents reported lower participation in the National Oceanic and Atmospheric Administration's (NOAA's) Meteorological Assimilation Data Ingest System (MADIS). MADIS offers robust quality-checked data that are available to support traffic management, inform maintenance-related decision-making and performance measurements, and provide information on current conditions to the traveling public at a national level. As of 2019, the number of States reporting involvement in MADIS dropped from 21 to 13. 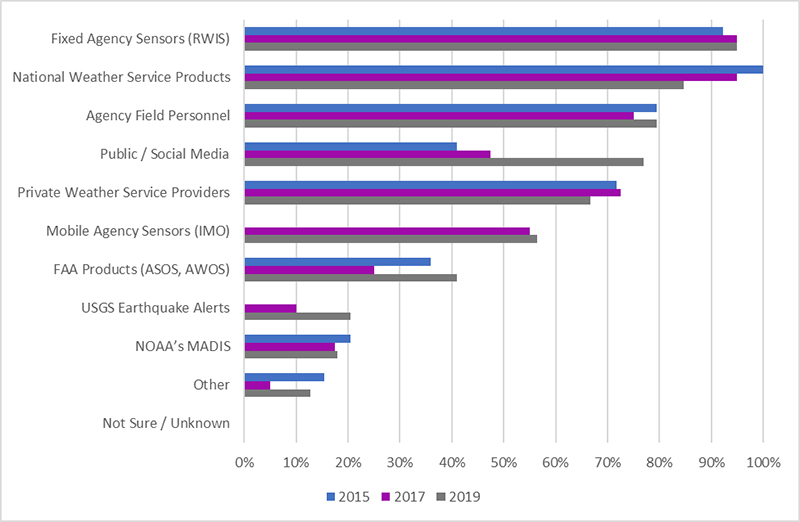 The x-axis shows percentages from 0% to 100% in 10% increments. The y-axis shows the weather and road weather products and services subscribed to including the Fixed Agency Sensors (Road Weather Information System), National Weather Service Products, Agency Field Personnel, Public/Social Media, Private Weather Service Providers, Mobile Agency Sensors (Integrated Mobile Observations), Federal Aviation Administration Products (Automated Surface Observing Systems and Automated Weather Observation System), USGS Earthquake Alerts, National Oceanic and Atmospheric Administration Meteorological Assimilation Data Ingest System, Other, and Not Sure/Unknown. Each of the categories then has three lines corresponding to it with a line representing 2015, a line representing 2017, and a line representing 2019. Fixed Agency Sensors (Road Weather Information System) and National Weather Service Products were the most popular. The x-axis shows percentages from 0% to 100% in 10% increments. The y-axis shows the weather and road weather products and services subscribed to including the Fixed Agency Sensors (Road Weather Information System), National Weather Service Products, Agency Field Personnel, Public/Social Media, Private Weather Service Providers, Mobile Agency Sensors (Integrated Mobile Observations), Federal Aviation Administration Products (Automated Surface Observing Systems and Automated Weather Observation System), USGS Earthquake Alerts, National Oceanic and Atmospheric Administration Meteorological Assimilation Data Ingest System, Other, and Not Sure/Unknown. Each of the categories then has three lines corresponding to it with a line representing 2015, a line representing 2017, and a line representing 2019. Fixed Agency Sensors (Road Weather Information System) and National Weather Service Products were the most popular.ASOS = Automated Surface Observing Systems. AWOS = Automated Weather Observation System. IMO = Integrated Mobile Observations. FAA = Federal Aviation Administration. MADIS = Meteorological Assimilation Data Ingest System. NOAA = National Oceanic and Atmospheric Administration. RWIS = Road Weather Information System. USGS = U.S. Geological Survey Figure 9. Graph. Percentage of States that subscribe to weather and road weather products and services. State DOTs reported high levels of subscriptions to weather and road-weather products and services that support the DOTs' advisory, control, and treatment strategies. In addition to mass media, various weather data are available to agencies from both public and private sources, including information from the National Weather Service (NWS), the Federal Aviation Administration, sensors deployed by Federal and State agencies, and private sector value-added services. Information on the percentage of States that subscribe to various sources of road weather products and services is available in Figure 9. Since 2017, the number of subscribers of these services has remained relatively constant. However, there are a few notable differences in this update. Significantly more State DOTs reported utilizing data from public and social media than in prior updates. Fewer State DOTs reported utilizing NWS products, continuing the trend observed in the previous update. The number of agencies using FAA products bounced back from the 2017 update and now exceeds the level observed during the 2015 update.  Figure 10. Graph. Percentage of agencies collecting real-time field data from maintenance vehicles. Overall, State DOTs are increasingly collecting real-time field data from maintenance vehicles (see Figure 10). Over three-quarters (76.9%) of respondents to the State DOT survey indicated that their agency collected some form of real-time data from some percentage of their maintenance fleet. Figure 11 shows the distribution for the types of data collected and the percentage of the vehicle fleet by the number of agencies implementing each combination. Plow status and material usage data have the broadest implementation (16 agencies with 50% or more of the fleet equipped), followed closely by atmospheric weather data (15 agencies with 50% or more of the fleet equipped), and road weather conditions data (12 agencies with 50% or more of the fleet equipped).  Figure 11. Graph. Number of agencies answering the question, "Which of the following data are collected from the maintenance vehicles, and from what percentage of the applicable fleets?" Respondents from the State DOT survey reported a total of 2,610 Environmental Sensor Stations (ESS), up from 2,464 in 2017. This is a change from previous updates, where States appeared to be gradually shutting down ESS. A significant majority of respondents (92.1%) indicated ESS data were used to support traffic management and maintenance decision-making. The decreasing trend continued for using ESS data as inputs for segment-level forecasts. Fewer respondents indicated using ESS to provide current conditions to traveler information systems than in previous updates. Figure 12 contains additional information. 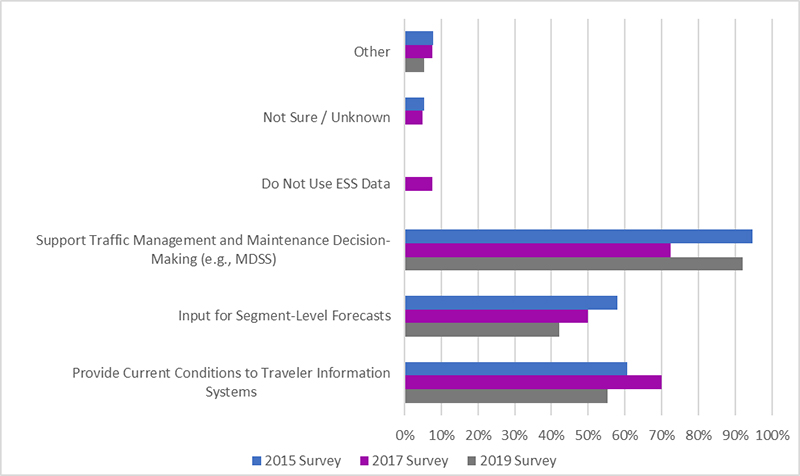 The x-axis shows percentages from 0% to 100% increasing in 10% increments. The y-axis shows the six categories of Other, Not Sure/Unknown, Do Not Use ESS Data, Support Traffic Management and Maintenance Decision Making (e.g., MDSS), Input for Segment-Level Forecasts, and Provide Current Conditions to Traveler Information Systems. Each of the categories has three bars corresponding to it consisting of a line for 2015, a line for 2017, and a line for 2019. Support Traffic Management and Maintenance Decision Making (e.g., MDSS) was by far the most commonly used. The x-axis shows percentages from 0% to 100% increasing in 10% increments. The y-axis shows the six categories of Other, Not Sure/Unknown, Do Not Use ESS Data, Support Traffic Management and Maintenance Decision Making (e.g., MDSS), Input for Segment-Level Forecasts, and Provide Current Conditions to Traveler Information Systems. Each of the categories has three bars corresponding to it consisting of a line for 2015, a line for 2017, and a line for 2019. Support Traffic Management and Maintenance Decision Making (e.g., MDSS) was by far the most commonly used.
Figure 12. Graph. Use of Environmental Sensor Stations (ESS) at State departments of transportation. Use of Decision Support ToolsThe percentage of State DOTs using Maintenance Decision Support Systems (MDSS) has increased from the 2017 update. One-third (33.3%) of State DOT survey respondents indicated statewide use of an MDSS, compared with one-fifth of respondents (20%) in 2017 and one-fourth (25%) in 2015. An additional 12.8% of respondents use an MDSS, but have not deployed such a system statewide. This is a downward trend from the two previous updates, suggesting that agencies are moving from partial deployments to statewide deployments. The number of agencies reporting not having an MDSS has decreased (17.9%, down from 22.5%), along with the number of agencies reporting not needing an MDSS (28.2%, down from 35.0%). This information is presented graphically in Figure 13. 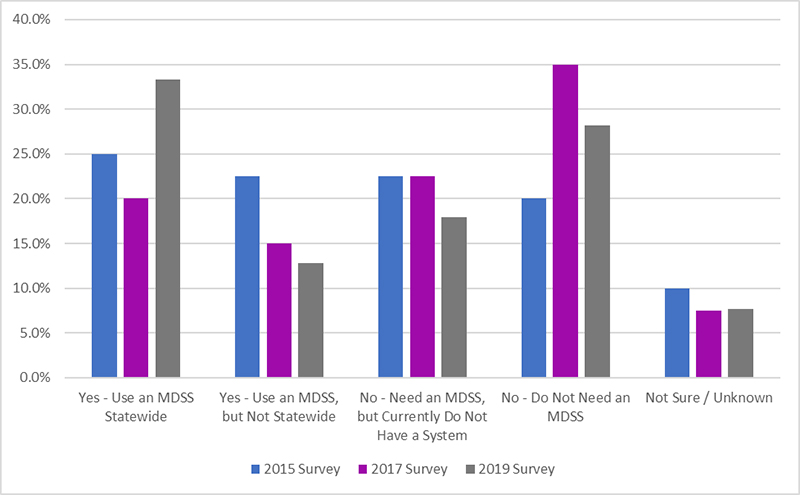 Figure 13. Graph. Percentage of State DOTs indicating use and non-use of Maintenance Decision Support Systems (MDSS). The percentage of agencies using decision support tools to provide current traveler information has steadily decreased since the 2015 update (see Figure 14). This, combined with the findings of decreasing use of ESS data to provide current conditions on traveler information systems (see Figure 12) suggests that continued promotion of the benefits provided to travelers and the transportation system could be a renewed focus of the RWMP in the period leading to the next update. All other surveyed uses of decision support tools (coordination with other jurisdictions/agencies, supporting non-winter maintenance activities, traffic control and management, setting seasonal load restrictions) have increased compared to the 2017 update. Notably, this is the second consecutive update where there has been an observed increase in the use of decision support tools to support non-winter maintenance activities such as scheduling or construction coordination.  The x-axis shows eight clusters of three bars each for the categories of None, Providing Traveler Information, Coordination with Other Jurisdictions/Agencies, Supporting Non-Winter Maintenance Activities (e.g., Maintenance Scheduling, Construction Coordination), Traffic Control and Management (e.g., Speed Limit Determination, Signal Timing Plans, Ramp Metering Rates), Setting Seasonal Load Restrictions, Not Sure/Unknown, and Other. Each of the categories has three bars corresponding to it consisting of a line for 2015, a line for 2017, and a line for 2019. The y-axis ranks percentage of State DOTs from 0% to 90% and increases in 10% increments. Providing Traveler Information was the most common option for all three of the years.
Figure 14. Graph. Percentage of State DOTs using weather related decision support tools for road weather management. A smaller proportion of State DOT respondents either do not use or are not aware of whether their agency used weather-responsive analysis tools and models (83.8% in current update versus 95.0% in previous update). This continues to reflect very low awareness and use of weather-responsive analysis, modeling, and simulation products for road weather. Traffic signal optimization tools are the most frequently used by State DOTs (see Figure 15). 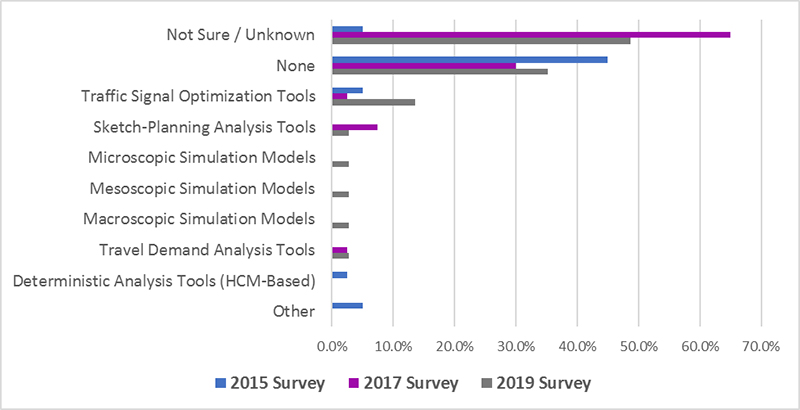 The x-axis shows percentages from 0% to 70% which increase in 10% increments used to rank the simulation tools. The y-axis lists the tools and categories of Not Sure/Unknown, None, Traffic Signal Optimization Tools, Sketch-Planning Analysis Tools, Microscopic Simulation Models, Mesoscopic Simulation Models, Macroscopic Simulation Models, Travel Demand Analysis Tools, Deterministic Analysis Tools (HCM-Based), and Other. Each tool/category contains the three bars with a line for 2015, a line for 2017, and a line for 2019. Most states answered they were unsure, or they used none in the past. However, the last couple years, the 2019 survey shows that most states have started to invest in some sort of tool.
Figure 15. Graph. Percentage of State DOTs using weather-responsive traffic analysis and simulation tools for planning and evaluating road weather management. Use of Vehicle-to-Infrastructure or Infrastructure-to-Vehicle Applications and Connected Vehicle TechnologyFigure 16 shows the tremendous growth in the number of agencies that have developed or are considering applications that use real-time data from vehicle fleets and vehicle-to-infrastructure (V2I) or infrastructure-to-vehicle technology. In the 2017 update, just 17% of agencies had developed an application and an additional 3% were considering developing an application. In the current update, 44.4% of agencies have developed an application, and an additional 47.2% are considering developing one. 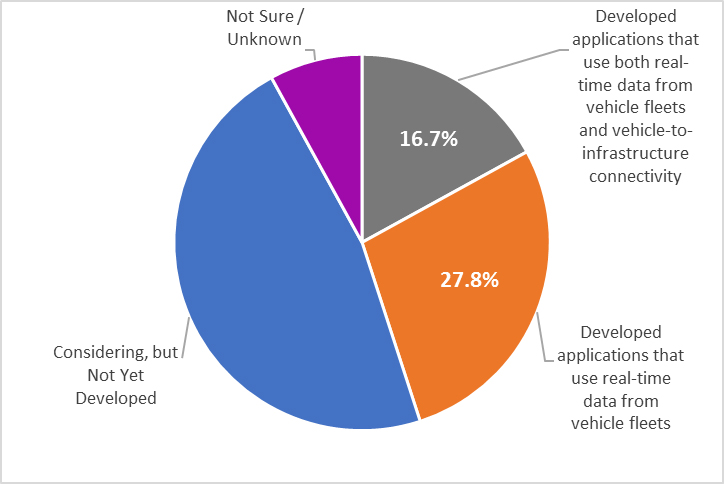 Figure 16. Chart. Survey responses on the use of vehicle-to-infrastructure or infrastructure-to-vehicle connectivity. Consideration of Extreme Weather, Transportation Resilience, and SustainabilityThe percentage of agencies that have not participated in the development of any adaptation practices has been consistently decreasing since 2015. More agencies are reporting completed vulnerability or risk assessments and implemented resiliency plans for road weather management infrastructure, as seen in Figure 17. 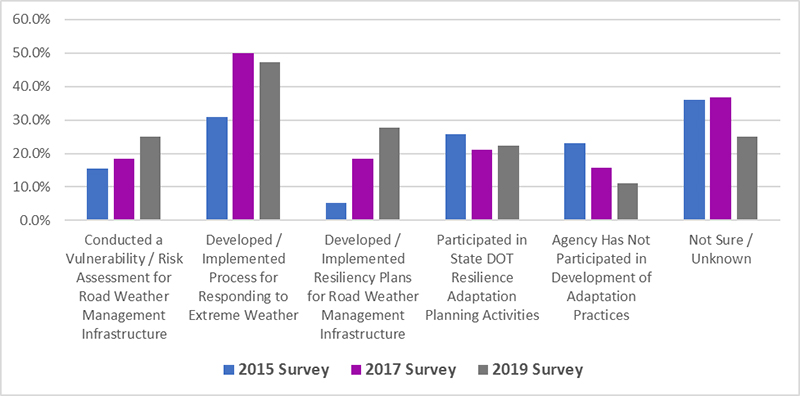 The x-axis shows percentages from 0% to 70% which increase in 10% increments used to rank the simulation tools. The y-axis lists the tools and categories of Not Sure/Unknown, None, Traffic Signal Optimization Tools, Sketch-Planning Analysis Tools, Microscopic Simulation Models, Mesoscopic Simulation Models, Macroscopic Simulation Models, Travel Demand Analysis Tools, Deterministic Analysis Tools (HCM-Based), and Other. Each tool/category contains the three bars with a line for 2015, a line for 2017, and a line for 2019. Most states answered they were unsure, or they used none in the past. However, the last couple years, the 2019 survey shows that most states have started to invest in some sort of tool.
Figure 17. Graph. Percentage of agencies involved in extreme weather or resilience activities. |
|
United States Department of Transportation - Federal Highway Administration |
||