2019 Road Weather Management Performance Measures UpdateChapter 2. Road Weather Management Impacts AssessmentOverviewMeaningful improvements in highway performance during adverse weather conditions are expected to be realized as a result of increased nationwide implementation of various road weather management strategies. The Federal Highway Administration's (FHWA) Road Weather Management Program (RWMP) uses a handful of performance measures (discussed in the following Performance Findings section) to monitor the recent progress on road systems across the country, particularly related to mitigating the negative impacts of adverse road weather conditions. The pathways from program activity to overall macro-level outcomes are complex, and direct correlation between a specific RWMP activity and road weather impacts is not possible. However, overall trends provide a snapshot of the scope of the problems agencies face today, as well as some practices that have shown positive benefits. Performance FindingsCollecting and Reporting Performance MeasuresState departments of transportation (DOTs) are continually advancing their awareness and understanding of their transportation system's performance, as well as the direct outcomes from DOT intervention in managing the impacts weather events have on the system. State DOTs are still determining the best methods for collecting road weather performance data (e.g., dashboards, winter maintenance reports, and seasonal summaries) and reporting road weather performance metrics to the public. However, more State DOTs report collecting and reporting data about road weather performance (see Figure 2). 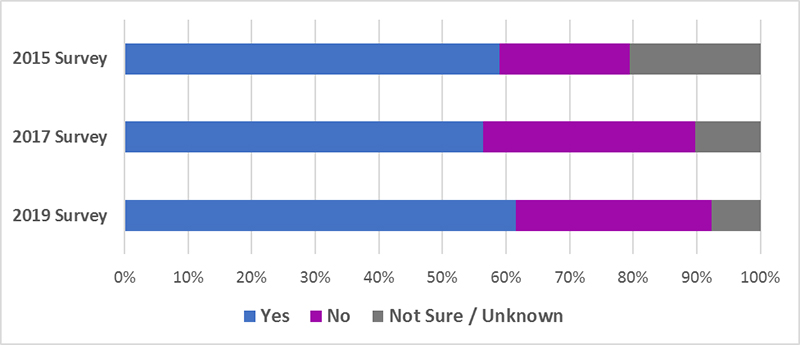 Figure 2. Graph. Percentage of agencies that collect and report road weather performance measures. After a brief dip in 2017, 61.5% of agencies (24 of 39 responding) reported collecting and reporting road weather management performance data in 2019. This is a net increase of two agencies from previously. Of note, the percentage of survey respondents who did not know or were unaware if their agency collected or reported this data has followed the downward trend observed during the previous update. The RWMP should continue to support the development of a consistent set of road weather performance measures to enable consistent assessment of impacts across the United States. The 2017 update was the first time survey respondents indicated whether or not their agency used a "winter severity index" to compare system performance across events or years. The 2019 update repeated this question, and a small but distinguishably higher percentage of participants answered in the affirmative (see Figure 3). The change in percentage growth correlates to an additional two agencies reporting use of a winter severity index. There is a similar downward trend in the number of respondents who reported their agency as not having a winter severity index. This could also be explained by the increase in the number of answers that were marked as uncertain. 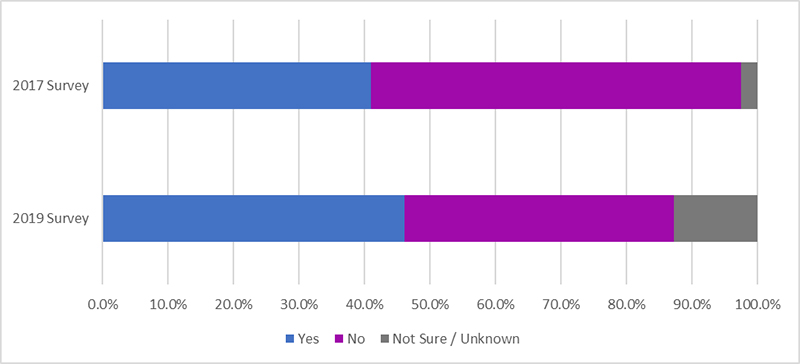 Figure 3. Graph. Percentage of agencies surveyed that use a "winter severity index" to compare performance across events or years. As shown in Figure 4, fewer State DOTs report having a process to evaluate the return on investment or net benefits of road weather management investments. Four State DOTs confirmed an established process, which is closer to the 2015 survey response of five agencies than the 2017 survey response of nine agencies. While this may be a function of different respondents to the surveys, there is an opportunity to look at the use of performance measures in greater depth by the RWMP as part of their technical support activities. 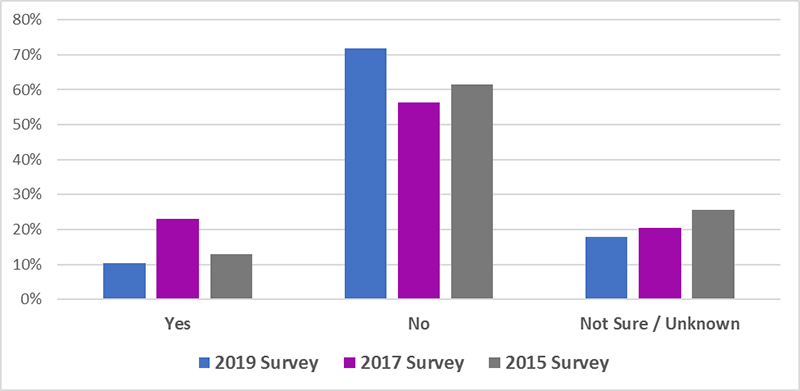 Figure 4. Graph. Percentage of agencies surveyed with a process for evaluating the return on investment or net benefit of their road weather management investments. National Trends in Road Weather ImpactsRoad Salt Use and CostThe research team studied two performance measures to assess the economic impacts State DOTs face through road weather operations and maintenance. The two factors studied for the report were total salt usage and total expenditures for snow/ice removal. 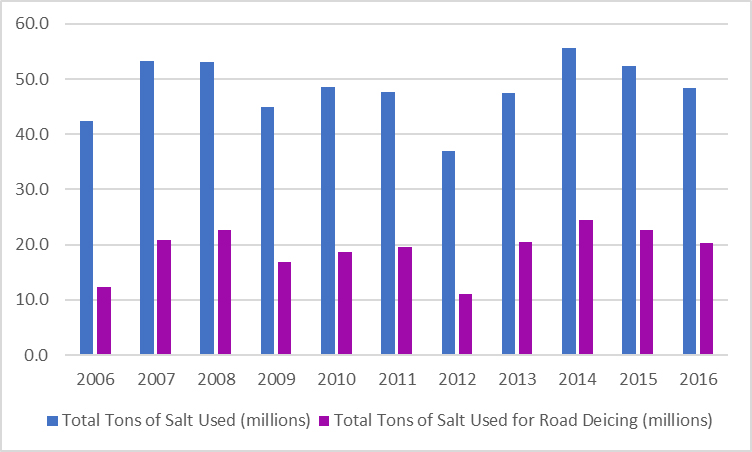 Figure 5. Graph. Nationwide salt usage by year (in millions of tons of salt). Figure 5 summarizes the most recently available data on nationwide salt usage, including the proportion of salt utilized for road deicing. Roadway deicing accounted for 43.4% of total salt usage in 2015 and 41.9% of total salt usage in 2016. These 2 years showed moderate decreases in the use of salt for roadway deicing (7.3% less in 2015 and 10.6% less in 2016). The research team did not identify any new case studies on new or innovative road weather management strategies reducing salt usage. 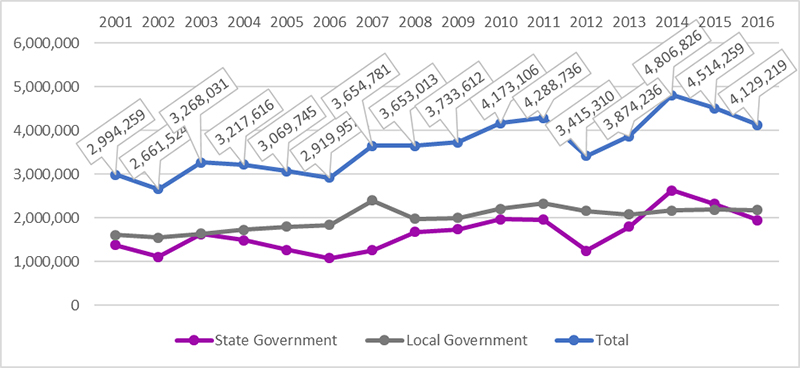 Figure 6. Graph. National expenditures for snow and ice removal, 2001-2016 (in thousands of dollars). Figure 6 summarizes the most recently available data from the FHWA Highway Statistics Manual detailing national expenditures for snow and ice removal (in thousands of dollars) between 2001 and 2016.5 Local government expenditures for snow and ice removal have been relatively constant over the past 5 years, while State government expenditures were more variable. The 2017 update reported a 13% increase between 2012 and 2013. This upward trend continued in 2013 and 2014, when State governments saw a 46.7% spike in expenditures on snow and ice removal, bringing annual State government expenditures over local government expenditures for the first time since the RWMP has tracked the data. In the 2 years after 2014, State government expenditures on snow and ice removal decreased by 16.0% and 8.5%, bringing State government expenditures back below local government expenditures in 2016. Due to the relative consistency of local government expenditures, the national trend on spending follows the State trend for the past 5 years. These observations demonstrate the natural, unpredictable variation in weather and road weather conditions over a short period. A majority of States saw expenditures increase in 2014, but the most significant increases were in Arkansas, Delaware, Georgia, Louisiana, Maryland, Mississippi, Missouri, North Carolina, Oklahoma, South Carolina, and Texas. Capacity Losses and Travel Time ReliabilityDirectly reducing the delays experienced by travelers driving in inclement weather conditions, therefore, is one of the key elements of system performance improvement targeted by the RWMP. Since the last performance measure update, the research team identified one additional delay-reducing strategy, which also has an overlap in safety goals.
Not many, if any, agencies currently track the impact of road weather management on travel time reliability. Because both road weather management and travel time reliability are influenced by a multitude of factors, it is difficult to identify a specific action that has influenced the performance outcome. SafetyAs with all transportation challenges, it is crucial to measure safety impacts of managing adverse weather. The RWMP monitors the total number of fatal crashes, including the total number occurring during inclement weather. Because the total number of licensed drivers increases on an annual basis, the RWMP indexes the number of fatalities each year by looking at the crash rates per licensed drivers and per vehicle miles traveled (VMT). This standardizes the safety metrics on a year-to-year basis, which allows for more meaningful comparison. 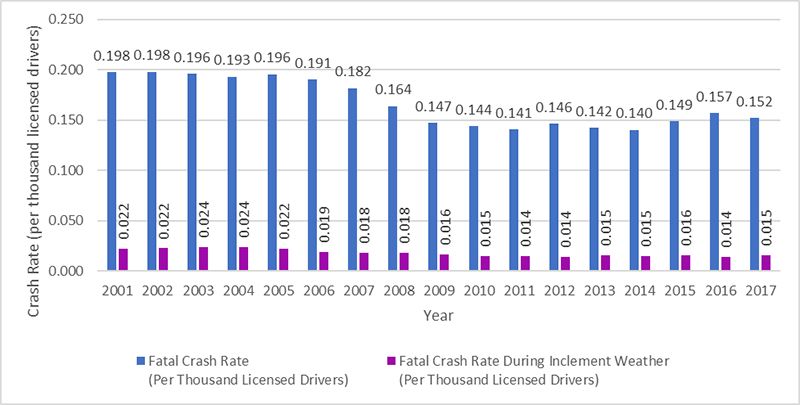 Figure 7. Graph. Fatal crash rates per thousand licensed drivers, 2001-2017. Fatal crash data from 2017 is the most recently available at the time of this report.7 The prior update covered through 2014. Figure 7 shows the total fatal crash rate per thousand licensed drivers, including the breakout of how many fatal crashes occurred during inclement weather. The fatal crash rate during inclement weather per thousand licensed drivers peaked in 2003-2004 at 0.024 crashes per thousand licensed drivers. That rate has steadily decreased to between 0.014 and 0.016 crashes per thousand licensed drivers for 2009-2017.8 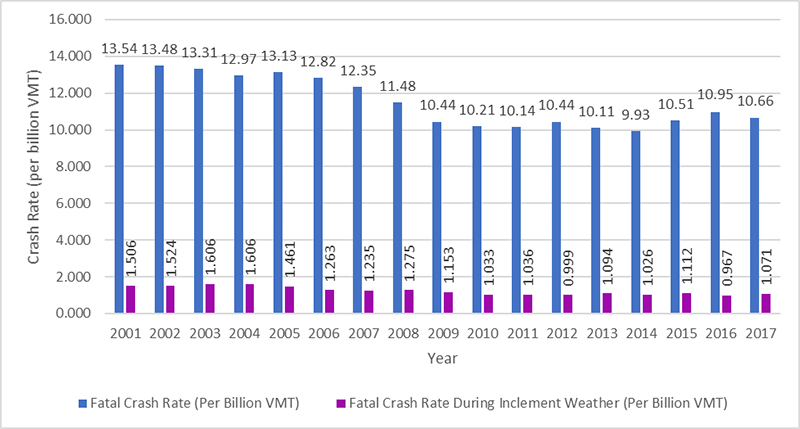 Figure 8. Graph. Fatal crash rates per billion vehicle miles traveled, 2001-2017. When indexing to vehicle miles traveled (VMT) instead of licensed drivers, a similar trend emerges. The VMT index (Figure 8) follows a similar pattern to the patterns of licensed drivers in Figure 7. Both figures illustrate how the crash rate has decreased from 2001-2010 and then grew slowly since 2010. The rate of fatal crashes occurring during inclement weather follows the same trend, but is less distinguishable than the total crash rate. The RWMP maintains 10-year averages on weather-related crash statistics, and shows that a majority of incidents occur due to wet pavement:9
The fact that the trend for fatal accidents during inclement weather mirrors the trend for total fatal accidents suggests that the observed decrease in fatalities during inclement weather is most likely a product of decreased fatalities overall. There is not enough evidence to suggest that weather-related fatal crashes decreased independently as a result of specific road weather management strategies. 5 Data Source: Highway Statistics (2001-2016) Data Tables SF-4C (Disbursements for State-Administered Highways) and LGF-2 (Local Government Disbursements for Highways). Available at: https://www.fhwa.dot.gov/policyinformation/statistics.cfm. [ Return to Note 5. ] 6 Gonzales D, Fontaine M (2018) Impact of a Variable Speed Limit System on Driver Speeds During Low Visibility Conditions. Available at: https://pubsindex.trb.org/view/2018/C/1495670. [ Return to Note 6. ] 7 Data source: National Highway Traffic Safety Administration, Fatality Analysis Reporting System Encyclopedia. Available at: https://www-fars.nhtsa.dot.gov/Crashes/CrashesTime.aspx. [ Return to Note 7. ] 8 Note: The weather conditions for many crashes in 2016 (1,700 crashes) and in 2017 (2,547 crashes) are unknown. NHTSA refines past data as more information becomes available, so it is possible that the fatal crash rates will rise above the 0.016 threshold for these years. [ Return to Note 8. ] 9 FHWA Office of Operations Road Weather Management Program, "How Do Weather Events Impact Roads?" Accessed September 5, 2017. Available at: http://www.ops.fhwa.dot.gov/weather/q1_roadimpact.htm. [ Return to Note 9. ] |
|
United States Department of Transportation - Federal Highway Administration |
||