Organizing for TSMO
Case Study 3: Performance Measurement – Making Data-driven Transportation Decisions Using Performance Measures
The Niagara International Transportation Technology Coalition (NITTEC), the Oregon Department of Transportation (ODOT), and the New Hampshire Department of Transportation (NHDOT) participated in previous second Strategic Highway Research Program (SHRP2) efforts. The capability maturity model (CMM) workshops with SHRP2 helped inform them about transportation systems management and operations (TSMO) and how it can apply to their agencies. This chapter highlights several successful initiatives each agency accomplished, specifically regarding performance measurement for TSMO.
Niagara International Transportation Technology Coalition (NITTEC)
NITTEC is a coalition of agencies developed to provide real-time traffic and roadway information to improve traffic flows and enhance emergency assistance for motorists. NITTEC includes four international border crossing
Knowledge Through Data
Knowledge through data "is the general rule that NITTEC should collect as much relevant data as possible from as many sources as possible," beginning with NITTEC members and eventually other regional entities.3 A manifestation of this rule is to establish a data warehouse of the regional transportation network that can be used to assess performance. In addition, as different types of data are added, the data becomes more robust and valuable. More data also gives a clearer picture of performance.
NITTEC recognizes the importance of data. Data is directly connected to performance measures and is important for achieving outcome-driven TSMO. With knowledge provided through data, NITTEC will have a better understanding of not only the transportation network, but how changes in the network affect human behaviors and driving habits. With this in mind, NITTEC is developing a repository of historical data. This has shifted the culture of the agency to value data and will be beneficial for gaining insights in the future.
Robust data and analytics capabilities are critical to informing funding and transportation development. As a public-sector transportation organization, NITTEC has a unique position in how it affects the community, businesses, and residents through its role in guiding strategic objectives and making transportation funding decisions. However, NITTEC does not currently have the capabilities needed to collect and analyze the desired volume of data. To overcome this challenge, NITTEC created a Performance Measures Plan.
Performance Measures Plan
Creation of a Performance Measures Plan helped NITTEC focus on areas appropriate for achieving their near- and long-term goals. The plan identified three types of metrics and corresponding data recommended for deployment-metrics that illuminate the impact of overall efforts toward broader strategic objectives; metrics that illustrate quantifiable progress toward a defined goal; and data that helps indicate the successful function of certain processes. The plan also evaluated NITTEC's performance measurement practices at that time and found them to be generally lacking in connections to successful strategic objectives, measures of effectiveness, data-sharing among coalition members, and intelligent transportation systems (ITS) devices that collect data. This presented an opportunity for improvement by NITTEC, starting with the development of key performance indicators (KPI).
NITTEC identified KPIs that are relevant to its core operational areas and functions. NITTEC disseminates these KPIs through an annual report. The Performance Measures Plan recognized that these KPIs can be expanded to include more data metrics as well as become connected to outcome-driven management. Figure 2 shows an excerpt from the Performance Measures Plan and details the high-level plan for NITTEC's performance measures approach.
 Figure 2. Chart. Performance Measures Approach
Source: 2017 Performance Measures Plan, NITTEC, 2017
Figure 2. Chart. Performance Measures Approach
Source: 2017 Performance Measures Plan, NITTEC, 2017
Acting on these recommendations helped NITTEC realize the power of data and how it can improve the efficiency of transportation operations. KPI dashboards have made the large amount of data easy to digest for NITTEC and will continue to improve as more performance measures are added and results are seen.
Strategic Plan
Through SHRP2, the NITTEC Strategic Planning Committee realized it was time to update the Strategic Plan, which was last done in 2007. During the process of updating the Strategic Plan, NITTEC also recognized the need for a Performance Measures Plan and a Customer Engagement Plan. The Strategic Plan is the umbrella under which these two plans fall and helps NITTEC achieve their TSMO goals. The Customer Engagement Plan is intended for members of NITTEC as well as the general public. The plan examines services provided for member agencies as well as information disseminated to the public. The Strategic Plan, Performance Measures Plan, and Customer Engagement Plan are separate, but closely related in that they cross-reference each other, and all contribute to the same goal.
By updating the Strategic Plan and adding the other plans, NITTEC realized how much the transportation industry has changed and how these changes impact their organization. They realized that technology and data now play a large role in managing a transportation system and the importance of incorporating this into their strategy. Working on plan updates also helped NITTEC and its partners develop and refine organization goals and gain traction towards achieving them. Figure 3 from the Strategic Plan further describes their goals.
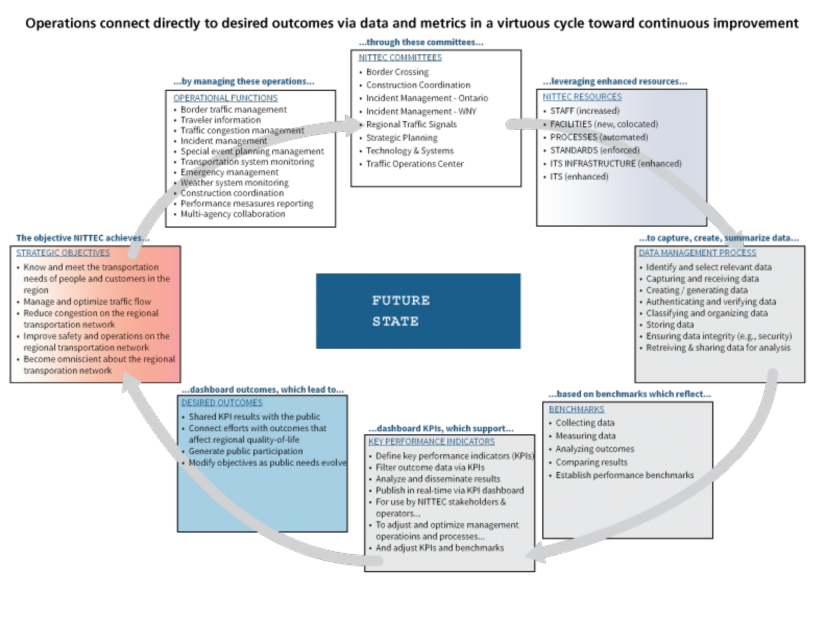 Figure 3. Diagram. Future State of NITTEC
Source: 2017 Strategic Plan, NITTEC, 2017
Figure 3. Diagram. Future State of NITTEC
Source: 2017 Strategic Plan, NITTEC, 2017
Oregon Department of Transportation (ODOT)
ODOT supports the State of Oregon's transportation needs through five regional offices. ODOT manages almost 74,000 miles of highways, streets, and roads, as well as over 8,000 bridges, seven commercial airports, 97 public use airports, and 23 marine ports.
Data Warehouse
ODOT has a data warehouse-a set of technologies put in place for data management. This data warehouse is an agency resource used to support the data needs of ODOT's TSMO initiative. As ODOT implemented its TSMO Performance Management Plan, one of the most beneficial outcomes has been migrating the operation systems data into the warehouse. This has been an effective tool for analytics, building reports and dashboards, and monitoring performance measures.
The data warehouse is primarily used for data transformation and storage. ODOT uses Microsoft's Power BI report-building tools, which have been valuable in developing reports to meet their needs.
To support implementation of its traffic incident management goals, ODOT has been developing traffic incident management (TIM) teams. During implementation, ODOT learned the power of data to drive discussions about operations. Without the information that data provides, it was difficult to generate discussions and interest from TIM stakeholders. With data and analytics now available, ODOT has seen an incredible change in discussions and enthusiasm for TIM solutions. Last year, ODOT performed new training on quick clearance techniques called "push, pull, and drag" for removing vehicles from travel lanes. ODOT is leveraging data available since completing the training to measure the effectiveness of these quick clearance techniques. Some of the performance measurements being considered include the percent of incidents that use the new techniques and the average time benefit of using new techniques. The data is granular enough to sort by individual responders. Figure 4 details ODOT's implementation plan for the TIM program specifically.
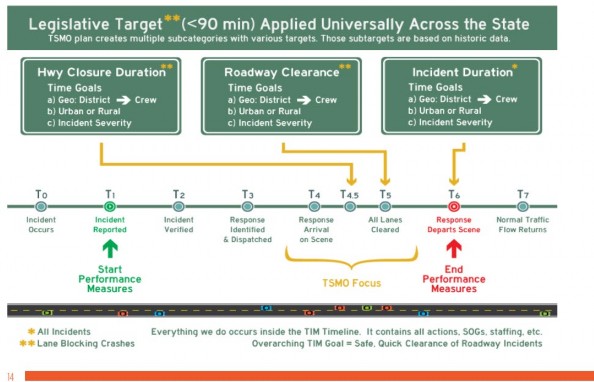 Figure 4. Diagram. TIM Implementation
Source: 2017 Performance Measurement Plan, ODOT, 2017
Figure 4. Diagram. TIM Implementation
Source: 2017 Performance Measurement Plan, ODOT, 2017
Signals Inventory
Another area of significant improvement is TSMO asset management. TSMO asset management is much less mature in comparison to other assets such as bridges or pavement. Initially, observations and input from regional staff were relied upon to identify TSMO asset investment needs. This approach failed to provide an accurate picture of TSMO asset condition and condition trends. Using a number of data sources, ODOT was able to provide a more comprehensive view of the condition of TSMO assets in the State. The asset reports now available are useful for identifying project needs and evaluating trends related to asset condition. This included implementation of a new methodology for traffic signal condition rating. All the signals in the State can now be shown on a map along with their condition ratings. Improving access to TSMO asset condition data in an easily understood, visual format has dramatically changed awareness of TSMO asset conditions and the project selection conversation.
Figure 5 lists potential performance measures for asset management from the Performance Measurement Plan.
 Figure 5. Chart. Asset Management Performance Measures
Source: 2017 Performance Measurement Plan, ODOT, 2017
Figure 5. Chart. Asset Management Performance Measures
Source: 2017 Performance Measurement Plan, ODOT, 2017
New Hampshire Department of Transportation (NHDOT)
NHDOT supports the transportation needs of the State of New Hampshire through six district offices. NHDOT manages 9,266 lane-miles of highways and roads, 2,169 State bridges, 1,684 municipal bridges, and 25 public airports.
TSMO Bureau Performance Measures
Through SHRP2 efforts and the CMM, NHDOT established a stand-alone TSMO Bureau that reports directly to executive staff. Because of this, TSMO is now included in key meetings and has direct communication and access to leadership. The TSMO Bureau captures two types of performance measures-public-facing and internal. The bureau captures public-facing measures and displays them online. It reports internal measures through an internal report distributed quarterly. The public-facing measures generally include safety and ITS device information. The internal measures include core data, goals, and costs. Figure 6 provides some of the internal measures included in the report.
 Figure 6. Chart. Operational Summary
Source: 2018 Q3 Corporate Quarterly Report, NHDOT, 2018
Figure 6. Chart. Operational Summary
Source: 2018 Q3 Corporate Quarterly Report, NHDOT, 2018
The TSMO Bureau has implemented a phased approach for measuring performance. The first phase involves identifying specific measures that are repeatable and generate good data. As the collection of data is established as a regular process, the second phase involves using this data to conduct trend analyses to ascertain if any patterns are occurring. The third phase involves using available data and insights from the trend analyses to set specific performance targets.
Transportation Management Center
The transportation management center (TMC) is part of the TSMO Bureau with a mission to detect, verify, and respond to incidents that affect the State transportation network. Part of the data initiative for NHDOT includes performance measurements for TMC operators. The performance measures specific to TMC operators include the number of incidents, incident clearance time, and average operator response time. The average operator response time refers to the elapsed time from when an incident was detected or reported and when the public was notified. The public is notified in three ways:
- Advanced traffic management system that provides information to both a 511 website (www.newengland511.org) and to subscribed users of NHDOT's automated email or text alert system, 'My Trips.'
- Social media such as Twitter and Facebook.
- TMC-operated dynamic message signs (DMS).
The performance measures tracked by the TMC and TSMO Bureau are posted on the TMC Operations Dashboard website shown in Figure 7. From the website, the user can select any provided month and a report will be generated that provides detailed data for an array of information including ITS assets deployed, total number of TMC calls received, type of weather information that was disseminated to agencies, and more. This dashboard is accessible by both agency staff and the public. This helps promote trust with the public as well as transparency. Figure 8 is a sample report taken from the dashboard, specifically regarding DMS messages.
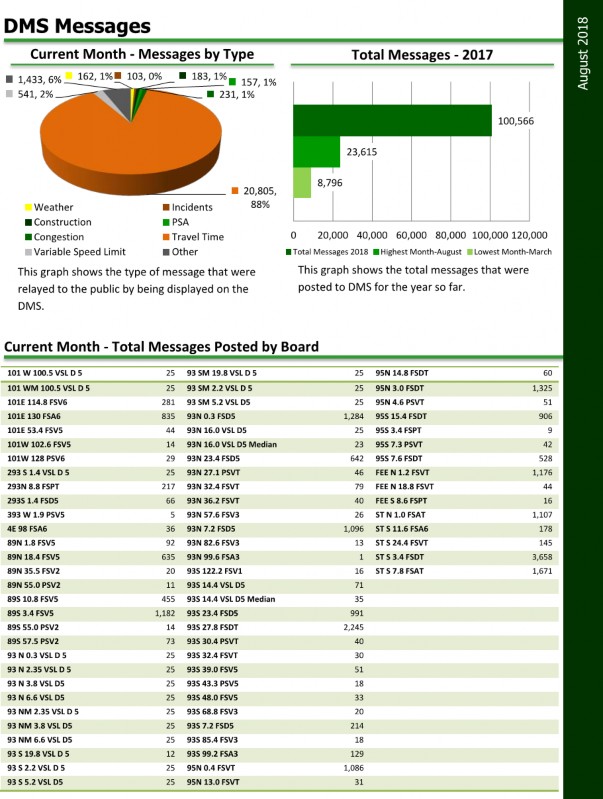 Figure 8. Chart. Dynamic Message Sign Messages Summary
Source: TMC Monthly Operational Summary, NHDOT, 2018
Figure 8. Chart. Dynamic Message Sign Messages Summary
Source: TMC Monthly Operational Summary, NHDOT, 2018
TMC operators responded very well to these new performance measures. They are able to use performance measures as a way to track their own opportunities for improvement through development of internal-use spreadsheets. Operators also provided details on where additional support or resources could benefit from full implementation of these metrics.
Operators can track delay and other performance measures on specific corridors during certain periods. This helps build the case for funding capital improvements in areas where it is most needed as well as helps remove bottlenecks, increase device uptime, and provides support for maintenance contracts and budget processes.