Integrating Travel Time Reliability into Transportation System Management: Final Technical Memorandum
Chapter 2. Reliability Analysis Desk Scan
As one of the first tasks in this project, the team conducted a review of over 30 documents to identify examples and overarching guidance on the use of operational and reliability analysis to develop transportation system management goals, objectives, and performance targets and make planning, investment, and tactical decisions. This section will summarize the approach and findings of the desk scan. Case studies developed from this desk scan are at the end of this section and include the following examples:
- Reliability Performance Management at the Colorado Department of Transportation (DOT).
- Iowa DOT Interstate 80 Automated Corridor Study – Travel Time Reliability Analysis for Investment Planning.
- Wisconsin DOT Reliability and Benefit-Cost Update: Enhanced Project Selection through Travel Time Reliability Analysis.
- Minnesota DOT Congestion Management Safety Plan – Enhanced Project Selection through Travel Time Reliability Analysis.
Summary of Approach
The project team reviewed State DOT, metropolitan planning organization (MPO), Federal Highway Administration (FHWA), and National research papers in an effort to answer as many of the following questions as possible:
- Where and how are operational and reliability analyses—both qualitative and quantitative—being used to develop:
- Goals?
- Objectives?
- Performance targets?
- How is reliability integrated with or kept separate from other performance objectives?
- Where and how are operational and reliability analyses—both qualitative and quantitative—being used to decide:
- What to include in a plan, for example, capacity expansion, operational improvements, multimodal development, land use? How the transportation system or network evolves or will be modified as a result of planned improvements?
- What to invest in?
- How to implement transportation systems management and operations (TSMO) tactics and strategies?
- How are decision support systems (existing or emerging) being used for any of the activities above (e.g., integrating reliability or operations analysis in planning or operations)?
- How is reliability or operations analysis integrated into business processes? Are there any emerging or prospective institutional approaches?
- What models or frameworks exist that show how integration can or should occur (e.g., from FHWA guidebooks or other literature)?
- What methodology and reliability analysis—or any type of operations analysis—do agencies use to identify both operations objectives for managing systems and strategies to achieve outcome-based strategic objectives?
- How are smaller scale (e.g., network, corridor) operations objectives developed to support system-wide objectives? What operations or reliability analysis is used?
- What are the motivations for using reliability and operational analysis in planning, system management, and implementation?
- What is the actual and perceived value and return-on-investment (ROI) for transportation operations and reliability analysis?
- Are private companies involved? If so, how?
- What are the critical issues, barriers, and gaps in using reliability/operations analysis for planning, system management, and implementation?
- What are the trends, themes, and opportunities?
Desk Scan Findings
This section summarizes the project team's literature review results. The findings are grouped as follows:
- Reliability and operational analysis used in setting direction.
- Reliability and operational analysis for planning and investment decisions.
- Reliability and operational analysis for implementation and tactical decisions.
- Decision support systems.
- Frameworks for including reliability and operational analysis in transportation system planning, programming, strategic, and tactical decisions.
- Gaps and barriers.
- Trends and opportunities.
Reliability and Operational Analysis Used in Setting Direction (Goals, Objectives, and Targets)
To implement the transportation performance management framework established by the Moving Ahead for Progress in the 21st Century (MAP-21) Act and the Fixing America's Surface Transportation (FAST) Act, FHWA established performance rulemakings. The travel time reliability measures require State DOTs and MPOs to develop targets and measures for travel time reliability on the Interstate and non-Interstate National Highway System (NHS). All State DOTs, as well as MPOs with Interstate and/or non-Interstate NHS roads within their metropolitan planning area, are required to conduct operational reliability analyses for performance target calculation. The National Performance Management Research Data Set (NPMRDS) is the required data for analysis.1
The FHWA report Advancing Transportation Systems Management and Operations through Scenario Planning can be a helpful resource for planners and decision makers to support the development of goals, objectives, and targets for their long-range plans. The primer provides general guidance on the use of data and analysis tools to test multiple scenarios and their impacts on desired outcomes identified as part of a scenario planning process.2
The team identified examples of MPOs in Portland, Oregon,3 and New York4 that include travel time reliability goals in their long-range plans. In addition, Iowa DOT5 and Texas DOT6 established reliability goals for specific transportation systems management programs.
Reliability and Operational Analysis for Planning and Investment Decisions
The project team identified numerous reports and other documents describing the use of operational and travel time reliability analysis in the process of selecting strategies for transportation plans and making investment decisions. The primary guidance in this area comes from the Second Strategic Highway Research Program (SHRP2) Reliability and Data Analysis Tools (RDAT) bundle of products.7 The RDAT bundle helps agencies address travel time reliability in their assessment of transportation alternatives so they can consider a more complete set of benefits in their decisions. The bundle includes:
- L02 – Guide to Establish Monitoring Programs for Travel Time Reliability.
- L05 – Handbook for Incorporating Reliability Performance Measures into Transportation Planning and Programming.
- L07 – Reliability by Design.
- L08 – Incorporating Travel Time Reliability into the Highway Capacity Manual.
- C11 – Tools for Assessing Wider Economic Benefits of Transportation.
Agencies can use the RDAT tools resulting from the L07, L08, and C11 initiatives to evaluate strategies and to make informed planning and investment decisions. The analysis tools were tested and piloted by transportation agencies, which applied strategies such as median barrier, ramp metering, incident response, bottleneck removal, separated high-occupancy vehicle (HOV) lanes, and transit service.
The project team also found several examples that demonstrated agencies using travel time reliability analysis for more than just a single project, but also systematically as a business process. Agencies are leveraging travel time reliability analysis to link strategy selection to agency objectives or stakeholder-derived objectives for the corridor or region. For example, the Iowa DOT I-80 Automated Corridor Study analyzed alternatives to achieve the objective to reduce vehicle crashes and non-recurring congestion. Travel time reliability analysis helped the department to promote strategies that advance connected and automated vehicles (CAV) to meet those objectives.8
Examples of a systematic use of travel time reliability analysis include:
- California Department of Transportation (Caltrans) Corridor System Management Plans – The development of Corridor System Management Plans is a planning approach that uses travel time reliability with other operational analyses to develop tiered solutions to improve corridor congestion. Solutions that are prioritized earliest for implementation tend to be transportation system management strategies due to their low cost.9
- Minnesota Congestion Management and Safety Plan (CMSP) – This is a recurring, system-wide study that targets low-cost and high-benefit solutions based on methods that were recently enhanced with travel time reliability analysis. Several of the solutions are operational in nature.10
- Florida DOT Multimodal Mobility Performance Measure Program – The program uses operational performance measures (trip-based travel time reliability included) to evaluate improvement alternatives as part of the statewide programming and prioritizing of projects.11
- Regional Transportation Commission of Southern Nevada Congestion Management Process – Through this process, the MPO prioritizes improvements that address congestion based on four components of congestion: intensity, duration, extent, and reliability.12 13
- Capital District Transportation Committee (CDTC) (NY) – The MPO used the New York State DOT's Management Information System for Transportation (MIST) data set to understand and evaluate the costs and benefits of investments to address non-recurring and recurring delay. This contributed to establishing operations and incident management as strong priorities at CDTC.14
- Iowa DOT I-80 Automated Corridor Study – Iowa analyzed various alternatives to determine the impact on operations, safety, and travel time reliability. They established an Iowa standard for corridor planning for evaluating travel time reliability to support the department's TSMO goals.15
Reliability and Operational Analysis for Implementation and Tactical Decisions
While the study team found a few examples of operational analysis usage by agencies to identify how, when, and where to implement transportation systems management strategies, no specific uses of reliability analysis were found during the literature review. The Michigan and Missouri DOTs use operational analysis methods to manage traffic around work zones. For example, the Michigan DOT used modeling and simulation tools to prepare for the closure of a freeway and to optimize work zone traffic control strategies.16 The Missouri DOT has developed two spreadsheet analysis tools to help with planning work zones. The Work Zone Impact Analysis Spreadsheet estimates queuing and traffic delays during work zones.17 The agency also developed a Traffic Pacing Spreadsheet Tool to help plan and facilitate the traffic pacing work zone strategy,18 in which pacing vehicles are used to slow all lanes of traffic concurrently to create a gap between traffic and the mobile work crew, facilitating the safe operation of short-duration work.
Decision Support Systems
Decision support systems (DSS) have been used in many industries to facilitate tasks or processes in a structured manner based on current conditions and past successful practices. In the transportation field, DSS have a strong practical application, often being used by transportation management center (TMC) operators to help them respond effectively to developing congestion and incidents. The spread of DSS in the transportation industry is connected to the evolution of highly interrelated agency practices at the TMC between system operators and emergency service personnel. More recently, DSS is used in the practice of integrated corridor management (ICM).19 For ICM, the primary literature surveyed in this study discussed pilot ICM deployments in San Diego, California, and Dallas, Texas.20 21
DSS are also being considered for use in decision-making at the program level among transportation system management planners and operators. The National Cooperative Highway Research Program (NCHRP) is conducting a research project to assess current processes and analysis methods that are foundations for how core decision-making processes occur: (1) within TSMO programs, (2) in conjunction with associated and encompassing agency functions, and (3) in an integrated and supportive fashion by data and information associated with on-going operations. The research will identify and consider how effective and emerging business intelligence practices, models, or approaches from other industries can be applied to TSMO and transportation agency program management processes. Particular attention will be paid to business intelligence practices that reduce the cost of providing services or improve the quality and effectiveness of decision-making capabilities.22
Frameworks for Including Reliability and Operational Analysis in Transportation System Planning and Programming and in Strategic and Tactical Decisions
Reliability is quickly becoming a critical objective for transportation system performance, but there is no full framework that either demonstrates how that objective can be drawn through each stage of system management or offers analysis results to guide decisions. A framework is needed to guide transportation system management practitioners in using reliability and operational analysis to connect the elements of planning, programming, and implementing system management strategies and tactics. As part of the desk scan task, the study team identified and reviewed several frameworks, which are described below.
The FHWA Office of Operation's workshop on Incorporating Reliability into the Congestion Management Process (CMP) teaches five key actions that MPOs can use to incorporate reliability into the CMP (see figure 3).23
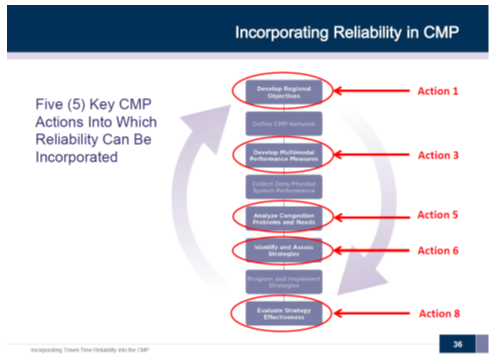
According to the workshop slides, the CMP is a natural process in which to incorporate reliability, but most CMPs focus on recurring congestion.
- Action 1 – The first step to incorporating reliability into the CMP is to develop regional objectives that contain language and factors relating to reliability. The workshop recommends that each region have a foundational understanding of reliability performance prior to setting goals and objectives. This understanding will help a region better grasp the magnitude of change that could be achieved and would help set realistic expectations. This will require data collection and performance analysis. The objectives should include performance targets.
- Action 3 – The next key action is to develop multimodal performance measures specifically related to reliability. The workshop provides an overview of several common reliability performance measures and recommends developing them in conjunction with partnering agencies.
- Action 5 – This step involves analyzing congestion problems and needs. This serves to identify existing reliability problems and diagnose their causes. The following SHRP2 products are recommended as resources:
- Establishing Monitoring Programs for Travel Time Reliability: A Guidebook (SHRP2 L02).
- Incorporating Reliability into Planning and Simulation Models (SHRP2 L04).
- Design Guide for Addressing Non-recurrent Congestion (SHRP2 L07).
- Incorporation of Travel Time Reliability into the HCM (SHRP2 L08).25
- Action 6 – This step involves identifying and assessing strategies.
- Action 8 – The last action is to monitor and evaluate the effectiveness of the implemented strategies.
While this framework provides a solid outline for integrating reliability into several of the key points in planning, additional details are needed to determine both the appropriate analysis tools as well as when and how to apply them to logically progress from outcome-oriented objectives to activity-based objectives, strategies, and tactics.
Gaps and Barriers
During the literature review, the study team identified a set of gaps and barriers pertaining to the practice of using reliability and operational analysis in transportation system management planning, programming, strategic, and tactical decisions.
From the perspective of providing national guidance, the following are overarching gaps that motivate this project:
- Broad planning-level goals and objectives inconsistently linked to TSMO systems engineering and deployment.
- Misalignment or no alignment of planning objectives with operational objectives.
- No overarching framework for traffic operations performance analysis of goals and objectives translated into strategies and tactics.26
During the literature review, the team identified technical, institutional, and financial barriers to using travel time reliability analysis tools in planning and implementing system management strategies. The barriers to the adoption of travel time reliability analysis have largely been recorded in the SHRP2 RDAT proof-of-concept pilots conducted by the Minnesota DOT and the Florida DOT. The primary challenges collected from stakeholder panels during these projects are:
- Staff time and resources.
- Resistance to change.
- Maturity of software tools for conducting travel time reliability analysis.
The first two challenges cited by these project stakeholders are typical of challenges to all innovation, but may be overcome through experience with benefits. The maturity of the software tools were stressed during the proof-of-concept tests, and this led to further enhancement of these RDAT tools.
Follow-on implementation projects still found gaps in how the tools evaluate reliability and how the reliability analysis between several RDAT tools do not interface consistently. They also recognized a lack of breadth in the built-in TSMO strategies that can be directly evaluated within the RDAT tools. These implementation projects include:
- Iowa DOT Reliability Pilot – Inconsistency between travel time reliability monitoring, analysis, and benefit monetization tools.
- Rhode Island Statewide Freight Plan – Travel time reliability analysis limited by a single year timeframe, other shortcomings.27
- Wasatch Front Central Corridor Study – Tools not applicable to transit and incentive strategies.28
Another area where the study team identified gaps is in the organizational readiness of agencies for transportation system management. The literature review identified an active project that aims to fill gaps in system management, NCHRP 03-128 Business Intelligence Techniques for Transportation Agency Decision Making, which has been scoped to focus on enterprise data management practices, data analytics, predictive analytics, and business performance management to improve system management.29
Another project, NCHRP 20-07 Task 365 Transportation System Management and Operations Program Planning – Experiences from the SHRP 2 Implementation Assistance Program, details the challenges to widespread adoption of TSMO program planning. The document examined agencies that have not begun developing a TSMO program plan. Reasons for not pursuing development of a TSMO program plan included:
- Focusing more on maintaining existing initiatives with their limited resources and funding.
- Postponing TSMO planning until they can first address other operations issues.
- Lacking of a particular champion of TSMO planning.
- Policymakers who are neutral on the issue of TSMO planning or who do not understand the benefits of TSMO.30
Trends and Opportunities
Trends and opportunities in the areas of travel time reliability analysis and organizational readiness for TSMO suggest potential growth in both of these areas may promote their mutually beneficial integration.
Use of travel time reliability analysis has grown based on the success of the SHRP2 program and its dedicated implementation assistance program. SHRP2 initially piloted the RDAT tools in four States and then expanded deployment through two rounds of implementation assistance. Through that program, the tools have been tested by more than a dozen agency partnerships. From that momentum, practices have been established that bring travel time reliability analysis into more standard use in States like California, Minnesota, Florida, and Wisconsin. Stakeholders of the Minnesota DOT proof-of-concept testing saw nearly equal opportunity for travel time reliability analysis to help categorize existing sources of delay, support improved project evaluations, enhance benefit-cost analysis by capturing modeled delay of nonrecurring events, and improve the planning and programming process.31
Through its SHRP2 project, Florida DOT developed the Planning for Travel Time Reliability Guide, which notes that Florida DOT (FDOT) "has been a pioneer in developing performance measures that address reliability. Likewise, the agency has developed a mature TSMO program and is currently working to maximize efforts to incorporate TSMO improvements into planning and corridor studies."32 FDOT intends for the Planning for Travel Time Reliability Guide to build on their prior TSMO work and provide FDOT employees and consultants with guidance on how travel time reliability is incorporated into FDOT's planning processes for capacity expansion and operational improvements. It describes how to fund improvements that address travel time reliability and identifies opportunities for collaboration and tools for incorporating travel time reliability in planning.
The Federal rulemaking on performance measurement that includes several travel time reliability measures increases the potential number of travel time reliability analysis users significantly.33 The potential swell of travel time reliability analysis related to the Federal rulemaking may prove an opportunity to increase agency willingness and interest in the use of reliability analysis.
Case Studies
Reliability Performance Management at the Colorado DOT
The 2013 revision of the State Measurement for Accountable, Responsive and Transparent Government Act formalized performance measurement in Colorado and provided a framework for performance planning, management, data collection, reporting, and evaluation.34 The Act requires State departments in Colorado, including the Colorado Department of Transportation (CDOT), to develop performance management plans with ongoing target setting and performance evaluation. In its annual performance measurement plans, CDOT establishes strategic policy initiatives, strategies, and processes supporting those initiatives, and output and outcome measures indicating performance levels.
From 2013 to 2017, CDOT has included travel time reliability as part of its strategic policy initiatives. CDOT sets an annual target in terms of a statewide planning time index (PTI), a measure of the total travel time that should be planned for a trip. The PTI is calculated as the 95th percentile travel time divided by the free-flow travel time.
CDOT set separate PTI targets by direction for two primary Colorado freeways: Interstate 25 (between Northwest Parkway and C-470); and Interstate 70 (between Vail and C-470).35 CDOT set the targets using historical probe-based travel time data for each corridor and direction. The established targets were generally higher than historical values because CDOT took into consideration increasing population and traffic volumes.
The following are example strategies for improving travel time reliability that CDOT has included in their annual plans:36
- Improve traffic incident management (TIM) and clearance times through statewide training that leverages the FHWA National TIM Responder Training program.
- Target corridor improvements, such as bottleneck reductions, through the Highway Safety Improvement Program (HSIP).
- Implement managed lanes through tolling, variable speed limits, peak-period shoulder lane operations, and active traffic management (ATM).
- Add ramp meters to manage system flow better.
- Use intelligent transportation systems (ITS) to provide real-time weather and roadway information to travelers.
- Develop command-level partnerships with law enforcement to implement integrated event traffic management.
- Implement new, innovative technologies.
In addition, CDOT's annual plan translates the policy goals into operational measures that include reducing average incident clearance times and reducing average road closure event times. These operational measures and associated targets help to offset the growth in PTI along Interstates 25 and 70. They also measure the effectiveness of selected operational processes (e.g., train first responders and conduct after-action reviews of incident clearance) in supporting the travel time reliability policy initiative. CDOT conducts a quarterly evaluation of system performance against the established PTI goals.
In the performance plan for CDOT's 2017-2018 fiscal year, CDOT renamed its policy from "the travel time reliability policy initiative" to "the travel time policy initiative." CDOT also adopted a new performance measure: average travel time (instead of PTI), but the targeted corridors and strategies remain the same as in previous plans.37
Iowa DOT Interstate 80 Automated Corridor Study – Travel Time Reliability Analysis for Investment Planning
In Iowa, Interstate 80 (I-80) connects Iowa's major cities and serves as a vital corridor to transport people and goods. Originally built in the 1950s and 1960s, I-80 needs new infrastructure, design improvements, additional capacity, and enhanced safety features. In 2015, Iowa DOT initiated the I-80 study to direct future investment in the corridor.
Using the Planning Environmental Linkages framework, Iowa DOT conducted planning-level evaluations of multiple factors, including the effect that automated vehicles (AV) could have on operations (recurring and non-recurring congestion) and safety.38 The study used recent research to develop projections for increased demand, increased capacity, harmonized speeds, and reduced crash frequencies due to the integration of AVs into non-automated traffic streams. Using forecasted AV impacts on recurring congestion and predicted crashes, the project team conducted a travel time reliability analysis to capture the potential for AV to improve operations even when considering non-recurring congestion.
The project used the SHRP2 L07 model (RDAT bundle of products) to estimate travel time index (TTI) curves for multiple scenarios representing different demand levels and levels of AV market penetration. Iowa DOT developed the TTI curves, which spanned multiple periods and potential futures, into summary measures. The study showed that the best investment in the corridor includes capacity expansion using a design to support AV technology. The travel time reliability analysis supported agency objectives, like reliable travel for passenger and freight vehicles, and confirmed the need to invest in corridor-wide communication technology to allow traveler information and system management and future system engineering for smart corridor infrastructure. Figure 4 shows the I-80 Automated Corridor Study performance measures used to guide selection of a preferred alternative, with the reliability-based performance measure highlighted for emphasis.
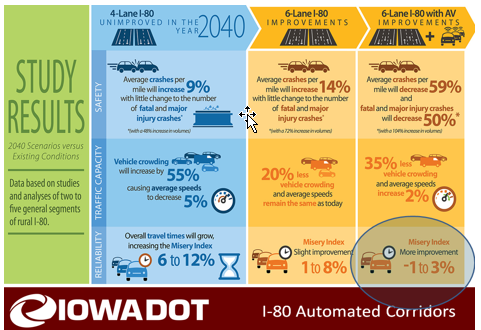
© Iowa Department of Transportation
Figure 4. Infographic. Iowa Department of Transportation results of the I-80 Automated Corridors Study.39
Wisconsin DOT Reliability and Benefit-Cost Update: Enhanced Project Selection through Travel Time Reliability Analysis
Historically, Wisconsin DOT has included a basic benefit-cost analysis component during the evaluation of its major highway projects. Recently, Wisconsin DOT's benefit-cost analysis methodology and tools were improved upon when the agency updated the travel time models used to determine user costs resulting from non-recurring delay.40
The models can be used for any roadway improvement project to assess the benefits of reducing recurring and non-recurring congestion regardless of geography or facility type. The models developed separate facility performance conditions between normal and non-recurring congestion conditions. Each type of condition occurs based on a probabilistic approach similar to the SHRP2 L08 scenario generation method (RDAT bundle). The Wisconsin DOT tool focuses on link-based annual travel metrics (e.g., vehicle miles traveled, vehicle hours traveled, crashes, etc.) that compare the base to improvement scenarios. Analysts have the flexibility to evaluate operational improvements as well as infrastructure investment scenarios. The travel time reliability analysis tool is being used to enhance the department's ability to evaluate and implement projects targeting reliability, like transportation system management.
Minnesota DOT Congestion Management Safety Plan – Enhanced Project Selection through Travel Time Reliability Analysis
The Congestion Management Safety Plan (CMSP) is a funding program that seeks to implement low-cost, high-benefit improvements to address congestion and safety problems on Minnesota DOT's (MnDOT) Metro District highway system. During the multi-phase CMSP process, researchers gather data to identify problem locations and potential solutions to address issues at the locations.
The MnDOT Phase 4 iteration of the CMSP was enhanced through the addition of travel time reliability analysis.41 42 Researchers leveraged guidance provided by the SHRP2 L02 framework and methodologies from the L07 and C11 tools to include travel time reliability as a performance measure equivalent to congestion and safety in the decision-making process. With this enhancement, Minnesota DOT gains a better understanding of areas that have bottleneck and reliability problems, including locations that are more severely impacted than expected from typical bottleneck-related congestion. The results of the CMSP are project location recommendations, backed by data-driven analysis, with a high potential for reducing congestion and crashes and improving travel time reliability.
Figure 5 captures the relationship between reliability and recurring congestion that helped MnDOT determine that their CSMP required formal consideration of a reliability measure during screening to identify low-cost, high-benefit projects.
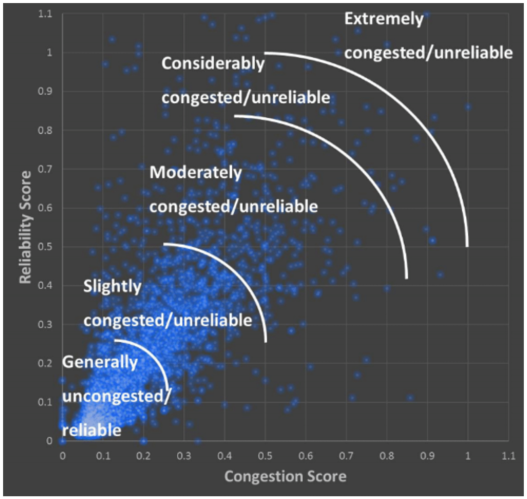
© Minnesota Department of Transportation
Figure 5. Diagram. Relationship between reliability and congestion.43
Figure 6 depicts the growing number of factors required to complete analysis when moving between congestion, safety, and reliability analysis. By reaching the point of consideration of non-recurring factors, the method is inherently more sensitive to transportation system management improvements, but the cost or data requirements to consider non-recurring factors represents only a marginal increase over the existing methods for conducting safety analysis.
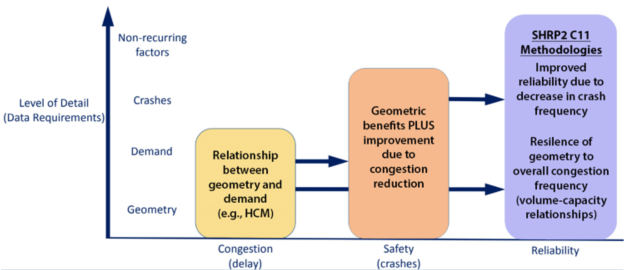
© Minnesota Department of Transportation
Figure 6. Diagram. Increasing number of factors required to complete analysis when moving between congestion, safety, and reliability.44
1 FHWA. 2017. Final Rule. "National Performance Management Measures; Assessing Performance of the National Highway System, Freight Movement on the Interstate System, and Congestion Mitigation and Air Quality Improvement Program." Federal Register 82, No. 11 January 18, 2017): 5970-6050. Available at https://www.govinfo.gov/content/pkg/FR-2017-01-18/pdf/2017-00681.pdf, last accessed March 11, 2019. [ Return to Note 1 ]
2 FHWA. 2015. Incorporating Travel-Time Reliability into the Congestion Management Process (CMP): A Primer, FHWA-HOP-14-034, Washington, DC. Available at https://ops.fhwa.dot.gov/publications/fhwahop14034/index.htm, last accessed March 11, 2019. Also, associated workshop slides provided by Jim Hunt, FHWA Office of Operations. [ Return to Note 2 ]
3 FHWA. Performance-Based Planning, Metro Portland Case Study, Washington, DC. Available at https://www.fhwa.dot.gov/planning/performance_based_planning/case_studies/, last accessed March 11, 2019. [ Return to Note 3 ]
4 Genesee Transportation Council. 2016. Long-Range Transportation Plan for the Genesee Finger-Lakes Region 2040. Available at http://www.gtcmpo.org/sites/default/files/pdf/2016/lrtp_2040.pdf, last accessed March 11, 2019. [ Return to Note 4 ]
5 Iowa Department of Transportation. 2016. TSMO Program Plan, Des Moines, IA. Available at https://www.iowadot.gov/TSMO/TSMO-Program-Plan.pdf, last accessed February 15, 2019. [ Return to Note 5 ]
6 Texas Department of Transportation. 2018. Statewide TSMO Strategic Plan. Available at https://www.txdot.gov/inside-txdot/division/traffic/tsmo.html, last accessed April 6, 2019. [ Return to Note 6 ]
7 FHWA and AASHTO. 2016. "SHRP2 Round 7 Implementation Assistance Program Webinar." Available at https://connectdot.connectsolutions.com/p57jzg06tw1?launcher=false&fcsContent=true&pbMode=normal, last accessed March 11, 2019. [ Return to Note 7 ]
8 Iowa Department of Transportation, "Interstate 80 Planning Study Automated and Connected Vehicles," presented to the 97th Annual Meeting if the Transportation Research Board, January 7–11, 2018. [ Return to Note 8 ]
9 Williges, C. et al. 2015. SHRP2 Reliability Project L38A: Pilot Testing of SHRP2 Reliability Data and Analytical Products: Southern California, Washington, DC: Transportation Research Board. Available at https://download.nap.edu/cart/download.cgi?record_id=22332, last accessed March 11, 2019. [ Return to Note 9 ]
10 Minnesota Department of Transportation and SRF Consulting, "Congestion Management Safety Plan Phase 4," presented to the 97th Annual Meeting if the Transportation Research Board, January 7–11, 2018. [ Return to Note 10 ]
11 Hadi, M. et al. 2015. SHRP2 Reliability Project L38C: Pilot Testing of SHRP 2 Reliability Data and Analytical Products: Florida, Washington, DC: Transportation Research Board. Available at https://www.nap.edu/catalog/22331/pilot-testing-of-shrp-2-reliability-data-and-analytical-products-florida, last accessed March 11, 2019. [ Return to Note 11 ]
12 FHWA. 2015. Incorporating Travel-Time Reliability into the Congestion Management Process (CMP): A Primer, FHWA-HOP-14-034, Washington, DC. Available at https://ops.fhwa.dot.gov/publications/fhwahop14034/index.htm, last accessed March 11, 2019. Also, associated workshop slides provided by Jim Hunt, FHWA Office of Operations. [ Return to Note 12 ]
13 FHWA. 2016. The Use of Data in Planning for Operations: State-of-the-Practice Review, FHWA-HRT-15-071, Washington, DC. Available at https://www.fhwa.dot.gov/publications/research/operations/15071/index.cfm, last accessed March 11, 2019. [ Return to Note 13 ]
14 FHWA. 2014. Applying Archived Operations Data in Transportation Planning – A Primer, FHWA-HOP-14-034, Washington, DC. Available at https://ops.fhwa.dot.gov/publications/fhwahop16082/index.htm. [ Return to Note 14 ]
15 Iowa Department of Transportation, "Interstate 80 Planning Study Automated and Connected Vehicles," presented to the 97th Annual Meeting if the Transportation Research Board, January 7–11, 2018. [ Return to Note 15 ]
16 Pretorius, P., L. Burgess, et al. 2011. SHRP 2 Report S2-L01-RR-1, Integrating Business Processes to Improve Travel Time Reliability, Washington, DC: Transportation Research Board. Available at http://www.trb.org/Publications/Blurbs/165283.aspx, last accessed March 11, 2019. [ Return to Note 16 ]
17 Missouri Department of Transportation. n.d. MoDOT Engineering Policy Guide, "616.13 Work Zone Capacity, Queue and Travel Delay." Available at http://epg.modot.org/index.php?title=616.13_Work_Zone_Capacity%2C_Queue_and_Travel_Delay, last accessed March 11, 2019. [ Return to Note 17 ]
18 This strategy is called by various names, including rolling road block, continuously moving work zone, precision rolling slowdown, etc. [ Return to Note 18 ]
19 National Cooperative Highway Research Program. 2014. NCHRP 20-68A, Advances in Strategies For Implementing Integrated Corridor Management (ICM), Washington, DC: American Association of State Highway and Transportation Officials. Available at http://onlinepubs.trb.org/onlinepubs/nchrp/docs/NCHRP20-68A_12-02.pdf, last accessed March 11, 2019. [ Return to Note 19 ]
20 Dion, F. and A. Skabardonis. 2015. San Diego I-15 Demonstration Integrated Corridor Management System PATH Report on Stage 3: Site Demonstration and Evaluation, CA15-2165, Sacramento, CA: California Department of Transportation. Available at http://www.dot.ca.gov/newtech/researchreports/reports/2015/CA15-2165_FinalReport.pdf, last accessed March 11, 2019. [ Return to Note 20 ]
21 U.S. Department of Transportation, Intelligent Transportation System Joint Program Office (ITS JPO). 2015. Final Report: Dallas Integrated Corridor Management (ICM) Demonstration Project, FHWA-JPO-16-234, Washington, DC: ITS JPO. Available at https://rosap.ntl.bts.gov/view/dot/3573, last accessed March 11, 2019. [ Return to Note 21 ]
22 Transportation Research Board, NCHRP 03-128: Business Intelligence Techniques for Transportation Agency Decision Making, Problem Statement on TSMO Business Intelligence and DSS/RFP, 2018. Available at http://apps.trb.org/cmsfeed/TRBNetProjectDisplay.asp?ProjectID=4352, last accessed March 11, 2019. [ Return to Note 22 ]
23 FHWA. 2015. Incorporating Travel-Time Reliability into the Congestion Management Process (CMP): A Primer, FHWA-HOP-14-034, Washington, DC. Available at https://ops.fhwa.dot.gov/publications/fhwahop14034/index.htm, last accessed March 11, 2019. Also, associated workshop slides provided by Jim Hunt, FHWA Office of Operations. [ Return to Note 23 ]
24 FHWA. 2015. Incorporating Travel-Time Reliability into the Congestion Management Process (CMP): A Primer, FHWA-HOP-14-034, Washington, DC. Available at https://ops.fhwa.dot.gov/publications/fhwahop14034/index.htm, last accessed March 11, 2019. Also, associated workshop slides provided by Jim Hunt, FHWA Office of Operations. [ Return to Note 24 ]
25 FHWA. 2015. Incorporating Travel-Time Reliability into the Congestion Management Process (CMP): A Primer, FHWA-HOP-14-034, Washington, DC. Available at https://ops.fhwa.dot.gov/publications/fhwahop14034/index.htm, last accessed March 11, 2019. Also, associated workshop slides provided by Jim Hunt, FHWA Office of Operations. [ Return to Note 25 ]
26 FHWA. n.d. Office of Operations staff presentation, "Transportation Network Operational Strategy (T-NOPS), Planning and Operating for Performance." [ Return to Note 26 ]
27 Rhode Island Division of Planning. 2016. EconWorks Wider Economic Benefits Tools Implementation Assistance Final Report. [ Return to Note 27 ]
28 Wasatch Front Regional Council, Utah DOT. n.d. "EconWorks SHRP2 Tool Testing," presentation provided by HDR. [ Return to Note 28 ]
29 Transportation Research Board, NCHRP 03-128: Business Intelligence Techniques for Transportation Agency Decision Making, Problem Statement on TSMO Business Intelligence and DSS/RFP, 2018. Available at http://apps.trb.org/cmsfeed/TRBNetProjectDisplay.asp?ProjectID=4352, last accessed March 11, 2019. [ Return to Note 29 ]
30 Cambridge Systematics. 2016. NCHRP 20-07 Task 365: Transportation Systems Management and Operations Program Planning –Experiences from the SHRP 2 Implementation Assistance Program, Washington, DC: National Cooperative Highway Research Program. Available at http://onlinepubs.trb.org/onlinepubs/nchrp/docs/NCHRP20-07(365)_FR.pdf, last accessed March 11, 2019. [ Return to Note 30 ]
31 Sobolewski, M., T. Polum, P. Morris, R. Loos, and K. Anderson. 2015. SHRP2 L38B Pilot Testing of SHRP2 Reliability Data and Analytical Products: Minnesota, Washington, DC: Transportation Research Board. Available at https://www.nap.edu/catalog/22255/pilot-testing-of-shrp-2-reliability-data-and-analytical-products-minnesota, last accessed March 31, 2019. Note 31 ]
32 Florida Department of Transportation. 2016. Planning for Travel Time Reliability Guide, Tallahassee, FL. Available at https://fdotwww.blob.core.windows.net/sitefinity/docs/default-source/content/planning/fto/mobility/ttrguide2017.pdf?sfvrsn=84848e9c_0, last accessed March 31, 2019. Note 32 ]
33 FHWA. 2017. Final Rule. "National Performance Management Measures; Assessing Performance of the National Highway System, Freight Movement on the Interstate System, and Congestion Mitigation and Air Quality Improvement Program." Federal Register 82, No. 11 January 18, 2017): 5970-6050. Available at https://www.govinfo.gov/content/pkg/FR-2017-01-18/pdf/2017-00681.pdf, last accessed March 11, 2019. Note 33 ]
34 Colorado Secretary of State. SMART Act Web page. Available at https://www.sos.state.co.us/pubs/newsRoom/SMART-Act/index.html, last accessed March 17, 2019. Note 34 ]
35 State of Colorado. Performance Management and Operations, Increase Travel Time Reliability in Two Corridors Web Page. Available at https://www.colorado.gov/pacific/performancemanagement/increase-travel-time-reliability-two-corridors, last accessed on January 30, 2018. Note 35 ]
36 Colorado Department of Transportation. Library, Annual Reports and Plans Web page, https://www.codot.gov/library/AnnualReports, last accessed on November 1, 2018. Note 36 ]
37 Colorado Department of Transportation. 2017. CDOT FY 2017-18 Performance Plan. Available at https://www.codot.gov/library/AnnualReports/cdot-annual-performance-reports-plans/2017-2018-performance-plan, last accessed March 21, 2019. Note 37 ]
38 National Cooperative Highway Research Program. 2014. NCHRP 20-68A, Advances in Strategies For Implementing Integrated Corridor Management (ICM), Washington, DC: American Association of State Highway and Transportation Officials. Available at http://onlinepubs.trb.org/onlinepubs/nchrp/docs/NCHRP20-68A_12-02.pdf, last accessed March 11, 2019. Note 38 ]
39 Iowa Department of Transportation, "Interstate 80 Planning Study Automated and Connected Vehicles," presented to the 97th Annual Meeting if the Transportation Research Board, January 7–11, 2018. Note 39 ]
40 Wisconsin Department of Transportation. 2015. WisDOT Benefit-Cost Analysis Evaluation and Update – Technical Documentation Report. Note 40 ]
41 FHWA. 2018. "Case Examples of Integrating Reliability into Planning for Operations," unpublished internal report. Note 41 ]
42 Minnesota Department of Transportation and SRF Consulting, "Congestion Management Safety Plan Phase 4," presented to the 97th Annual Meeting if the Transportation Research Board, January 7–11, 2018. Note 42 ]
43 Minnesota Department of Transportation and SRF Consulting, "Congestion Management Safety Plan Phase 4," presented to the 97th Annual Meeting if the Transportation Research Board, January 7–11, 2018. Note 43 ]
44 Minnesota Department of Transportation and SRF Consulting, "Congestion Management Safety Plan Phase 4," presented to the 97th Annual Meeting if the Transportation Research Board, January 7–11, 2018. Note 44 ]