Integrating Travel Time Reliability into Transportation System Management: Final Technical Memorandum
Appendix. Hypothetical Scenarios
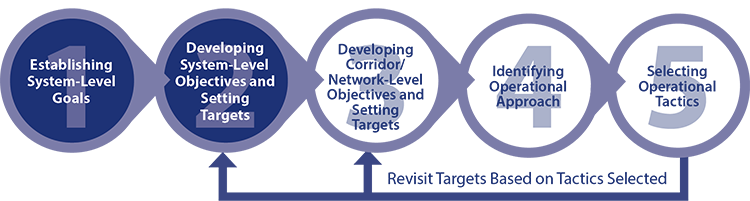
The appendix presents the application of the methodology to four hypothetical scenarios developed in the project:
- Scenario 1: Statewide Rural Interstate Corridor.
- Scenario 2: Freight Corridor Important to Interstate Commerce.
- Scenario 3: Small City.
- Scenario 4: Large Urban Subarea.
Scenario 1: Application of Methodology to Statewide Rural Interstate Corridor
This section describes the first of four scenarios that will be used to illustrate the methodology. Scenario 1 is focused on a rural, east-west interstate corridor, as illustrated in figure 15.
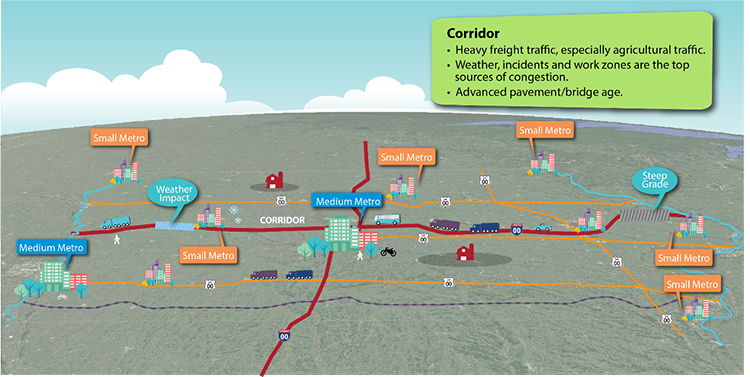
Source: FHWA.
Figure 15. Map. Scenario 1: A rural east-west interstate corridor and geographic context.
Context of the Statewide Rural Corridor
The geographic, multimodal, and freight transportation context for the corridor is described below. It should be assumed that transportation agencies within the State have a baseline of operational capabilities on which to build.
Geographic Setting
- The State is inland with a mostly flat topography.
- The State's land area is approximately 50,000 square miles, and is within the middle third of U.S. States for land area.
- The State has a single east-west corridor over a distance of 300 miles that is dominated by an interstate with distant parallel State highways. A second corridor serves traffic traveling north and south.
- The east-west interstate is the focus corridor.
National Highway System and Freight Context
- Multiple interstate highways and routes on the National Highway System cross the State.
- The main interstate corridor experiences heavy east-west travel between the coasts and major metropolitan areas.
- The east-west corridor also carries interregional travel and intra-city traffic for a small metropolitan region located along the corridor.
- The freight system relies heavily on long-haul trucking to carry intrastate freight and primarily utilizes short-haul trucking to freight hubs for locally produced goods.
- An extensive freight railroad network crisscrosses the State, primarily carrying commodities through the State. A freight rail line parallels the east-west interstate corridor.
Population
- The State population is less than five million.
- The State includes 10 small to medium sized metropolitan areas (greater than 50,000 population).
- Five of the relatively larger metropolitan areas are connected by the east-west corridor. Other metropolitan areas are dispersed with several founded as river-based communities and now operating as multistate metropolitan areas.
Highway Characteristics and Usage
- The State contains one nationally significant east-west interstate corridor and one nationally significant north-south interstate corridor.
- The State includes several other regionally significant U.S. highways and portions of State highways that support interstate commerce.
- The two largest metropolitan areas have more extensive National Highway System (NHS) coverage connecting suburban communities to the urban core
- The focus corridor runs 300 miles in the State, through five metro areas and rural land areas.
- The corridor's pavement and some bridges are nearing the retirement stage.
- Nearly 30 percent of the volume on the corridor are freight trucks. Freight growth is expected to continue to increase dramatically over the next 30 years.
- The corridor experiences hot summers and snow-filled winters, leading to maintenance and operation challenges to preserve pavement quality while maintaining traffic flow.
- The corridor experiences predominantly non-recurring delays in rural areas from work zones, severe weather, and traffic incidents.
Multimodal Network
- People use predominantly single occupancy vehicles (SOVs) for the journey to work in metropolitan areas.
- Larger metropolitan areas have fixed-route buses and demand-responsive service for the mobility impaired.
- The State has a strong recreational bike and pedestrian culture, predominantly around urban special uses or the mature scenic trails network.
- The corridor of focus carries exclusively passenger cars and trucks, except where crossing metropolitan boundaries and buses are in operation on the highway.
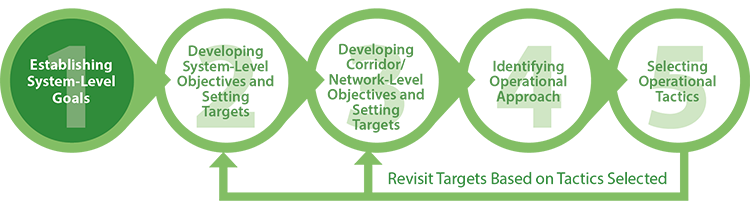
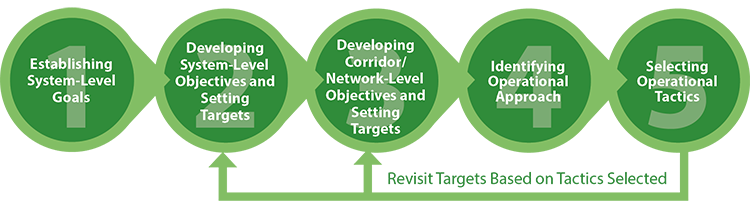
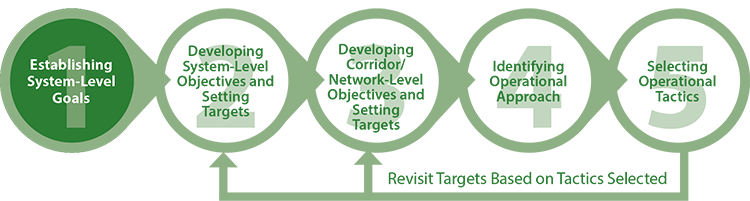
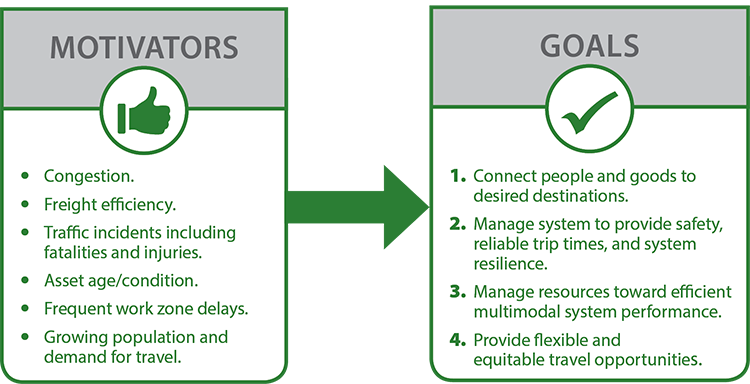
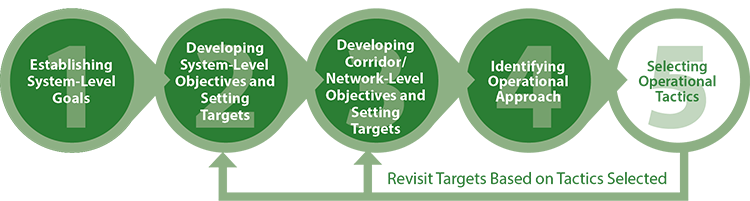
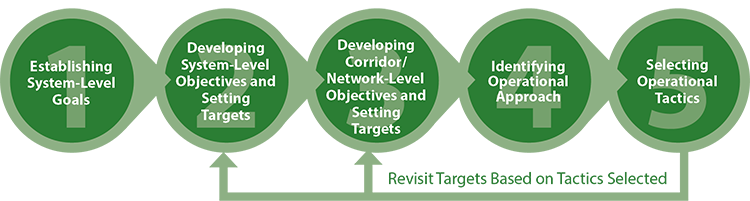
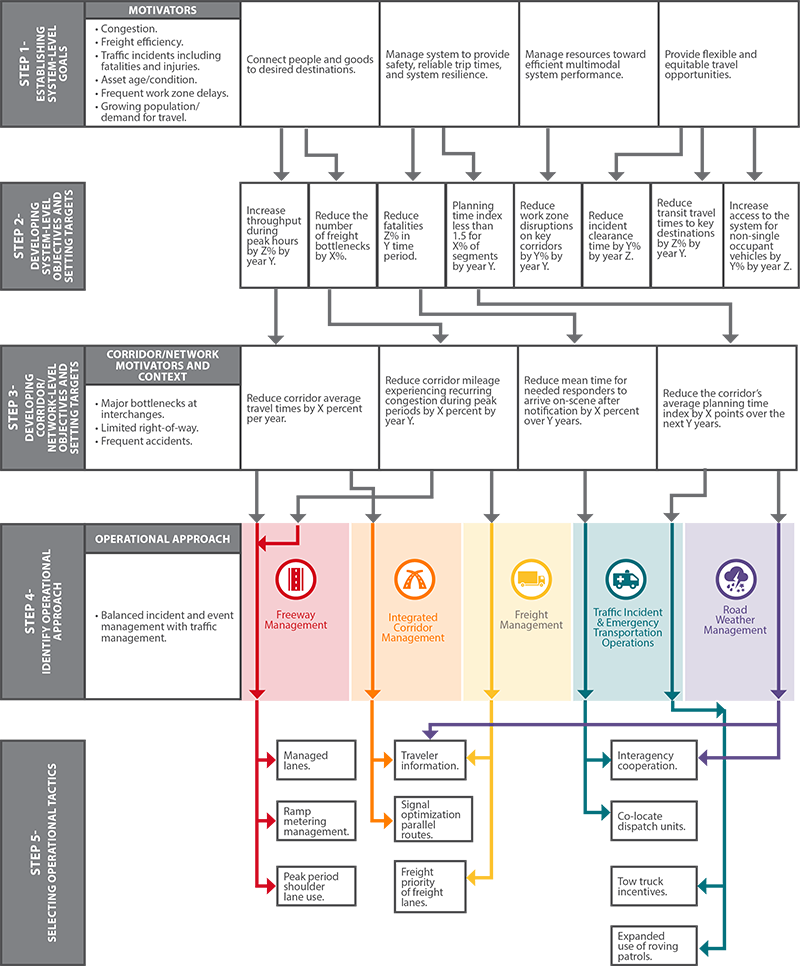
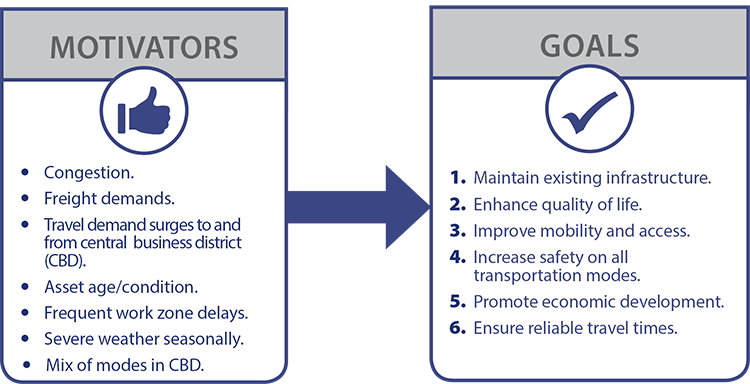
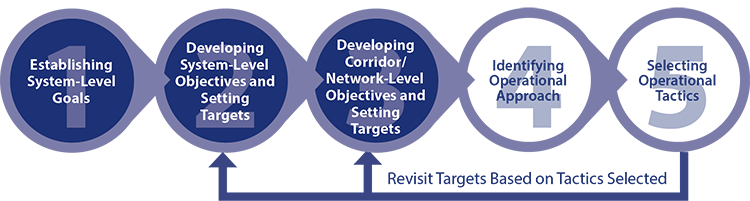
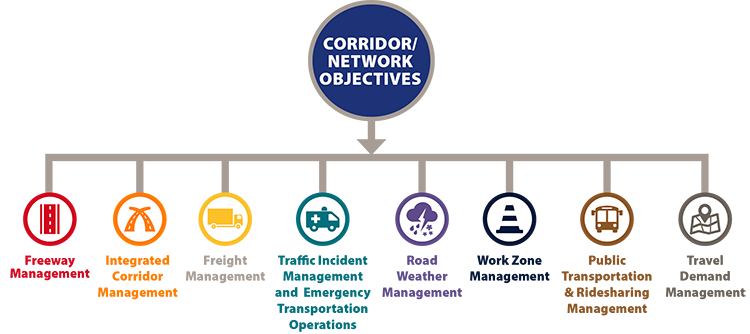
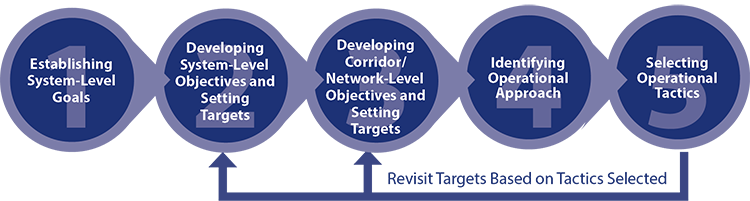
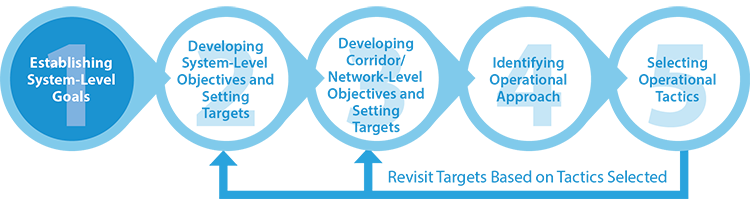
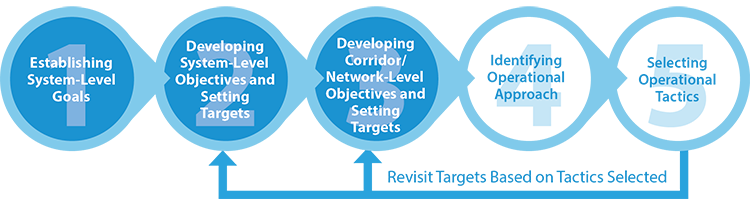
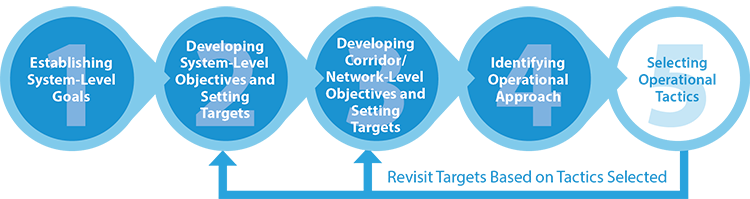
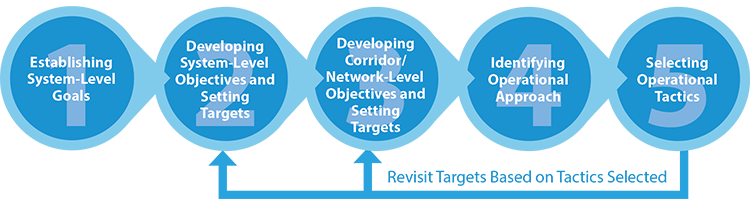
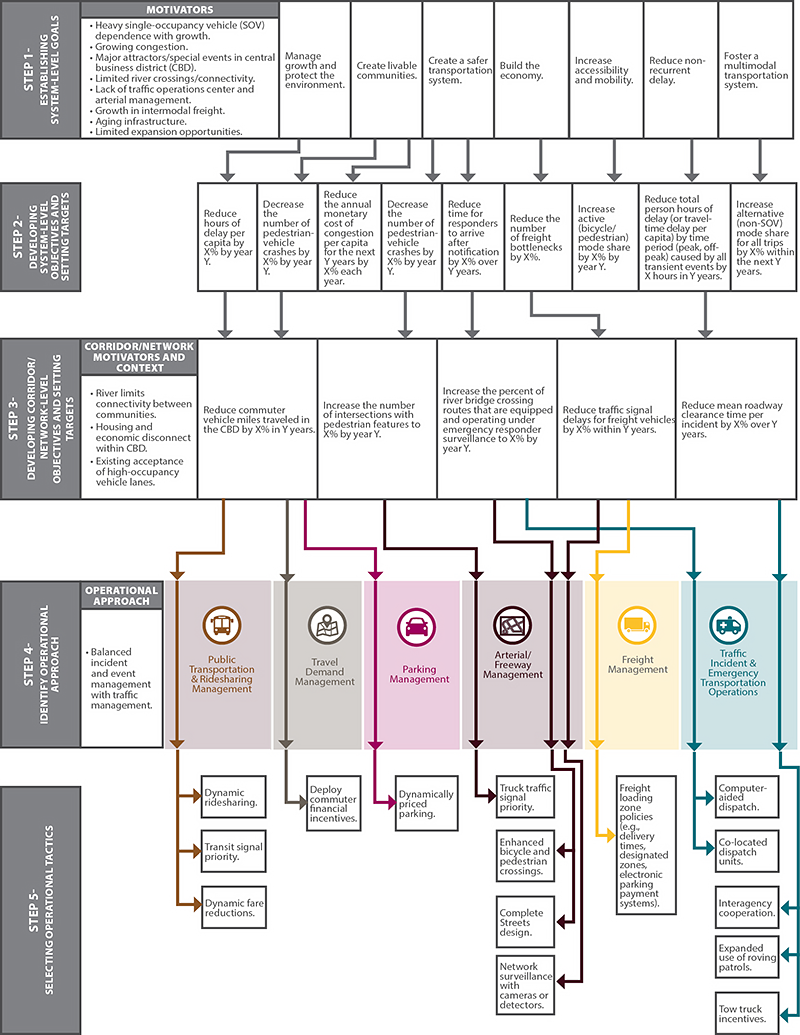
Establishing System Level Goals
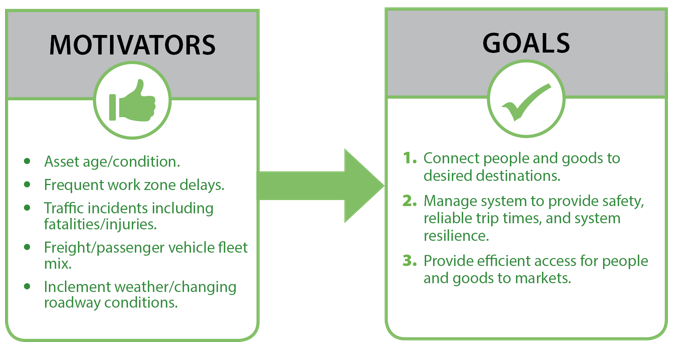
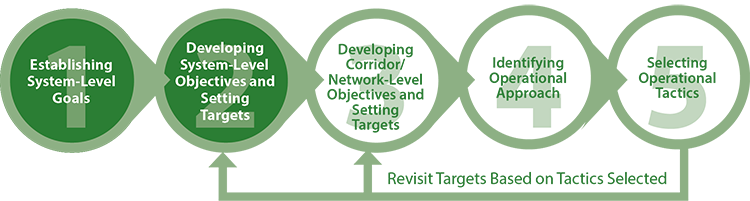
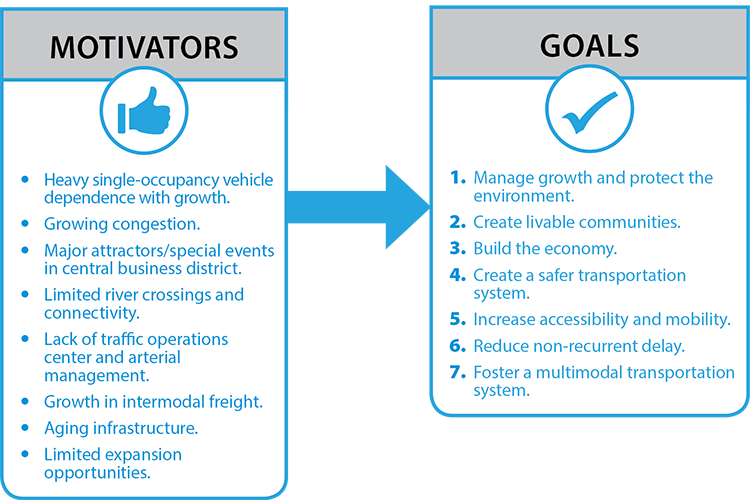
The development of system-level goals is the first step in the methodology (figure 16). System-level goals are derived from the list of motivators as shown in figure 17.
Source: FHWA.
Figure 16. Diagram. Scenario 1: The first step of the methodology is establishing system level goals.
Application of Reliability Data and Analysis Tools (RDAT): At the goal-setting stage, a useful reliability tool is the travel-time reliability monitoring system (TTRMS) described in the Second Strategic Highway Research Program (SHRP2) L02 monitoring guide. It could be used to help identify some of the motivators listed in figure 17—most notably in this scenario, work zone delays, incidents, and inclement weather.
Source: FHWA.
Figure 17. Diagram. Scenario 1: Motivators for improvement in the corridor lead to goals.
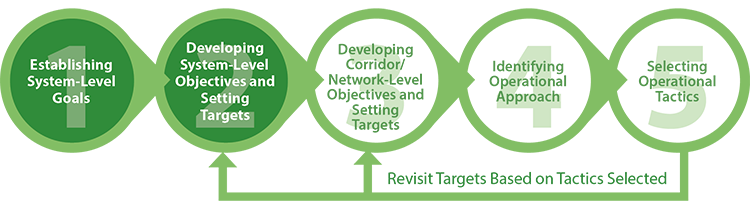
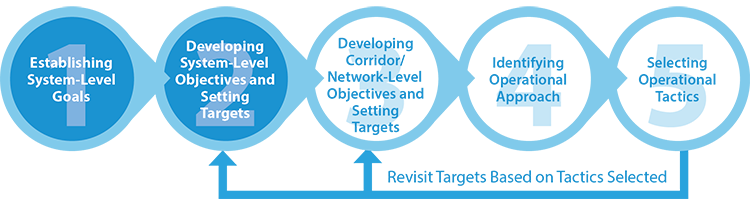
Developing System-level Objectives and Setting Targets
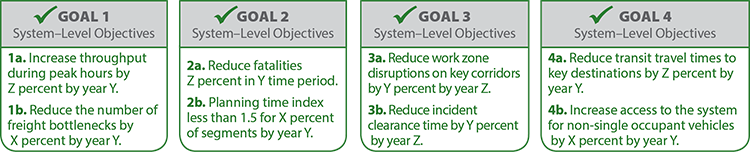
The second step of the methodology is developing system-level objectives and setting performance targets, as shown in figure 18.
Source: FHWA.
Figure 18. Diagram. Scenario 1: The second step of the methodology is to develop system-level objectives and set targets.
Application of RDAT Tools: At the stage of setting system-level objectives and targets, the primary usefulness of RDAT tools is in the establishment of existing and historical conditions to support the following:
- Setting a baseline: Collecting system-wide travel-time data along a statewide corridor can be a challenging task. The SHRP2 L02 monitoring guide and SHRP2 L05 performance measures can support this step. In this scenario, travel-time distributions, especially in the rural areas, would have a long tail (i.e., a large number of times far from the center of the distribution) due to the contributions of non-recurrent congestion. This could be further analyzed by breaking down congestion sources, which could then influence objectives.
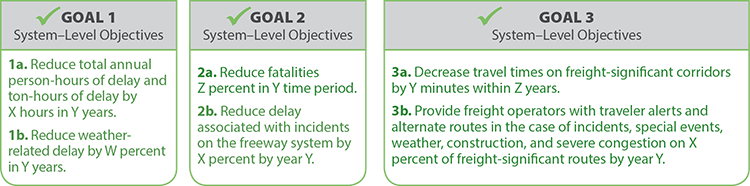
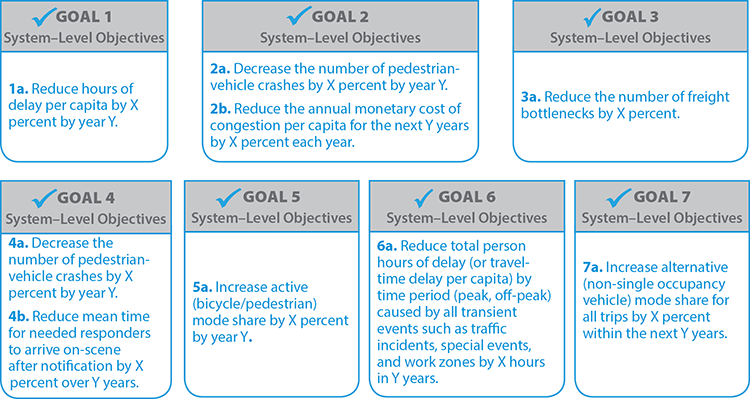
- Identifying sources of congestion: In this scenario, Objective 2b (figure 19) is related to delay associated with incidents. Although infrequent in rural areas, incidents can have significant effects on travel times due to limited capacity on rural facilities as well as limited options for diversion. Objective 3b, related to travel alerts for freight operators, is similar but broader, covering incidents, work zones, special events, and weather.
- Establishing system-level performance measures: Although many of the measures described below are more related to average delay and not variation in delay, reliability measures are worth developing at this stage.
- Setting thresholds: At the statewide level, it is important to keep measures disaggregated by facility type, because the reliability issues on rural facilities are much different than those on urban and suburban facilities. The L05 handbook discusses setting thresholds based on data from comparable national corridors versus setting them based on local expectations.
Source: FHWA.
Figure 19. Diagram. Scenario 1: System-level objectives and targets for realizing system goals.
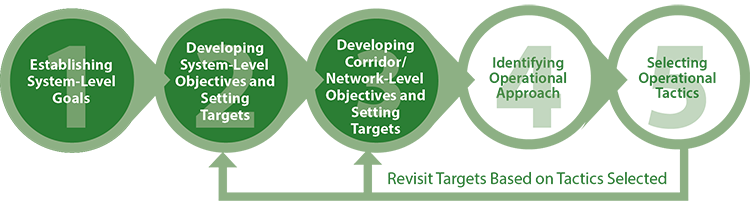
Developing Corridor-Level Objectives and Setting Targets
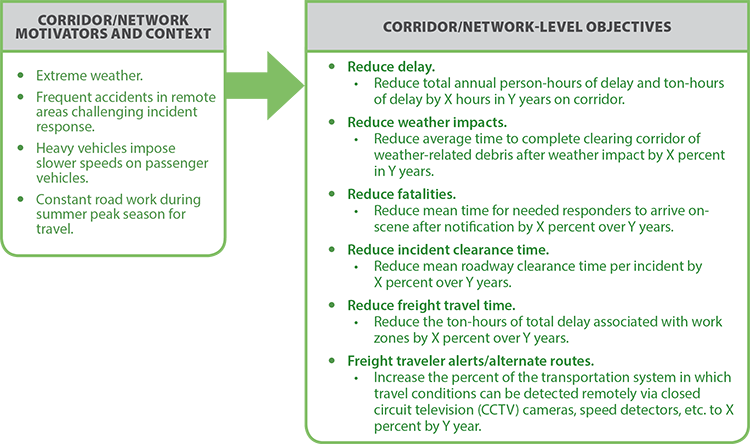
In the third step of the methodology, corridor-level objectives are developed to support the achievement of the system-level objectives (figure 20). Each system-level objective for State 1 was linked to a single corridor-level objective, although there could be many corridor-level objectives that would also support the system-level objectives defined in figure 21.
Source: FHWA.
Figure 20. Diagram. Scenario 1: The third step of the methodology is to develop corridor-level objectives and set targets.
Application of RDAT Tools: On the focus corridor for Scenario 1, reliability performance measures are considered more important than they are at the statewide level. Incident response time, incident clearance time, weather-related debris clearance, and traveler alerts all have direct relationships to reliability.
Source: FHWA.
Figure 21. Diagram. Scenario 1: Corridor motivators and system-level objectives drive the development of the corridor-level objectives and targets.
Identifying an Operational Approach
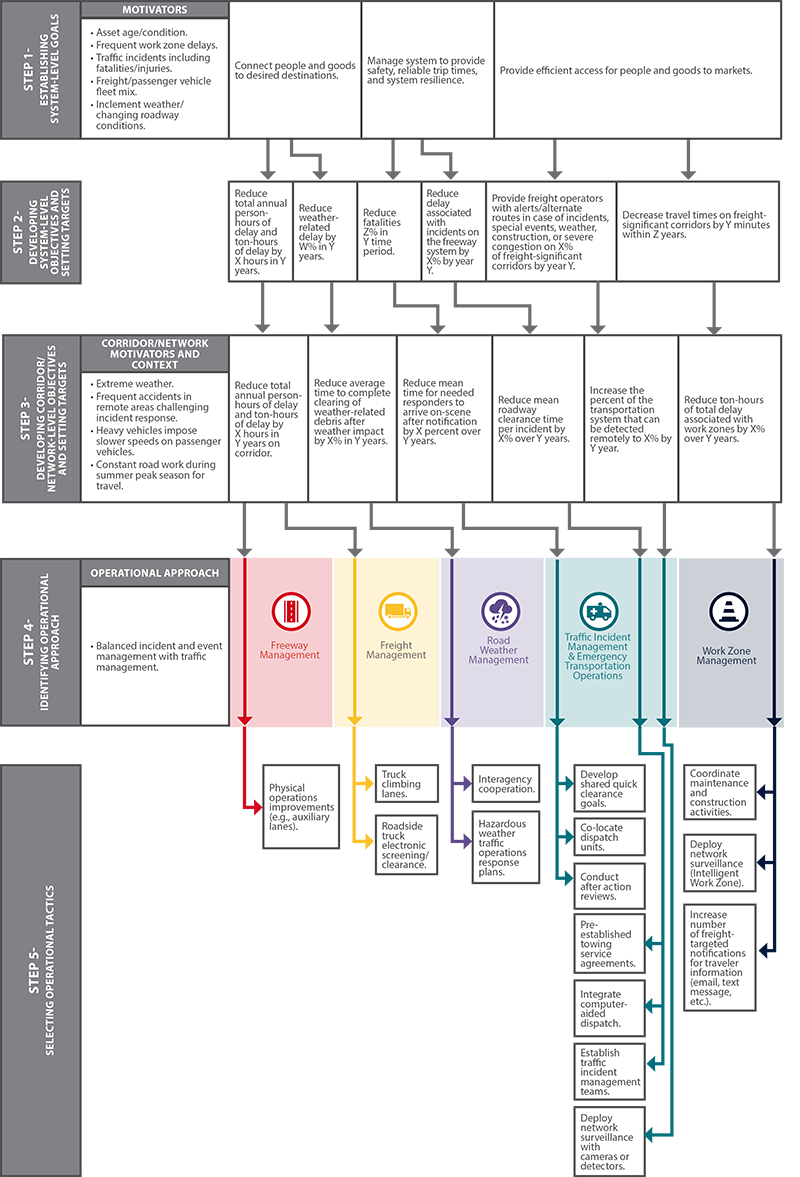
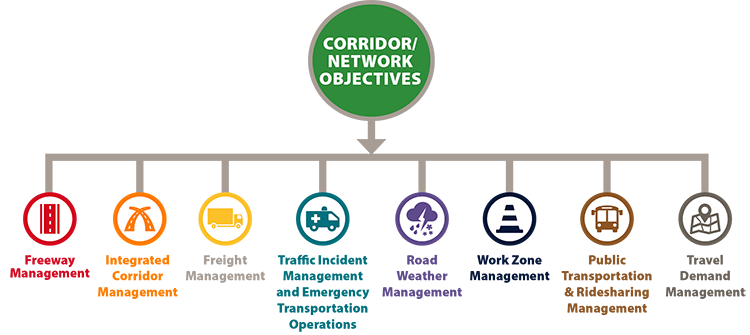
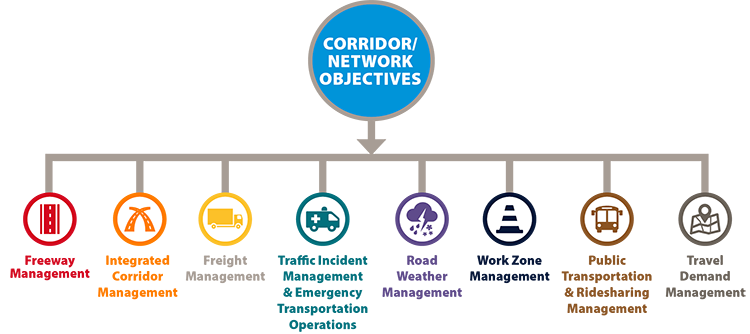
In this step (figure 22), an overarching approach for managing and operating the corridor or network is created. A universe of tactical program areas is available to support this step. These are then assessed against corridor-level objectives. In this example, only the one or two most practical technical program areas were selected from this universe to form the next-level decision in identifying tactics. Once the example tactical program areas were assigned for all corridor-level objectives, the corridor-level objectives were depicted as a tree sprouting off all included tactical program areas (figure 23).
Source: FHWA.
Figure 22. Diagram. Scenario 1: The fourth step of the methodology is to identify an operational approach for achieving the corridor-level objectives.
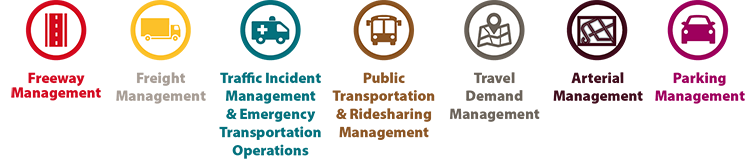
Application of RDAT Tools: In this scenario, identifying reliability issues, and the congestion sources associated with them, could point the way toward reliability-related program areas such as freeway management, road weather management, and traffic incident management/emergency transportation operations.
The tactical program areas identified to support each corridor-level objective are listed below:
- Reduce total annual person-hours of delay and ton-hours of delay by X hours in Y years on corridor.
- Freeway Management and Freight Management.
- Reduce average time to complete clearing corridor of weather-related debris after weather impact by X percent in Y years.
- Road Weather Management.
- Reduce mean time for needed responders to arrive on-scene after notification by X percent over Y years.
- Traffic Incident Management and Emergency Transportation Operations.
- Reduce mean roadway clearance time per incident by X percent over Y years.
- Traffic Incident Management and Emergency Transportation Operations.
- Reduce the ton-hours of total delay associated with work zones by X percent over Y years.
- Work Zone Management.
- Increase the percent of the transportation system in which travel conditions can be detected remotely via CCTV, speed detectors, etc. to X percent by Y year.
- Traffic Incident Management and Emergency Transportation Operations.

Source: FHWA.
Figure 23. Diagram. Scenario 1: The operational approach contains tactics from one or more tactical program areas.
Selecting Operational Tactics
Shown in figure 24, Step 5, selecting tactics, requires expert judgment of leaders within each tactical program area to determine the corridor's fit with potential tactics. The experts within each area must be consulted in a collaborative fashion to negotiate the best selection of assorted tactics from divergent tactical program areas to make sure each tactic is applied in a complementary fashion.
Following the process to this stage may lead to tactics in one program area that call for using physical space on the roadway or a specific tactical area to support one objective that, based on design, could be in contrast with another corridor-level objective. An integrated approach to selecting tactics allows the selected methods to be applied in a cooperative fashion and can help rule out tactics that do not support the greater aim.
Source: FHWA.
Figure 24. Diagram. Scenario 1: The fifth step of the methodology is to select operational tactics to execute the operational approach.
Application of RDAT Tools: Example RDAT applications for this scenario include:
- FREEVAL and SHRP2 L07 could be used to analyze tactics related to the sources of non-recurring congestion—tactics such as hazardous weather response plans, quick clearance goals, towing service agreements, computer-aided dispatch (CAD), traffic incident management (TIM) teams, intelligent work zones, and freight-targeted traveler information.
- The SHRP2 L02 monitoring guide also has an application at this stage, supporting the feedback loop shown between Step 5 and Steps 2 and 3. An ongoing monitoring program can gauge the effectiveness of implemented tactics, and allow operating agencies or planners to refine objectives and targets on a longer-term basis.
Because these tools are based on segments and corridors, results need to be developed for each segment or corridor and aggregated to a system level, a fairly cumbersome task (especially at the statewide level). For scenario 1, it might be best to choose a representative sample of highway corridors/segments for analysis and aggregation.
Below are the tactics identified to support the achievement of each corridor-level objective (see Figure 25):
- Reduce total annual person-hours of delay and ton-hours of delay by X hours in Y years on corridor.
- Freeway Management and Freight Management.
- Construct physical operations improvements (e.g., auxiliary lanes).
- Install truck climbing lanes.
- Implement roadside truck electronic screening/clearance.
- Freeway Management and Freight Management.
- Reduce average time to complete clearing corridor of weather-related debris after weather impact by X percent in Y years.
- Road Weather Management.
- Interagency cooperation.
- Create hazardous weather traffic operations response plans.
- Road Weather Management.
- Reduce mean time for needed responders to arrive on-scene after notification by X percent over Y years.
- Traffic Incident Management and Emergency Transportation Operations.
- Co-locate dispatch units.
- Develop shared quick clearance goals.
- Conduct after action reviews (AARs).
- Traffic Incident Management and Emergency Transportation Operations.
- Reduce mean roadway clearance time per incident by X percent over Y years.
- Traffic Incident Management and Emergency Transportation Operations.
- Pre-established towing service agreements.
- Integrate CAD.
- Establish TIM teams.
- Traffic Incident Management and Emergency Transportation Operations.
- Reduce the person hours (or vehicle hours) of total delay associated with work zones by X percent over Y years.
- Work Zone Management.
- Coordinate maintenance and construction activities.
- Deploy network surveillance (Intelligent Work Zone).
- Increase number of freight-targeted notifications for traveler information (e.g., e-mail, text message) by X percent in Y years.
- Work Zone Management.
- Increase the percent of the transportation system in which travel conditions can be detected remotely via cameras, speed detectors, etc., to X percent by Y year.
- Traffic Incident Management and Emergency Transportation Operations.
- Deploy network surveillance with cameras or detectors.
- Traffic Incident Management and Emergency Transportation Operations.

Source: FHWA.
Figure 25. Diagram. Scenario 1: Tactics from these tactical program areas were selected for the operational approach.
Figure 26 illustrates the application of the full methodology for a statewide rural interstate corridor, as illustrated in this scenario, and shows connections between the steps. The linkages between the steps is typically much more iterative than shown in this more simplified illustration. As information is gained or decisions are made in later steps, the output of earlier steps will be revisited.
Source: FHWA.
Figure 26. Diagram. Scenario 1: Application of methodology to statewide rural interstate corridor.
Scenario 2: Application of Methodology to a Freight Corridor Important to Interstate Commerce
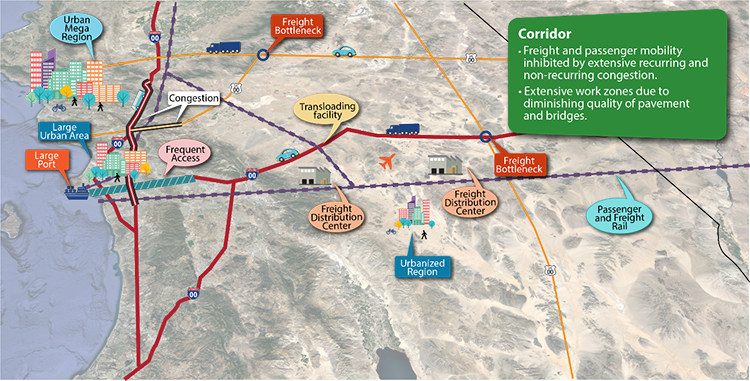
This section describes the second of four scenarios that will be used to illustrate the methodology. Scenario 2 is an east-west freight corridor, as illustrated in figure 27.
Source: FHWA.
Figure 27. Map. Scenario 2: An east-west freight corridor and geographic context.
Context of the Freight Corridor
The geographic, multimodal, and freight transportation context for the corridor is described below. It should be assumed that transportation agencies within the corridor have a baseline of operational capabilities on which to build.
Geographic Setting
- The corridor is in a large State with a land area of approximately 100,000 square miles and is bordered by an ocean.
- The focus corridor has an east-west orientation and has a major shipping port and large urban areas on its west end and agricultural areas to its east and north. The port is a significant international port of entry.
National Highway System and Freight Context
- The State containing this corridor is the terminus for multiple interstate highways and routes on the NHS.
- The State has an extensive highway network with direct connections to metropolitan areas in adjacent States as well as connections to large and small communities within the State.
- The corridor has extensive freight railroad lines tied to ports and regional freight distribution centers.
- The corridor has significant air traffic due to its dense population centers and distance from producers and consumers in other States.
- The urban megaregion is served by a Class 1 railroad.
- A major rail intermodal facility supports transferring shipping containers between rail and trucks.
Population
- The State has a population greater than 15 million.
- The State includes a few very large urban areas and thousands of small communities due to its large land area.
Highway Characteristics and Usage
- Nationally significant corridors in the State traverse metro areas and rural communities, connecting ports and airfields, intermediate buyers, manufacturing, and retail suppliers.
- The focus corridor connects all of these freight parties both within the State and within adjacent States before products are dispersed through the wider national freight system.
- The corridor includes a major interstate and freight rail line. It covers just under 200 miles within the State and crosses a few other nationally significant highways outside the urban core area that are freight bottlenecks.
- The major interstate along the corridor provides interchange access within the urban core nearly every mile for 60 miles in the densest portion of the metro.
- The corridor provides high-occupancy vehicle lanes between the suburbs and the urban core.
Multimodal Network
- The State sees a mix of single occupant vehicles, shared ride services, medium and large trucks, metro and regional transit buses, light rail, a subway, airports near major roadways, and bicycle and pedestrian infrastructure in the urban core, recreational areas, and supportive suburban communities.
- The corridor experiences the multimodal traffic through heavy and light-rail, urban buses, and freight trucks.
- The corridor parallels a multi-track freight rail that has a shared-use agreement to provide infrequent interstate passenger rail service.
Establishing System-Level Goals
The development of system-level goals is the first step in the methodology (see figure 28). System-level goals are derived from the list of motivators as shown in figure 29.
Source: FHWA.
Figure 28. Diagram. Scenario 2: The first step of the methodology is establishing system level goals.
Source: FHWA.
Figure 29. Scenario 2: Motivators for improvement in the corridor lead to goals.
Application of RDAT Tools: The SHRP2 L05 performance measures guide and SHRP2 L02 monitoring guide are relevant for this step. A travel-time reliability monitoring system could be used to help identify some of the motivators listed in figure 29—most notably for scenario 2, freight efficiency, incidents, and work zone delay.
Developing System-Level Objectives and Setting Targets
The second step of the methodology is to develop system-level objectives and set targets (figure 30).
Source: FHWA.
Figure 30. Diagram. Scenario 2: The second step of the methodology is to develop system-level objectives and set targets.
Application of RDAT Tools: At the stage of setting system-level objectives and targets, the primary usefulness of RDAT tools is in the establishment of existing and historical conditions to support the following:
- Setting a baseline: Setting the baseline allows the analyst to identify existing systematic reliability problems, which in turn can guide—at a high level—the establishment of objectives. For example, in scenario 2, travel-time distributions along freight corridors could influence objectives, given the importance of the freight network.
- Identifying sources of congestion: Knowing the sources of system-wide congestion (both recurring and non-recurring) can help agencies focus when determining system-wide objectives. As shown in figure 31, for scenario 2, Objective 3a relates to work zone disruptions and Objective 3b focuses on incident clearance times—two different congestion sources.
- Establishing system-level performance measures: Several objectives for scenario 2 are congruent with the measures in the SHRP2 L05 handbook, including the planning time index, incident clearance time, and work zone disruption.
- Setting thresholds: The SHRP2 L05 handbook provides guidance and examples related to setting reliability thresholds. At the statewide level, it is important to keep reliability measures disaggregated by facility type, because the reliability issues on rural facilities are much different than those on urban and suburban facilities. In addition, for scenario 2, the freight corridor may be considered for different or elevated thresholds depending on how important freight is to the region; it might be worth treating as a separate facility type.
Source: FHWA.
Figure 31. Diagram. Scenario 2: System-level objectives and targets for realizing system goals.
Developing Corridor-Level Objectives and Setting Targets
In step 3 of the methodology, objectives are developed for the specific corridor (figure 32). Network and corridor-level objectives are derivatives of system-level objectives connected to a much more specific geographic context (figure 33).
Source: FHWA.
Figure 32. Diagram. Scenario 2: The third step of the methodology is to develop corridor-level objectives and set targets.
Application of RDAT Tools: On the focus corridor for this scenario, reliability performance measures somewhat mirror the system-wide measures, including such elements as incident response times, planning time index, work zone delays and additional reliability indicators such as reduced travel times and improved incident clearance times.
Source: FHWA.
Figure 33. Diagram. Scenario 2: Corridor motivators and system-level objectives drive the development of the corridor-level objectives and targets.
Identifying an Operational Approach
Identifying an operational approach and defining supportive tactical program areas is the fourth step of the methodology (figure 34).
Source: FHWA.
Figure 34. Diagram. Scenario 2: System-level objectives and targets lead to the development of corridor-level objectives to support their achievement.
Application of RDAT Tools: In scenario 2, identifying reliability issues, and the congestion sources associated with them, could point the way toward reliability-related program areas such as freeway management, integrated corridor management, road weather management, traffic incident management/emergency transportation operations, work zone management, and travel demand management.
The tactical program areas identified to support each corridor-level objective (figure 35) are listed below:
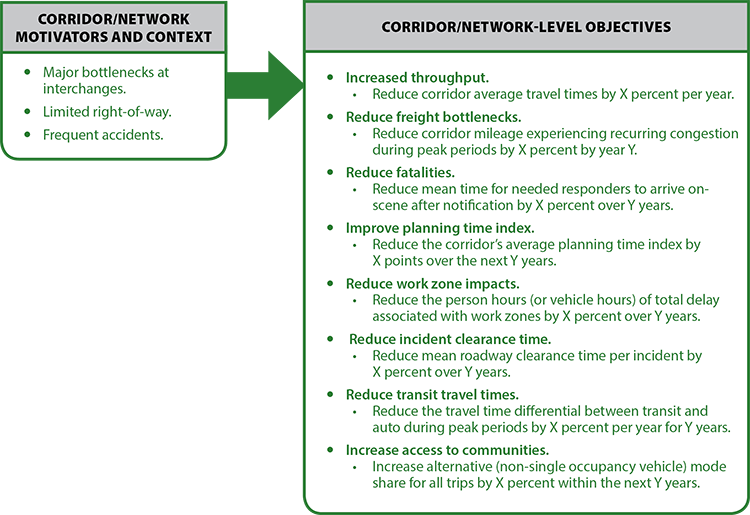
- Reduce corridor average travel times by X percent per year.
- Freeway Management and Integrated Corridor Management.
- Reduce corridor mileage experiencing recurring congestion during peak periods by X percent by year Y.
- Freeway Management and Freight Management.
- Reduce mean time for needed responders to arrive on-scene after notification by X percent over Y years.
- Traffic Incident Management and Emergency Transportation Operations.
- Reduce the corridor's average planning time index by X points over the next Y years.
- Road Weather Management and Traffic Incident Management and Emergency Transportation Operations.
- Reduce the person hours (or vehicle hours) of total delay associated with work zones by X percent over Y years.
- Work Zone Management
- Reduce mean roadway clearance time per incident by X percent over Y years.
- Traffic Incident Management and Emergency Transportation Operations.
- Reduce the travel time differential between transit and auto during peak periods by X percent per year for Y years.
- Public Transportation and Ridesharing Management.
- Increase alternative (non-single occupancy vehicle) mode share for all trips by X percent within the next Y years.
- Public Transportation and Ridesharing Management and Travel Demand Management.
Source: FHWA.
Figure 35. Diagram. Scenario 2: The operational approach contains tactics from one or more tactical program areas to achieve the corridor-level objective.
Selecting Operational Tactics
Selecting operational tactics requires the judgment of experts in each tactical program area to determine the corridor's fit with potential tactics (figure 36).
Source: FHWA.
Figure 36. Diagram. Scenario 2: The fifth step of the methodology is to select operational tactics to execute the operational approach.
Application of RDAT Tools: The RDAT tools require the user to map the effects of tactics to changes in tool inputs. For example, to evaluate a tactic such as peak-period shoulder use in this scenario, a user would have to define how capacity would vary throughout the relevant portions of the day. The L07 report provides guidance in this area.
Example RDAT applications for this scenario include:
- FREEVAL and SHRP2 L07 could be used to analyze tactics related to temporal changes in demand and capacity – tactics such as managed lanes, ramp metering, peak-period shoulder use, traveler information (to the extent that it causes diversion), freight priority/lanes, and dynamic ridesharing.
- These tools could also be used to evaluate tactics that address the impact of congestion sources – tactics such as interagency cooperation on emergency response and co-located dispatch units, tow truck incentives, and roving patrols (for efficient response times); and coordinated maintenance and construction activities (to minimize work zone impacts).
Below are the tactics identified to support the achievement of each corridor-level objective (figure 37):
- Reduce corridor average travel times by X percent per year.
- Freeway Management and Integrated Corridor Management.
- Managed lanes.
- Ramp metering/management.
- Peak period shoulder lane use.
- Traveler information.
- Signal optimization of parallel routes and ramp terminals.
- Freeway Management and Integrated Corridor Management.
- Reduce corridor mileage experiencing recurring congestion during peak periods by X percent by year Y.
- Freeway Management and Freight Management.
- Managed lanes.
- Ramp metering/management.
- Peak period shoulder lane use.
- Traveler Information.
- Freight priority or freight lanes.
- Freeway Management and Freight Management.
- Reduce mean time for needed responders to arrive on-scene after notification by X percent over Y years.
- Traffic Incident Management and Emergency Transportation Operations.
- Interagency cooperation.
- Co-locate dispatch units.
- Traffic Incident Management and Emergency Transportation Operations.
- Reduce the corridor's average planning time index by X points over the next Y years.
- Road Weather Management and Traffic Incident Management and Emergency Transportation Operations.
- Traveler Information.
- Interagency cooperation.
- Tow truck incentives.
- Expand use of roving patrols.
- Road Weather Management and Traffic Incident Management and Emergency Transportation Operations.
- Reduce the person hours (or vehicle hours) of total delay associated with work zones by X percent over Y years.
- Work Zone Management.
- Coordinate maintenance and construction activities.
- Implement dynamic warning systems.
- Work Zone Management.
- Reduce mean roadway clearance time per incident by X percent over Y years.
- Traffic Incident Management and Emergency Transportation Operations.
- Interagency cooperation.
- Expand use of roving patrols.
- Traffic Incident Management and Emergency Transportation Operations.
- Reduce the travel time differential between transit and auto during peak periods by X percent per year for Y years.
- Public Transportation and Ridesharing Management.
- Establish dynamic transit fare reductions.
- Deploy managed lanes – high occupancy/toll lane.
- Public Transportation and Ridesharing Management.
- Increase alternative (non-single occupancy vehicle) mode share for all trips by X percent within the next Y years.
- Public Transportation and Ridesharing Management and Travel Demand Management.
- Deploy managed lanes – high occupancy/toll lane.
- Implement dynamic ridesharing.
- Deploy commuter financial incentives.
- Offer guaranteed rides home.
- Public Transportation and Ridesharing Management and Travel Demand Management.

Source: FHWA.
Figure 37. Diagram. Scenario 2: Tactics from these tactical program areas were selected for the operational approach.
On the following page, figure 38 illustrates the application of the full methodology for the statewide rural interstate corridor and shows the connections between the steps.
Source: FHWA.
Figure 38. Diagram. Scenario 2: Application of methodology to a freight corridor important to interstate commerce.
Scenario 3: Application of Methodology to a Small City
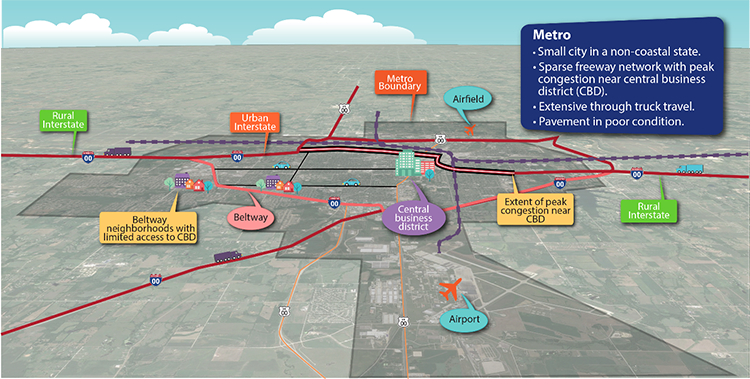
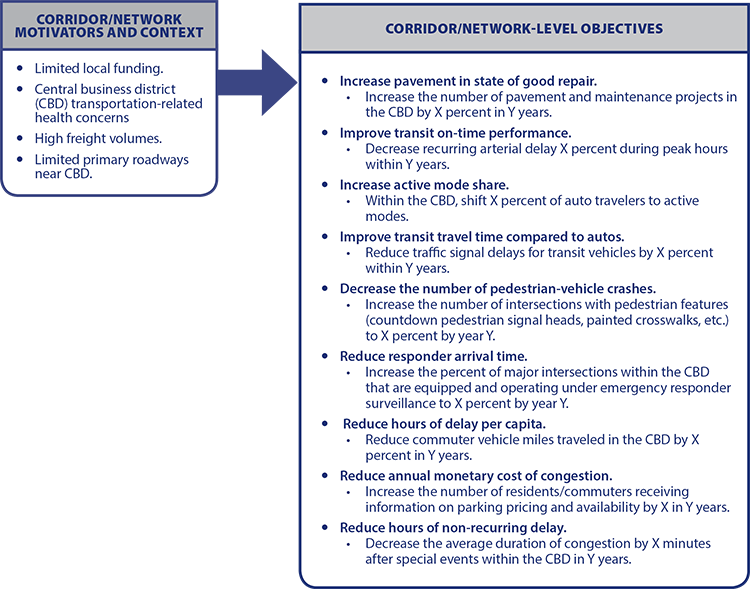
This section describes the third of four scenarios that will be used to illustrate the methodology. Scenario 3 is a small city with a limited freeway network and congestion during peak periods near the central business district (CBD), as shown in figure 39.
Source: FHWA.
Figure 39. Map. Scenario 3: A small city and its geographic context.
Context of the Small City
The geographic and multimodal transportation context for the small metropolitan area is described below. It should be assumed that transportation agencies within the metropolitan area have a baseline of operational capabilities on which to build.
Geographic Setting
This small- to mid-sized city is in an inland State with an urban area of roughly 75 square miles and a metropolitan area covering 6 counties.
National Highway System and Freight Context
- A major interstate highway bisects the city and an interstate beltway provides a loop around the southern part of the city.
- The interstate serves as a national east-west freight corridor.
- A major NHS arterial runs through the city, but local travel generally uses local arterials to avoid congestion on the NHS arterial.
- A municipal airport and a separate general aviation airfield serve commercial and freight travel by air.
- The city is served by a Class 1 railroad.
- A major rail intermodal facility supports the transfer of shipping containers between rail and trucks.
Population
- The city population is under 150,000 and just over 225,000 people live within the metropolitan planning area.
- The average population density is about 2,000 persons per square mile.
- Most of the area within the interstate beltway has population density greater than 3,500 persons per square mile, while development outside the beltway frequently has densities less than 1,200 persons per square mile.
Highway Characteristics and Usage
- The highway network facilitates high-speed travel around the outskirts of the primary city to residents living in all directions.
- The sparse highway network within the interstate beltway includes one high-capacity freeway route running east-west and another high-capacity primary arterial route running north-south.
- High volumes of heavy trucks pass through the CBD.
- Less than a quarter of the highway system pavement is in good condition, but the goal is to have 85 percent in good condition.
- While arterial and collector roads are in good to fair condition, local roads are in a poor state of repair.
Multimodal Network
- The local bus system provides adequate coverage within the city to the CBD, but headways are 30 minutes during peak hours and 60 minutes off-peak.
- The transit system has seen recent ridership growth, although levels are well below those set in 2008.
- The city recently committed to filling gaps in the pedestrian and bicycle network. Addressing gaps in the sidewalk network are a high priority, while bike amenities are an emerging opportunity.
Establishing System-Level Goals
The development of system-level goals is the first step in the methodology (figure 40). System-level goals were developed in response to motivators, as identified for this scenario in figure 41.

Source: FHWA.
Figure 40. Diagram. Scenario 3: The first step of the methodology is establishing system-level goals.
Source: FHWA.
Figure 41. Diagram. Scenario 3: Motivators for improvement in the metropolitan region lead to goals.
Application of RDAT Tools: The SHRP2 L05 performance measures guide and the TTRMS described in the SHRP2 L02 monitoring guide are significant for this step. A TTRMS could be used to help identify some of the motivators listed in figure 41—most notably in this scenario, congestion, travel-demand surges to the CBD, work-zone delays, and severe weather.
Developing System-Level Objectives and Setting Targets
The second step of the methodology is to develop system-level objectives and set targets (figure 42).
Source: FHWA.
Figure 42. Diagram. Scenario 3: The third step of the methodology is to develop network-level objectives and set targets.
Application of RDAT Tools: At the stage of setting system-level objectives and targets, the primary usefulness of RDAT tools is in establishing existing and historical conditions to support the following activities:
- Setting a baseline: Setting the baseline allows the analyst to identify existing systematic reliability problems that can guide the development of objectives and targets. For example, in this scenario, it might be noticed that travel-time distributions skew high, which might lead to a further examination of congestion sources.
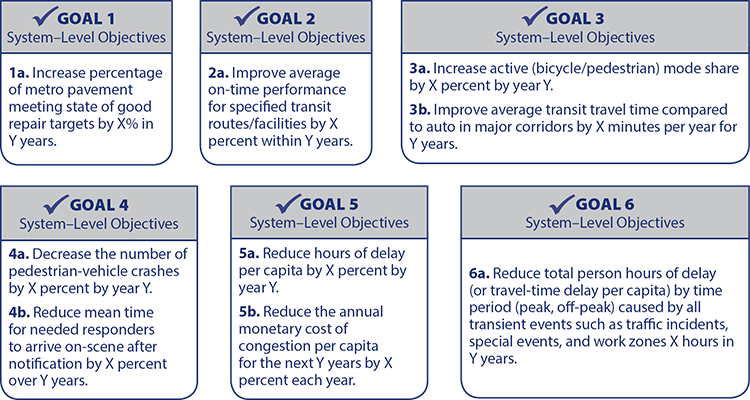
- Identifying sources of congestion: In the case of scenario 3, Objective 6a ended up relating to "all transient events," but it could also have been the case that a congestion-source analysis identified a strong pattern in one or more particular sources (figure 43). One example might be outsized delays related to incidents, which would prompt objectives related to incident response time. For this scenario, Objective 4b is related to response time; this situation illustrates how a reliability approach—and the RDAT tool suite—cuts across issues such as safety and recurrent delay.
- Establishing system-level performance measures: This scenario focuses largely on CBD surface streets, and although the SHRP2 L05 methods are generally focused on freeways, the general principles could be applied to develop aggregated measures for surface streets as well.
- Setting thresholds: The SHRP2 L05 handbook provides guidance and examples related to setting reliability thresholds. Although not shown for this scenario, the handbook discusses thresholds by facility type—an important consideration for system-level analysis.
Source: FHWA.
Figure 43. Diagram. Scenario 3: System-level objectives and targets that lead to the development of network-level objectives to support the achievement of the system-level objectives.
Developing Network-Level Objectives and Setting Targets
In step 3 of the methodology, objectives are developed for the specific corridor or network (figure 44). Network- and corridor-level objectives are derivatives of system-level objectives and are connected to a much more specific geographic context (figure 45). Each system-level objective in this example was linked to a single network or corridor-level objective, although there could be many network or corridor-level objectives that also support the system-level objectives defined.
Source: FHWA.
Figure 44. Diagram. Scenario 3: The third step of the methodology is to develop network-level objectives and set targets.
Source: FHWA.
Figure 45. Diagram. Scenario 3: Network motivators and system-level objectives drive the development of the network-level objectives and targets.
Application of RDAT Tools: The applications described in the Step 2 narrative—setting a baseline, identifying sources of congestion, establishing performance measures, and setting thresholds—also apply to Step 3, and the same RDAT tools are relevant.
Identifying an Operational Approach
Identifying an operational approach with supportive tactical program areas is Step 4 of the methodology (figure 46).
Source: FHWA.
Figure 46. Diagram. Scenario 3: The fourth step of the methodology is to identify an operational approach for achieving the network-level objectives.
In Step 4, a universe of tactical program areas is assessed against network-level objectives. For this scenario, only one or two of the most practical technical program areas were selected from this universe to form the next-level decision in identifying tactics. Once the example tactical program areas were assigned for all network-level objectives, the network-level objectives were depicted as a tree sprouting off all included tactical program areas (figure 47).
Source: FHWA.
Figure 47. Diagram. Scenario 3: The operational approach contains tactics from one or more tactical program areas.
Application of RDAT Tools: In this scenario, identifying reliability issues, and the congestion sources associated with them, could point the way toward program areas such as arterial management, travel demand management, traffic incident management/emergency transportation operations, and special event management.
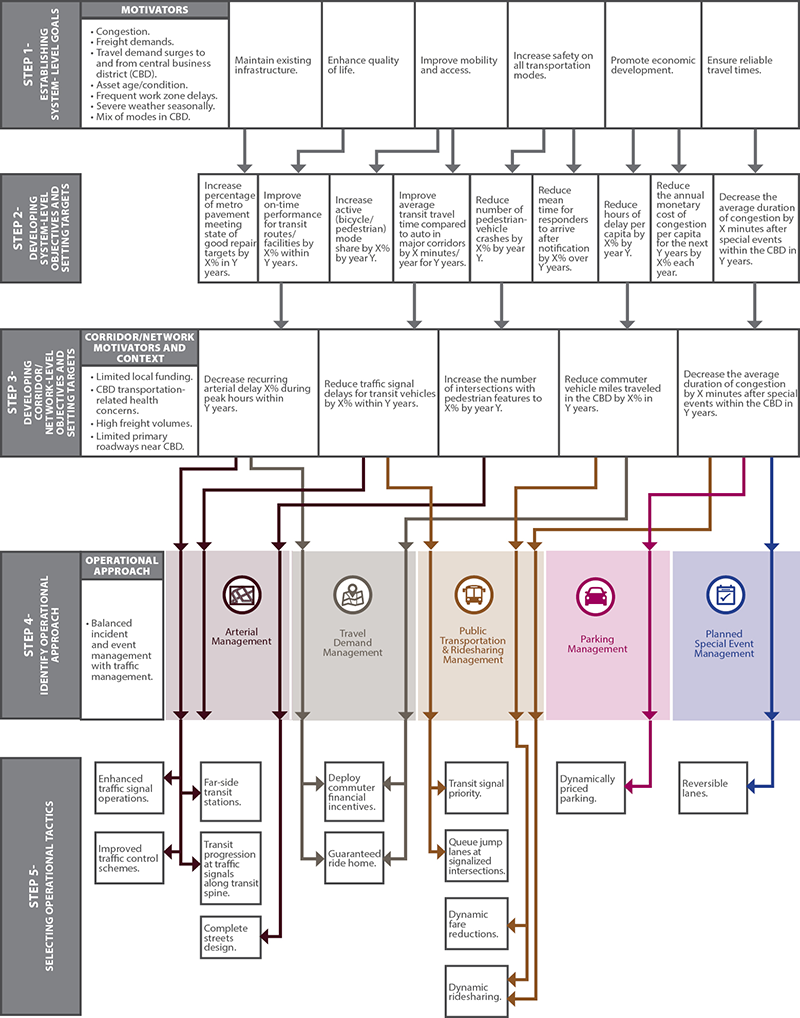
The tactical program areas identified to support each network-level objective are listed below:
- Increase the number of pavement and maintenance projects in the CBD by X percent in Y years.
- Asset Management and Work Zone Management.
- Decrease recurring arterial delay X percent during peak hours within Y years.
- Arterial Management and Travel Demand Management.
- Within the CBD, shift X percent of auto travelers to active modes.
- Arterial Management and Travel Demand Management.
- Reduce traffic signal delays for transit vehicles by X percent within Y years.
- Arterial Management and Public Transportation and Ridesharing Management.
- Increase the number of intersections with pedestrian features (pedestrian countdown signal heads, painted crosswalks, etc.) to X percent by year Y.
- Arterial Management.
- Increase the percent of major intersection within the CBD that are equipped and operating under emergency responder surveillance to X percent by year Y.
- Arterial Management and Traffic Incident Management and Emergency Transportation Operations.
- Reduce commuter vehicle miles traveled in the CBD by X percent in Y years.
- Travel Demand Management and Public Transportation and Ridesharing Management.
- Increase the number of residents/commuters receiving information on parking pricing and availability by X within Y years.
- Parking Management.
- Decrease the average duration of congestion by X minutes after special events within the CBD in Y years.
- Planned Special Event Management, Public Transportation and Ridesharing Management, and Travel Demand Management.
Selecting Operational Tactics
The selection of tactics in Step 5 requires expert judgment of leaders within each tactical program area to determine the network's fit with potential tactics (figure 48).
Source: FHWA.
Figure 48. Diagram. Scenario 3: The fifth step of the methodology is to select operational tactics to execute the operational approach.
Application of RDAT Tools: This scenario's tactics are mostly related to surface streets in the CBD, so STREETVAL would be most applicable. Example RDAT applications for this scenario include the following:
- STREETVAL could be used to analyze tactics that influence traffic demand fluctuations on CBD streets, such as commuter financial incentives and dynamic ridesharing.
- STREETVAL could also be used to analyze tactics that influence CBD incident durations, most notably those related to decreasing emergency response times.
- STREETVAL could also be used to examine the effects of increased work zones (due to the increased number of pavement and maintenance projects) and work zone management in the CBD, by adding work zones to affected segments and adjusting demand on parallel reliever routes.
Below are the tactics identified to support the achievement of each network-level objective (figure 49):
- Increase the number of pavement and maintenance projects in the CBD by X percent in Y years.
- Asset Management and Work Zone Management.
- Coordinate maintenance and construction activities.
- Signal optimization of parallel routes and ramp terminals.
- Asset Management and Work Zone Management.
- Decrease recurring arterial delay X percent during peak hours within Y years.
- Arterial Management and Travel Demand Management.
- Deploy enhanced traffic signal operations.
- Improve traffic control schemes.
- Deploy commuter financial incentives.
- Offer guaranteed rides home.
- Arterial Management and Travel Demand Management.
- Within the CBD, shift X percent of auto travelers to active modes.
- Arterial Management and Travel Demand Management.
- Provide leading pedestrian intervals/bike signal heads.
- Re-time traffic signals on bike routes to provide bicycle progression.
- Deploy commuter financial incentives.
- Offer guaranteed ride home.
- Fund employer pedestrian/bicycle amenities (e.g., bike racks, showers).
- Arterial Management and Travel Demand Management.
- Reduce traffic signal delays for transit vehicles by X percent within Y years.
- Arterial Management and Public Transportation and Ridesharing Management.
- Build far-side transit stations.
- Re-time traffic signals on transit spine to provide progression.
- Implement transit signal priority.
- Use queue jump lanes at signalized intersections.
- Arterial Management and Public Transportation and Ridesharing Management.
- Increase the number of intersections with pedestrian features (pedestrian countdown signal heads, painted crosswalks, etc.) to X percent by year Y.
- Arterial Management.
- Design for complete streets.
- Arterial Management.
- Increase the percent of major intersection within the CBD that are equipped and operating under emergency responder surveillance to X percent by year Y.
- Arterial Management and Traffic Incident Management and Emergency Transportation Operations.
- Implement network surveillance with cameras or detectors.
- Integrate CAD.
- Co-locate dispatch units.
- Arterial Management and Traffic Incident Management and Emergency Transportation Operations.
- Reduce commuter vehicle miles traveled in the CBD by X percent in Y years.
- Travel Demand Management and Public Transportation and Ridesharing Management.
- Deploy commuter financial incentives.
- Offer guaranteed rides home.
- Establish dynamic transit fare reductions.
- Implement dynamic ridesharing.
- Travel Demand Management and Public Transportation and Ridesharing Management.
- Increase the number of residents/commuters receiving information on parking pricing and availability by X in Y years.
- Parking Management.
- Implement dynamic parking wayfinding, reservations, capacity.
- Provide incentives to use underutilized parking facilities.
- Parking Management.
- Decrease the average duration of congestion by X minutes after special events within the CBD in Y years.
- Planned Special Event Management, Public Transportation and Ridesharing Management and Parking Management.
- Implement reversible lanes.
- Implement dynamic ridesharing.
- Deploy dynamically priced parking.
- Planned Special Event Management, Public Transportation and Ridesharing Management and Parking Management.

Source: FHWA.
Figure 49. Diagram. Scenario 3: Tactics from these tactical program areas were selected for the operational approach.
On the following page, figure 50 illustrates the application of the full methodology for this small city scenario and shows connections between each step.
Source: FHWA.
Figure 50. Diagram. Scenario 3: Application of the methodology to a small city.
Scenario 4: Application of Methodology to a Large Urban Subarea
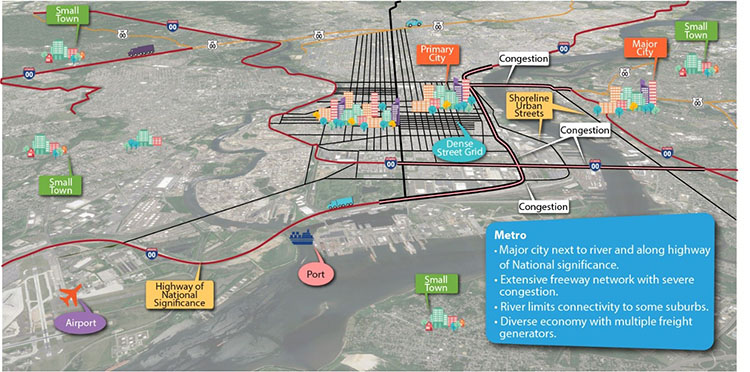
This section describes the last of four scenarios that will be used to illustrate the methodology. This is a major city next to a river, as shown in figure 51.
Source: FHWA.
Figure 51. Map. Scenario 4: A large urban subarea and its geographic context.
Context of the Large Urban Subarea
The geographic and multimodal transportation context for the large urban subarea is described below. It should be assumed that transportation agencies within the urban subarea have a baseline of operational capabilities on which to build.
Geographic Setting
- The metropolitan region covers more than 5,000 square miles and consists of a primary city with several nearby cities and towns. Approximately 2,000 square miles in the metropolitan region are urbanized.
- The primary city covers approximately 150 square miles and borders a major river, which separates it from a major city in an adjoining State.
- The focus subarea is the CBD in the primary city.
National Highway System and Freight Context
- The metropolitan region and primary city are located along a north-south interstate of national significance.
- The primary city also serves as the terminus of a major east-west interstate that connects the city to manufacturing and agricultural States in the middle of the country.
- The metropolitan region and the primary city receives freight via the east-west interstate and port facilities both within the primary city and in outlying communities.
Population
- The metropolitan regional population is greater than 6 million with an average density of approximately 1,200 people per square mile.
- The primary city population is more than 1.5 million with a population density of more than 10,000 people per square mile.
- Other major cities in the metropolitan region have population densities ranging from 5,000 to 7,500 people per square mile.
Highway Characteristics and Usage
- An interstate highway runs directly adjacent to the urban core and forms one edge of a beltway around the primary city.
- The east-west interstate brings travel from outlying suburbs to beltway freeways along the opposite edge of the primary city.
- The river limits connectivity between the primary city and some other major cities in the metro area, underscoring the significance of bridge connections on primary roadways.
- The metropolitan region's transportation network also supports a confluence of intermodal freight near the CBD.
Multimodal Network
- The transportation network offers a variety of modal choices for passengers and freight, including automobiles, trucks, heavy rail, freight rail, buses, shared ride services, bicycling, walking, and air- and water-based travel.
- Transit service is widely available within the primary city.
- While almost 80 percent of current travel in the metropolitan region is by personal automobile, most personal travel around the primary city is conducted by automobile (65 percent) and transit (15 percent).
- There is strong utilization of high-occupancy vehicles along the highway network near the CBD.
- Pedestrian and bicycle travel also account for a measurable mode share within the primary city.
Establishing System-Level Goals
The development of system-level goals is the first step in the methodology (figure 52). The large urban subarea has developed system-level goals in response to the motivations defined in figure 53.
Source: FHWA.
Figure 52. Diagram. Scenario 4: The first step of the methodology is establishing system-level goals.
Application of RDAT Tools: A travel-time reliability monitoring system could be used to help identify some of the motivators in figure 53—most notably in the case of this scenario, growing congestion, special events, and arterial management.
Source: FHWA.
Figure 53. Diagram. Scenario 4: Motivators for improvement in the subarea lead to goals.
Developing System-Level Objectives and Setting Targets
The second step of the methodology is the development of system-level objectives and performance targets. Setting objectives also requires an understanding of the context of the system and community within which the goal has been established. For example, transportation is about connectivity, but for urban communities connectivity may be about providing system options.
Source: FHWA.
Figure 54. Diagram. Scenario 4: The second step of the methodology is to develop system-level objectives and set targets.
Application of RDAT Tools: At the stage of setting system-level objectives and targets (figure 54), the primary usefulness of RDAT tools is in the establishment of existing and historical conditions to support the following:
- Setting a baseline: Setting the baseline allows the analyst to identify existing systematic reliability issues, which in turn can guide, at a high level, the establishment of objectives. For example, in this scenario, one might notice that travel-time distributions indicate a significant non-recurring component, which might lead to further examination of congestion sources, which could then influence objectives.
- Identifying sources of congestion: Knowing the sources of system-wide congestion (both recurring and non-recurring) can help agencies focus when determining system-wide objectives. In this scenario, Objective 4b, shown in figure 55, is related to mean incident response time, and certainly could have been prompted by outsized incident-related delays partially attributable to inadequate response times.
- Establishing system-level performance measures: In addition to more typical reliability considerations, this scenario also includes Objective 3a (figure 55) related to freight bottlenecks, which can also be analyzed in a reliability framework.
Source: FHWA.
Figure 55. Diagram. Scenario 4: System-level objectives and targets for realizing system goals.
Developing Network-Level Objectives and Setting Targets
In Step 3 of the methodology, objectives are developed for the specific corridor or network (figure 56). Network and corridor-level objectives are derived from system-level objectives and are connected to a much more specific geographic context (figure 57).
Source: FHWA.
Figure 56. Diagram. Scenario 4: The third step of the methodology is to develop network-level objectives and set targets.
Application of RDAT Tools: At the network level, the usefulness of RDAT tools is similar to their usefulness at the system level. In fact, as mentioned in the Step 2 narrative, system-level performance measures must be built up or aggregated from the network or segment level. The applications described in the Step 2 narrative—setting a baseline, identifying sources of congestion, establishing performance measures, and setting thresholds—also apply to Step 3, and the same RDAT tools are relevant.
Source: FHWA.
Figure 57. Diagram. Scenario 4: Network motivators and system-level objectives drive the development of the network-level objectives and targets.
Identifying an Operational Approach
Identifying an operational approach and defining supportive tactical program areas is Step 4 of the methodology (figure 58). A universe of tactical program areas is available to support this step. The approach is assessed against network-level objectives. For this scenario, only the most practical technical program areas were selected from this universe to form the next-level decision in identifying tactics.
Source: FHWA.
Figure 58. Diagram. Scenario 4: The fourth step of the methodology is to identify an operational approach for achieving the network-level objectives.
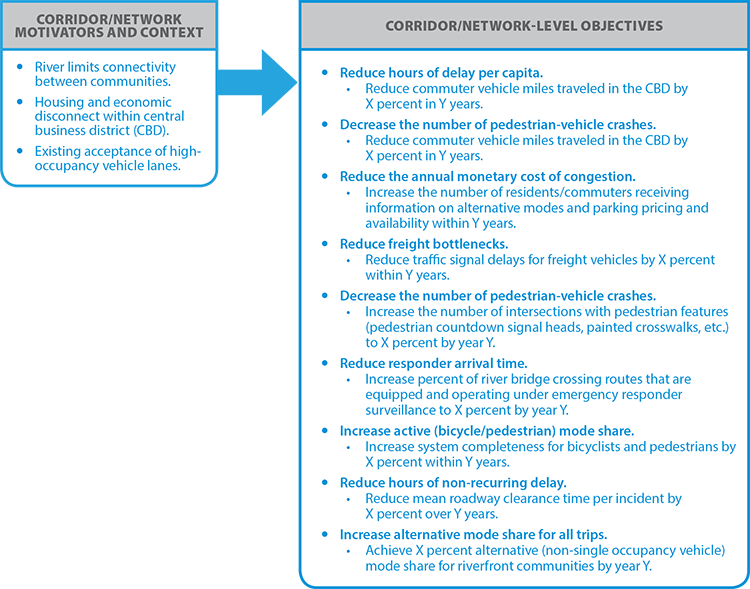
Application of RDAT Tools: In this scenario, identifying reliability issues, and the congestion sources associated with them, could point the way toward program areas such as travel demand management, freeway management, freight management, traffic incident/emergency transportation operations, and special event management, and arterial management.
The tactical program areas identified to support each network-level objective, shown in figure 59, are listed below:
- Reduce commuter vehicle miles traveled in the CBD by X percent in Y years.
- Public Transportation and Ridesharing Management and Travel Demand Management.
- Increase the number of residents/commuters receiving information on alternative modes and parking pricing and availability within Y years.
- Public Transportation and Ridesharing Management and Parking Management.
- Reduce traffic signal delays on freight vehicles by X percent within Y years.
- Arterial Management and Freight Management.
- Increase the number of intersections with pedestrian features (pedestrian countdown signal heads, painted crosswalks, etc.) to X percent by year Y.
- Arterial Management.
- Increase percent of river bridge crossing routes that are equipped and operating under emergency responder surveillance to X percent by year Y.
- Freeway Management and Traffic Incident Management and Emergency Transportation Operations.
- Reduce commuter vehicle miles traveled in the CBD by X percent in Y years.
- Travel Demand Management and Public Transportation and Ridesharing Management.
- Increase system completeness for bicyclists and pedestrians by X percent within Y years.
- Arterial Management.
- Reduce mean roadway clearance time per incident by X percent over Y years.
- Traffic Incident Management and Emergency Transportation Operations.
- Achieve X percent alternative (non-SOV) mode share for riverfront communities by year Y.
- Public Transportation and Ridesharing Management and Travel Demand Management.
 Source: FHWA.
Figure 59. Diagram. Scenario 4: The operational approach contains tactics from one or more tactical program areas.
Selecting Operational Tactics
Step 5 (figure 60) requires the expert judgment of leaders within each tactical program area (figure 61) to determine the network's fit with potential tactics.
Application of RDAT Tools: This scenario's tactics are related to a mixture of freeways and surface streets in and near the CBD. Example RDAT applications for this scenario follow:
- FREEVAL/SHRP2 L07 and STREETVAL could be used to analyze tactics that influence traffic demand fluctuations on CBD freeways and streets, such as commuter financial incentives, dynamic ridesharing, dynamic transit fare reductions, dynamically priced parking, and other mode-shift tactics.
- These tools could also be used to analyze tactics that influence CBD incident durations, most notably those related to decreasing emergency response times, use of roving patrols, and tow truck incentives—especially as related to river bridges.
Source: FHWA.
Figure 60. Diagram. Scenario 4: The fifth step of the methodology is to select operational tactics to execute the operational approach.
Source: FHWA.
Figure 61. Diagram. Scenario 4: Tactics from these tactical program areas were selected for the operational approach.
Below are the tactics identified to support the achievement of each network-level objective:
- Reduce commuter vehicle miles traveled in the CBD by X percent in Y years.
- Public Transportation and Ridesharing Management, Travel Demand Management, and Parking Management.
- Implement dynamic ridesharing.
- Implement transit signal priority.
- Establish dynamic transit fare reductions.
- Deploy commuter financial incentives.
- Deploy dynamically priced parking.
- Public Transportation and Ridesharing Management, Travel Demand Management, and Parking Management.
- Increase the number of residents/commuters receiving information on alternative modes and parking pricing and availability within Y years.
- Public Transportation and Ridesharing Management and Parking Management.
- Establish dynamic transit fare reductions.
- Deploy dynamically priced parking.
- Public Transportation and Ridesharing Management and Parking Management.
- Reduce traffic signal delays on freight vehicles by X percent within Y years.
- Arterial Management and Freight Management.
- Implement truck traffic signal priority.
- Implement freight loading zone policies (e.g., delivery times, designated zones, electronic parking payment systems).
- Arterial Management and Freight Management.
- Increase the number of intersections with pedestrian features (pedestrian countdown signal heads, painted crosswalks, etc.) to X percent by year Y.
- Arterial Management.
- Provide enhanced bicycle and pedestrian crossings.
- Design for complete streets.
- Arterial Management.
- Increase the percent of river bridge crossing routes that are equipped and operating under emergency responder surveillance to X percent by year Y.
- Freeway Management and Traffic Incident Management and Emergency Transportation Operations.
- Implement network surveillance with cameras or detectors.
- Integrate CAD.
- Co-locate dispatch units.
- Freeway Management and Traffic Incident Management and Emergency Transportation Operations.
- Reduce commuter vehicle miles traveled in the CBD by X percent in Y years.
- Public Transportation and Ridesharing Management, Travel Demand Management, and Parking Management.
- Implement dynamic ridesharing.
- Implement transit signal priority.
- Establish dynamic transit fare reductions.
- Deploy commuter financial incentives.
- Deploy dynamically priced parking.
- Public Transportation and Ridesharing Management, Travel Demand Management, and Parking Management.
- Increase system completeness for bicyclists and pedestrians by X percent within Y years.
- Arterial Management.
- Provide enhanced bicycle and pedestrian crossings.
- Design for complete streets.
- Arterial Management.
- Reduce mean roadway clearance time per incident by X percent over Y years.
- Traffic Incident Management and Emergency Transportation Operations.
- Interagency cooperation.
- Expand use of roving patrols.
- Use tow truck incentives.
- Achieve X percent alternative (non-single occupancy vehicle) mode share for riverfront communities by year Y.
- Public Transportation and Ridesharing Management, Travel Demand Management, and Parking Management.
- Implement dynamic ridesharing.
- Implement transit signal priority.
- Establish dynamic transit fare reductions.
- Deploy commuter financial incentives.
- Deploy dynamically priced parking.
- Public Transportation and Ridesharing Management, Travel Demand Management, and Parking Management.
On the following page, figure 62 illustrates the application of the full methodology for the large urban subarea and shows connections between the steps.
Source: FHWA.
Figure 62. Diagram. Scenario 4: Application of methodology to large urban subarea.