2018 Urban Congestion Trends
Improving Operations, Improving Performance
Printable version [PDF 3.4MB]
You may need the Adobe® Reader® to view the PDFs on this page.
Contact Information: Operations Feedback at OperationsFeedback@dot.gov

U.S. Department of Transportation
Federal Highway Administration
Office of Operations
1200 New Jersey Avenue, SE
Washington, DC 20590
ops.fhwa.dot.gov
FHWA-HOP-19-026
February 2019
(left to right: Photo by cleanfotos/Shutterstock.com; Photo by MakDill/Shutterstock.com; Photo by cleanfotos/Shutterstock.com)
The Federal Highway Administration (FHWA) 2018 Urban Congestion Trends reports the current state of congestion and reliability in 52 of the largest metropolitan areas in the United States. This report also describes relevant successful operational strategies and performance management approaches implemented by State and local transportation agencies in recent years. The report concludes with a brief discussion of external factors and ways that agencies might include these additional data to help describe trends.
This is the fifth year the National Performance Management Research Data Set (NPMRDS) has been used to calculate congestion and reliability metrics for the FHWA's Urban Congestion Report (UCR). This is also the second year of data from a different travel time data provider, so trends from 2017 and 2018 data will be more of an apples-to-apples comparison. As a reminder, the data set includes actual, observed travel times on the National Highway System (NHS) and is freely available for use by State departments of transportation (DOTs) and metropolitan planning organizations (MPOs) for their performance management activities. This report also familiarizes readers with a tool that was developed to assist agencies with calculating and reporting performance measures.
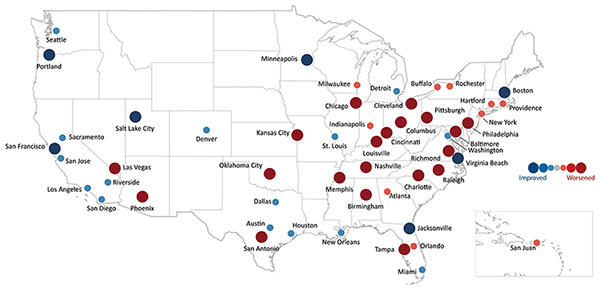
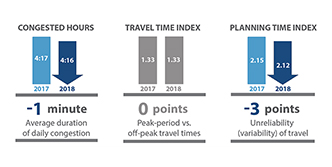
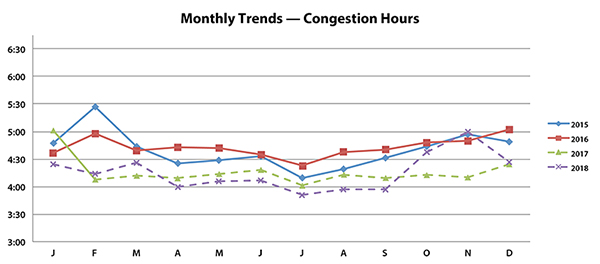
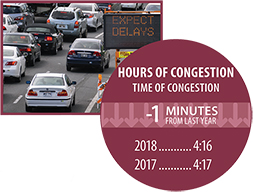
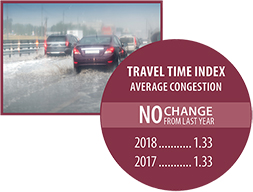
The graphic below provides 2017–2018 congestion trends on an annual basis similar to the quarterly reports from the UCR. Overall, congestion metrics have decreased from 2017 to 2018. The national congestion measures across all 52 MSAs included in the UCR are generally down from 2017 to 2018.
Urban Congestion Trends
Year-to-Year Congestion Trends in the United States (2017 to 2018)
NOTES
The results in this map are annual congestion trends. Quarterly UCR data are available at https://ops.fhwa.dot.gov/perf_measurement/ucr/.
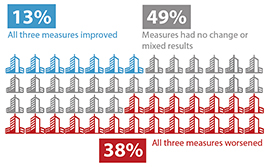
Each symbol (![]() ) represents 1 msa.
) represents 1 msa.
Congestion Facts
- From 2017 to 2018, the congestion measures at the national level were on the whole relatively unchanged.
- Across the country, 15 percent (8) of the 52 reported-on metropolitan statistical areas (MSAs) improved in all three of the measures.
- Twenty of the MSAs deteriorated in all three of the congestion measures compared to the 2017 values.
- The time penalty for a trip in an average day travel time index (TTI) decreased or remained the same in 52 percent (27) of the MSAs.
- Travel time on the worst day per month decreased in 54 percent (28) of the MSAs.
Congestion Measure Definitions
- Hours of congestion—amount of time when freeways operate less than 90 percent of free-flow freeway speeds.
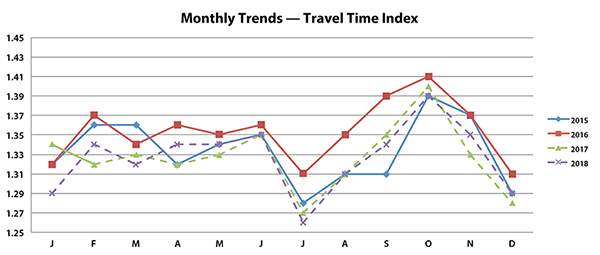
- Travel Time Index (TTI)—time penalty for a trip on an average day. A TTI of 1.30 indicates a 20-minute free-flow trip takes 26 minutes (20 × 1.30) in the rush hours.
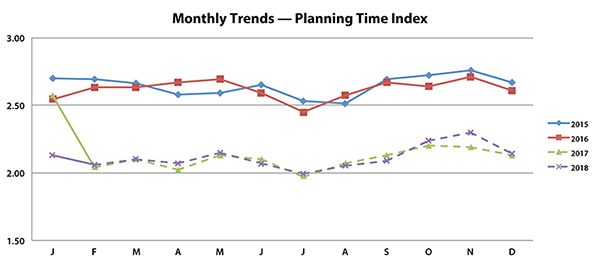
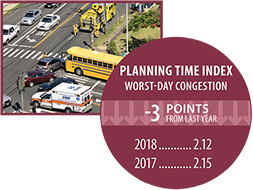
- Planning Time Index (PTI)—time penalty for a trip to be on time for 95 percent of trips (i.e., late for work on one day per month). A PTI of 1.60 indicates a 20-minute free-flow trip takes more than 32 minutes (20 × 1.60) one day per month.
Performance measures for 2017 and 2018 use 2015 volume data. Previous years used 2013 volume data.
Practical Applications of the NPMRDS
What Is New with the NPMRDS?
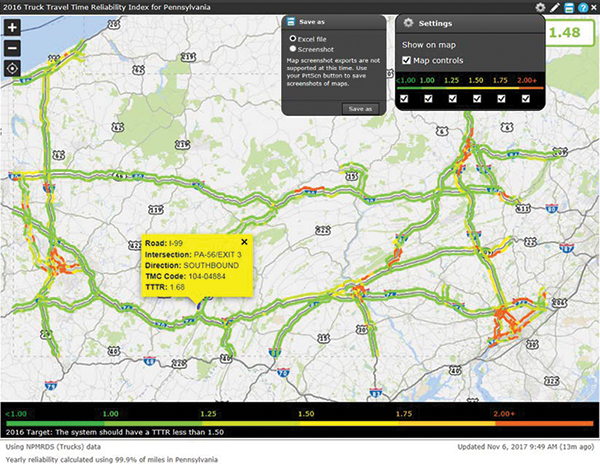
The NPMRDS is an archived speed and travel time data set (including associated location referencing GIS data) that covers the NHS and additional roadways near 26 key border crossings with Canada (20 crossings) and Mexico (6 crossings).
Historic travel times and speeds are produced each month and are available five business days into the following month. Three different average travel times are provided, when available, on each of nearly 400,000 road segments: passenger vehicles, trucks, and all vehicles (trucks and passenger vehicles combined). Each of the nearly 400,000 segments includes a selection of attributes from the Highway Performance Monitoring System (HPMS) that can be used to assist in calculating the PM3 travel time-based measures.
In order to help State DOTs and MPOs to calculate the PM3 measures, the FHWA assisted the Transportation Performance Management (TPM) Capacity Building Pooled Fund study in adding a task that provides a tool to calculate the PM3 travel-time based metrics and measures. The pooled fund study is led by the Rhode Island DOT and is administered by the American Association of State Highway and Transportation Officials (AASHTO).
The PM3 analysis tools includes capabilities to compute, visualize, and download all of the PM3 metrics and sub-metric data as required to be reported by FHWA. Agency speed-limit data can be integrated, and trend-line capabilities are helping agencies more easily address target-setting requirements. An “easy button” allows agencies to immediately create all of the necessary files for annual metric submissions every June 15th.
For More Information:
npmrds@ritis.org
https://npmrds.ritis.org/analytics/
Operational Improvement Evaluations—Using Technology to Improve Operations
The evaluations that follow highlight innovative ways that agencies throughout the United States have improved traffic through effective operations or innovation.
Automated Traffic Signal Performance Measures (ATSPM)—Georgia Department of Transportation
Automated Traffic Signal Performance Measures
ATSPM upgrades produced positive operational and maintenance benefits.
(Benefits: reduced maintenance, increased accountability).
The Problem
Georgia has over 9,000 signals statewide—6,500 that are on a system and about 5,500 operated and maintained by the Georgia Department of Transportation (GDOT). Limitations to effective signal operations were identified by GDOT personnel on numerous items affecting signal operations including software and firmware capabilities, manual reporting, inaccurate performance measures, and the need for program evolution where mainline volume was no longer the only goal. As a result, GDOT is converting all signals in Georgia to use ATSPM.
The Results
With ATSPM, GDOT now has over 4,600 traffic signals logging high-resolution data. ATSPM is the primary tool of operations and maintenance of traffic signals. GDOT development includes automated monthly reporting, corridor evaluation tools using performance metrics, changed business practices, and connections to GPS probe data to use big data and analytics to drive decisions. Reliability and functionality were manually reported previously but now are an automated report. GDOT's Monthly Automated Reporting Kit is a dashboard that features a myriad performance measures and equipment statuses collected from signals across the State.
For More Information:
Alan Davis, GDOT, aladavis@dot.ga.gov
https://traffic.dot.ga.gov/ATSPM/
Freight Advanced Traveler Information System (FRATIS)—U.S. Department of Transportation
Freight Advanced Traveler Information System
The freight routing system produced positive benefits.
(Benefits: operational efficiencies, reduced fuel costs).
The Investment
The U.S. Department of Transportation's (USDOT's) Cross-Town Improvement Project promotes more effective and efficient freight moves. As part of this effort, USDOT developed the Freight Advanced Traveler Information System (FRATIS) to improve truck operations. The centerpiece of FRATIS is an optimization algorithm to create optimal dispatch plans. The Corridor Optimization for Freight system, an application for integrating FRATIS data with data from trucks driving over a pre-determined route. One proof-of-concept application completed tests with five drayage companies operating at the ports of Los Angeles and Long Beach from July 2017 to October 2017.
The Return
Overall, the project demonstrated FRATIS's potential for substantial benefits in reduced drayage mileage and improved operational efficiencies. For example, analysis of live operational data showed that deployment of FRATIS led to a 14 percent reduction in average total miles driven. These and other benefits indicate promise for broader FRATIS deployment. Deployment of FRATIS also needs to consider the highly dynamic nature of drayage operations, including the fact that companies use different methods to assign orders.
| Average Overall Distance Reduction | 14% |
|---|---|
| Average Company Plan Miles | 1,929 miles |
| Standard Deviation | 503 miles |
| Average FRATIS Plan Miles | 1,662 miles |
| Standard Deviation | 462 miles |
| Largest Improvement | 30% |
| Smallest Improvement | 2% |
| Potential Miles Reduced with FRATIS | 22,874 miles |
For More Information:
Send an e-mail to FreightFeedback@dot.gov
https://rosap.ntl.bts.gov/view/dot/36242
Diverging Diamond Interchange—Delaware Department of Transportation
Diverging Diamond Interchange (DDI)
DDI provides improved traffic flow, congestion relief, and improved safety.
(Benefits: decreased delay, decreased congestion).
The Problem
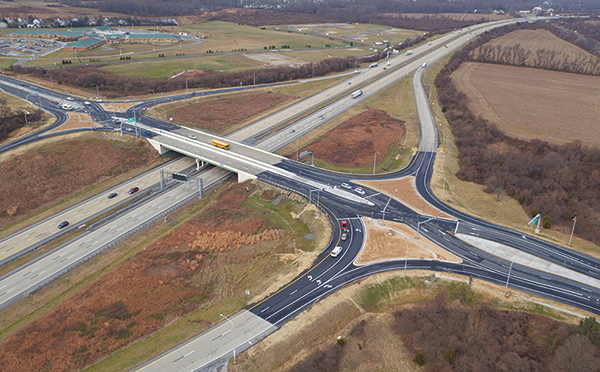
The busy interchange of SR 1 and Delaware SR 72 connects two important transportation corridors in the State. Since the interchange opened in the late 1990s, traffic has grown significantly along both corridors. Within the last 10 years, SR 72 traffic has increased from an average daily volume of 9,000 vehicles to almost 24,000, and SR 1 traffic has increased from around 67,000 vehicles to 90,000. Left turns were also becoming a problem.
The Results
After studying solutions to better manage this traffic growth, Delaware Department of Transportation (DelDOT) decided on a diverging diamond interchange (DDI)it would increase capacity of turning movements by allowing for free-flowing, high-volume left turns, while also reducing driver delays via two-phase traffic signals that provide more green light time on SR 72. Those two efforts improved safety not only for drivers by reducing the number of conflict points, but also for pedestrians and bicyclists due to a new shared-use path. DelDOT said implementation of the $9.3 million DDI reduced travel times for vehicles by three to seven minutes, while making commuting safer and easier.
For More Information:
Darren O'Neill, DelDOT, darren.oneill@state.de.us
https://www.deldot.gov/information/projects/SR72-SR1/index.shtml
Parking in Washington DC—District Department of Transportation
Parking Relief
The project improved and expanded parking information provided to travelers.
(Benefits: reduced congestion, increased preparedness).
The Investment
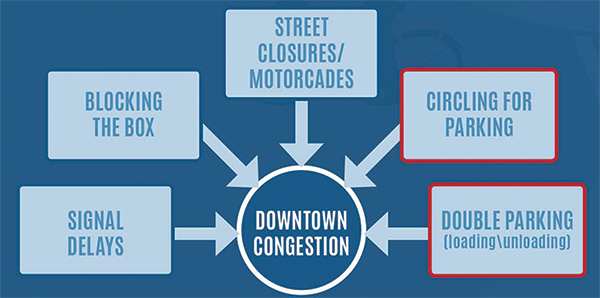
The District Department of Transportation estimates that 25 to 30 percent of congestion in the district is caused by people circling around the block to find an open parking space. In an effort to reduce congestion, a parking pilot program in the Penn Quarter/Chinatown area was conducted using technology to assist travelers in finding parking spaces. Travelers were able to download a mobile application to show them real-time pricing and availability. Part of the technology was an algorithm that used available data, as well as new data derived from sensors and cameras covering about half the parking spots. Analytics were used to fill in the gaps. Multiple iterations of adjusting the parking rates and time limits were conducted from October 2016 to November 2017.
The Return
Benefits included improved parking utilization and turnover, placard usage, double parking, modal shifts, revenue at the meters, and positive perception from the store owners, customers, and delivery drivers. There were negligible effects on economic activity and roadway operations.
For More Information:
Soumya Dey, DDOT, Soumya.dey@dc.gov
https://ddot.dc.gov/page/multimodal-value-pricing-pilot-metered-curbside-parking-penn-quarterchinatown
Crowdsourcing—FHWA
Crowdsourcing
Expedited notification of congestion and crashes.
(Benefits: reduced congestion and improved reliability).
The Investment
Since 2011, FHWA's Every Day Counts (EDC) program has worked to identify and rapidly deploy proven yet under utilized innovations. One of EDC's innovations is helping a number of State and local agencies use crowdsourced data for traffic operations. Several agencies are detecting incidents through crowdsourcing much faster than notifications from 911 centers, thus enabling faster response to the incident. Using crowdsourced data from smartphone and cellular-based data sources as well as enhanced law enforcement communications through computer-aided dispatch systems, public agencies are increasing their situational awareness of traffic conditions including crashes, weather, and work zones. Crowdsourced traffic data provides a new, real-time data source, outside the boundaries of fixed sensors and cameras, to more proactively operate the transportation system.
The Return
Improved Operations. Crowdsourced data enable agency staff to provide better traveler information and more proactive and effective operations strategies that can lead to reduced traffic congestion and improved reliability.
Cost Savings. Crowd sourced data is cost effective and could reduce the need for additional roadside sensors and systems that require installation and maintenance. In addition, crowd sourced data allows agencies to leverage and more effectively use their existing Intelligent Transportation Systems infrastructure.
Increased Safety. Crowd sourced data enables agency staff to identify problems more quickly and more confidently, leading to faster and more accurate responses to traffic incidents and other congestion-causing events.
For More Information:
FHWA Every Day Counts
https://www.fhwa.dot.gov/innovation/everydaycounts/edc_5/crowdsourcing.cfm
Active Traffic Management—Michigan Department of Transportation
Flex Route
Flex Route utilizing active traffic management.
(Benefits: reduced congestion, higher throughput).
The Investment
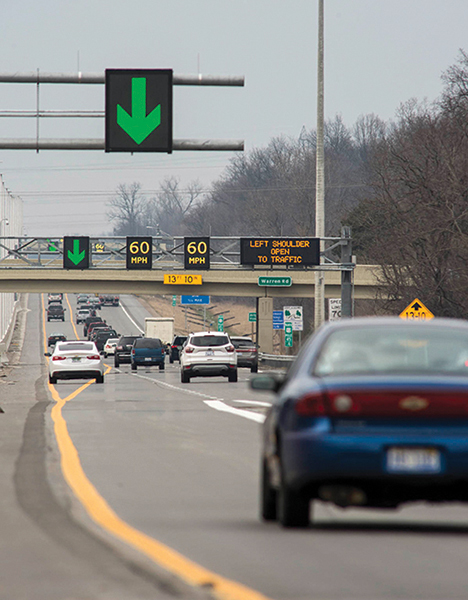
In an effort to mitigate congestion issues and improve travel time reliability along the US 23 corridor North of Ann Arbor, the Michigan Department of Transportation (MDOT) has installed its first deployment of active traffic management (ATM) branded as the Flex Route. The project included lane control gantries and upgrades to the median shoulders along the corridor to allow them to be used as a third lane of travel. The US 23 Flex Route utilizes overhead gantries equipped with various ATM strategies, such as dynamic shoulder use, dynamic lane control, variable speed advisories, queue warning, real-time truck parking information and management systems, and over height vehicle detection system.
The Return
There has been limited implementation of ATM on facilities in the United States. In the locations where ATM has been implemented, the strategies have varied between locations. An FHWA publication titled Integrating Active Traffic and Travel Demand Management: A Holistic Approach to Congestion Management found the following system benefits for facilities that have implemented ATM:
- Increase in average vehicle throughput of 3 to 7 percent.
- Increase in overall capacity of 3 to 22 percent.
- Increase in trip reliability.
Along this corridor of US 23 specifically, MDOT has seen a 32 percent reduction in morning peak travel time, 57 percent improvement in planning time (reliability), corridor speeds that have increased by approximately 20 mph, and reduced incidents of primary and secondary crashes by approximately 50 percent.
For More Information:
Aaron Jenkins, MDOT, JenkinsA10@michigan.gov
https://www.michigan.gov/mdot/0,4616,7-151-9620-476369--,00.html
Performance Management and Operations
External Factors
External factors (also called exogenous factors) are those influences that affect transportation system performance but are typically outside the control (at least operationally) of transportation agencies. Common examples of external factors include fuel prices, economic conditions, and employment levels. Transportation agencies that wish to effectively manage system performance should understand the nature and extent of this influence of external factors on system performance. Understanding the influence of external factors helps in several elements of performance management, particularly in communication and target setting.
The FHWA Office of Operations funded a study to investigate external factors and their relationship with roadway performance (full report linked below). The study team identified a list of possibly influential external factors for which data were available on a recurring basis. This list included the following general categories: travel demand; economic, employment, and price indicators; population and housing indicators; and weather conditions.
The research team conducted a statistical analysis of factors in these categories and found the most important external factors correlated with system performance were as follows:
- Traffic volume levels.
- Number of employed persons.
- Number of building permits.
- Rental vacancy rate.
- Fuel price index.
- Economic conditions index (one month of leading effect).
The extent to which these external factors affect or are affected by transportation system performance is still unknown and probably varies by location, but tracking these and other external factors may provide insight into the relationship between transportation, the economy, and other sectors of interest. While these external factors were relevant at an aggregate national level, there undoubtedly will be others that are significant to individual States or regions. Agencies may choose to track other external factors that may be of particular interest to them. Regardless, when tracking, visualizing, and publishing these external factors, States and regions should carefully consider not only the analysis in preparing the data, but also how they present the data. The report Approaches to Presenting External Factors with Operations Performance Measures identifies key external factors that can impact performance, and describes recommendations for how to include external factors in performance reporting and effectively present external factor data.
For More Information:
https://ops.fhwa.dot.gov/publications/fhwahop18002/index.htm
Contact Information
Visit the Operations Performance Measurement Program Urban Congestion Reports web page for quarterly congestion trend updates: ops.fhwa.dot.gov/perf_measurement/ucr/index.htm.
