Enhancing Active Transportation and Demand Management (ATDM) with Advanced and Emerging Technologies and Data SourcesChapter 7. Case StudiesThis chapter describes three case studies that exemplify the use of active transportation and demand management (ATDM) solutions in conjunction with emerging technologies and data sources. The San Diego and Netherlands case studies are implementations of active traffic management (ATM). The Stanford case study demonstrates both active demand management (ADM) and active parking management (APM). Whereas the beginning of each case study summarizes the relevant emerging data and technologies, the end of each case study speculates as to how the relevant emerging data and technologies could be further leveraged in the future. San Diego Integrated Corridor Management SystemATM and ADM Approach: ATM and ADM. Emerging Technologies and Data Currently in Use: Artificial intelligence (AI), decision support systems (DSS), real-time microsimulation, and on-line traffic prediction. 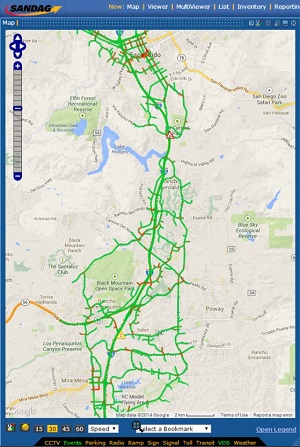
Figure 28. Screenshot. San Diego Association of Governments project area map of Interstate 15. Source: SANDAG The Interstate (I-) 15 integrated corridor management system (ICMS) project focuses on a 20-mile stretch of I-15 between State Route (SR) 163 in San Diego and SR 78 in the City of Escondido.(45) The San Diego I-15 integrated corridor management (ICM) corridor is a congested north-south interstate corridor. It forms the primary artery for the movement of commuters, goods, and services from northern San Diego County to downtown San Diego. This project aims to operate and manage individual transport systems as a unified corridor including the highway network, toll lanes, surrounding arterials, and public transport network in the area. The San Diego Association of Governments (SANDAG) is leading the project and works alongside the U.S. Department of Transportation (USDOT), Caltrans, the Metropolitan Transit System, and the North County Transit District. SANDAG also works with the Cities of Escondido, Poway, and San Diego, with Delcan Corporation serving as the project integrator. SANDAG's vision is to develop a high-fidelity analytical platform to test new and evolving concepts with high resolution, and to mimic real-world operations in a simulation environment. The I-15 ICMS project introduces ‘smart' traffic management technologies and concepts never used before in the United States. The project's pioneering DSS uses a number of technology solutions such as network traffic prediction, on-line microsimulation analysis, and real-time response strategy assessment, to give system managers comprehensive awareness of the current and predicted future performance of the entire corridor. Core to the ICM solution is the ability to forecast and simulate congestion and capacity imbalances in real-time or near-real-time. The DSS allows continuous predictions every 5 minutes to monitor and anticipate congestion hot spots. It can launch evaluations of available strategies to select the best response. This helps to minimize congestion and improve prediction of journey times for both drivers and users of public transport. Rather than reacting to traffic conditions, managers can anticipate problems and take preventative action using ICM strategies such as:
The I-15 ICMS is designed to optimize capacity and efficiency, reducing delays and obtaining more reliable journey times without the need for investment in additional infrastructure (namely, more lanes for private traffic). The multimodal DSS integrates two tools:
The I-15 ICMS is one of the first working examples of management integrated with prediction, which allows the anticipatory administration of an area that is very complex in terms of transport and mobility.
The Delcan Intelligent NETworks ATMS is used for field device monitoring and control, center-to-center data fusion, event management, and response plan generation. Aimsun Live uses live data feeds and simulations to dynamically forecast traffic conditions based on the current state of the network, which helps system managers evaluate incident response or congestion management strategies. The ICM network is being used to assess the role that predictions play within ATDM, incorporation of new functionality to the corridor (speed harmonization and dynamic merge control) and the sensitivity of prediction duration on DSS effectiveness. SANDAG expects the ICM project to help with:
According to SANDAG's ICM Concept of Operations (ConOps) document, successful implementation of the ICMS and concepts requires a proactive, strategic, and collaborative approach to public and private-sector stakeholder partnerships, along with a history of successful joint operation initiatives, both of which have been achieved under the institutional umbrella of SANDAG.(45) A virtual corridor transportation management center (VCTMC) allows for coordination among multiple agencies on multiple levels for data collection and processing, data sharing, and decision support based on workflow and on an expansion of available information. Other critical assets for the corridor include a real-time advanced travel information system, intermodal transportation management system,(45) regional integrated workstations in city traffic engineering departments, performance management system, region-wide adoption of a common traffic signal control platform, managed lanes, and bus rapid transit with direct access ramps. Beyond this, the ConOps identified the following implementation issues:
Hypothetical Uses of Emerging Technologies and Data
Stanford University's Congestion and Parking Relief Incentives StudyATDM Approach: ATM and Active Demand Management (ADM) through Incentives. Emerging Technologies and Data Currently in Use: Radio frequency identification (RFID) sensing, smartphone applications, and social media. One of the largest employers in the San Francisco Bay Area, Stanford University signed a General Use Permit with the County of Santa Clara that requires the university to manage its transportation impacts under a "no net new commute trips" standard: The amount of traffic during peak hours must not increase by more than 1 percent during the morning and afternoon peak hours (based on traffic count data from 2000). By 2012, while existing measures had been effective in reducing the total number of commuters who drive alone, they did not directly address peak-hour commuters, whose numbers were increasing. In an effort to address this imbalance, the university, with a $3 million grant from the FHWA Value Pricing Pilot Program, launched the Congestion and Parking Relief Incentives (CAPRI) program,(13) which ran from April 2012 through September 2014. Its goal was focused on shifting driver commutes away from peak hours but was expanded in 2013 to incentivize walking and bicycling commutes. The approach behind the project is based on the understanding that "congestion is a 10 percent phenomenon." (33) In other words, a small reduction in demand can lead to a significant drop in congestion. By targeting peak-period commutes, a corresponding decrease in peak-period congestion around the university could be achieved. Sleeping in might never feel better. To lower traffic congestion and pollution, a new program seeks to get Stanford drivers to avoid arriving and departing the campus during peak hours. Professor Balaji Prabhakar aims to deliver social benefits at low cost using people's penchant for a chance at a bigger payout over a predetermined small reward.
In addition, rather than penalizing undesirable behavior, such as increasing the cost of transit during peak periods, the CAPRI project approach was designed to incentivize decongestion by using "carrots" to influence driver behavior. This methodology leverages game theory, in which games with low stakes see players become more risk-seeking, resulting in greater user responsiveness achieved by paying out random "chunky" rewards rather than small, deterministic payments. CAPRI built on the incentives used in earlier programs, as well as Steptacular and Insinc programs in terms of both behavioral interventions as well as technological elements.(35) Another benefit of a system like CAPRI is that it does not require legislation. In April 2012, Stanford University parking permit holders who parked inside the "congestion cordon" were invited to participate in the program. Those who enrolled were given passive radio-frequency identification tags to place on their windshield. Entries and exits were tracked by sensing devices at 10 main access points on the Stanford campus during the 7–10 a.m. and 4–7 p.m. periods each weekday, with peak hours defined as 8–9 a.m. and 5–6 p.m. (figure 29). For each automobile detected by the sensors during the off-peak shoulder hours (i.e., 7–8 a.m. and 9–10 a.m. and 4–5 p.m. and 6–7 p.m.), the participant was awarded 10 points.(54) Additionally, CAPRI assigned each participant a "boost day," or a day on which their off-peak trip earned them 30 points. Beginning in May 2013, the project was expanded to incentivize walkers and bicyclists by awarding them between 10 and 25 points, depending on the length of their commutes. Walking and biking activity was monitored using the "My Beats" smartphone application developed for this project. Participants were incentivized by receiving points for commutes during off-peak periods and non-motorized commutes. These points could be redeemed in one of two ways:
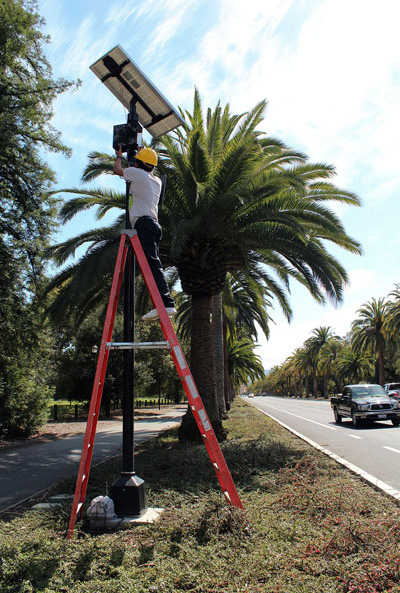 Figure 29. Photograph. Radio frequency identification scanners installed on Stanford University campus for the CAPRI project.(33)
Source: Golden 2012 The game gave cash rewards ranging from $1–$50. The follow-on study of the project found that 87.3 percent of the participants used the random rewards option, validating the theory behind the project. Notably, because participants were allowed to change the manner of redeeming rewards, 13.2 percent of the participants ended up switching from the deterministic option to the random option at some point during the program (figure 30). 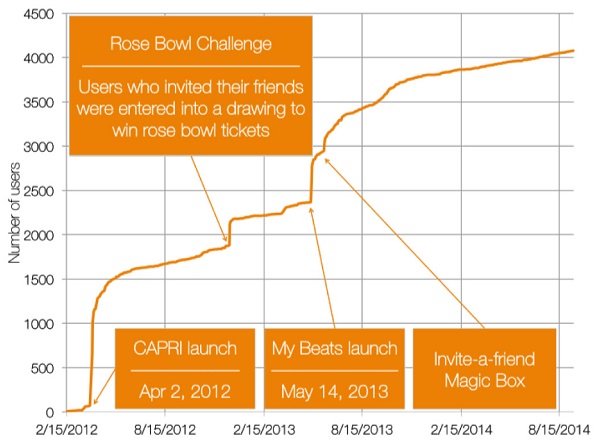 This graph shows number of users from 0 to 4500 on the vertical axis, and dates from February 15, 2012 to August 15, 2014, labeled in six month intervals on the horizontal axis. A line is plotted over the graph, starting at 0 at the lower left, increasing in a nearly straight line at the Congestion and Parking Relief Incentives launch to about 1500 on April 2, 2012. The line increases to about 1800 sometime near the end of 2012, and rises by about 400 when the Rose Bowl Challenge is introduced, which was a drawing for users to win Rose Bowl tickets if they invited their friends to participate in the study. The line increases by about 200 to May 14, 2013 when the My Beats launch is introduced and the line increase to about 2900 at this time. Soon after that event, the Invite a friend magic box was introduces, and participants increased over time to about 4000 on August 15, 2014.
Figure 30. Chart. Number of CAPRI registrants over time.(13) Source: https://forum.stanford.edu/events/posterslides/CapriCongestionandParkingReliefIncentives.pdf. CAPRI also tapped into basic human traits such as the desire to improve one's social status, the desire to connect with friends, and the desire to feel understood to increase the popularity, engagement, and behavior shift among the participants. This was accomplished through a rewards system that encouraged the desired behaviors and made them fun:
Participants Over the 30-month study period, 4,057 Stanford affiliates completed the registration process; this includes 3,082 car commuters and 975 biking/walking commuters. These car commuters included about 30 percent of the 10,290 car commuters in Stanford who were ever eligible to participate. Outcomes A post-project study identified the following results of the CAPRI program:
"The program most certainly helped the university stay below the trip limit," said Brodie Hamilton, director of Stanford’s Parking and Transportation Services, which helped to administer the project. "Data show CAPRI participants are to a large extent avoiding the peak travel times." Since the conclusion of the CAPRI program, Stanford University developed and is currently hosting a "Commute Club" through its Parking and Transportation Services program. This program offers a variety of incentives to the more than 10,000 members who commute to and from the university. Incentives include up to $300 a year in "Clean Air Cash" or carpool credit for not purchasing a long-term parking permit; free carpools and vanpools, along with reserved parking for carpool vehicles; Zipcar driving credit of up to $102 per year; free folding bicycle rental for 1 week along with subsidized purchase of folding bicycles; and the opportunity to win other prizes through regular drawings. Hypothetical Uses of Emerging Technologies and Data
For more information, see https://prabhakargroup.stanford.edu/research/societal-networks/capri-project. CHARM Program in the NetherlandsATDM Approach: ATM Emerging Technologies and Data Currently in Use: ML algorithms for incident prediction, in-car sensor data (e.g., speed, use of brakes, use of lights, use of wipers, steering wheel position, headway to the next vehicle), "autopilot" for traffic controllers, data fusion algorithms (i.e., to integrate floating car data, closed circuit television [CCTV], Twitter, applications, rainfall radars, and emergency services reports), Talking Traffic (i.e., organized use of clustered data and communications), and ability of road users to access traffic management center data.(34) CHARM is the program that will help Rijkswaterstaat to shape traffic management in the right way in the future. It is a smart platform which will be used in the traffic centers and along the road by on duty road inspectors and officers.
The CHARM program (2015 through 2020) is a collaboration project between the Ministry of Infrastructure and Water Management (Rijkswaterstaat in Dutch) and Highways England. The objective is to migrate to an advanced traffic management system (ATMS), supporting all required business processes for network management in an integrated way. The expected outcome of CHARM is an open, modular, high-level information and communications technology architecture for TMCs. It is based on the standardization of TMC requirements by the United Kingdom, the Netherlands, and Belgium ((CHARM Pre-Commercial Procurement [PCP] Common Traffic Management Model Highways Agency, Rijkswaterstaat and Mobiliteit en Openbare Werken, 2019). In addition, CHARM's goal is to achieve an ATMS that is integrated, flexible, scalable, and has the ability to easily incorporate new or additional (third-party) modules (CHARM PCP Project Publishable Summary period 3, 2019). It is expected that the majority of existing applications will be replaced. New modules that will specifically be developed for this architecture will offer significant improvement of traffic management services. The current Rijkswaterstaat scope of the CHARM program covers all regional road traffic control centers and traffic centers in the Netherlands and the approximately 300 future users, such as road traffic controllers, road inspectors, law enforcement entities, and operational traffic experts (Rijkswaterstaat, 2019). Talking Traffic is a collaboration between the Dutch Ministry of Infrastructure and the Environment, 60 regional and local authorities, and national and international private companies. These partners are working together to accelerate development and deployment with regard to retrieving and organizing traffic light data (cluster 1); to process and enrich the distribution of a wide variety of data and convert this into real-time and made-to-measure data sets and information (cluster 2), and to provide this information to a wide variety of road users (cluster 3) though their smartphones, personal navigation devices, and in-car systems.(16, 41) The Pre-Commercial Procurement ProjectThe CHARM PCP project is in many ways an excellent example for future PCPs.
The CHARM PCP project6 was the first step in the CHARM program. This project, which started in 2013 and ended in August 2017, challenged the private sector to develop innovative traffic management modules that fit within a new, flexible, common architecture for TMCs. Each new module is expected to significantly improve traffic management performance. The CHARM PCP resulted in the development of prototypes in the following challenge areas:
In September 2017, the European commission judged the results of the CHARM project to be excellent.
It is expected that the developed innovative modules shown in table 7 will be integrated into a new ATMS traffic management platform. Integration of these modules into the ATMS system will result in an integral and comprehensive TMC with innovative functionalities, all in one platform.
More information on the details of each module can be found in the CHARM PCP in Phase 2 publication.7 The CHARM Advanced Traffic Management System ProjectSmart traffic management is essential for the proper functioning of future road technologies such as smart vehicles and smart infrastructure. CHARM is the solution for providing smart traffic centers to cater to future road needs.
The new traffic management links approximately 30 systems to one national platform. For Rijkswaterstaat, the platform will run in the Government Data Center to which all road traffic control centers are connected (Rijkswaterstaat., 2019). By linking with ATMS software, regional and national stakeholders will have a more uniform collaboration with Rijkswaterstaat. The scope of the CHARM program consists of all core functionalities used to support services and traffic management processes that are delivered from TMCs. This includes the interfaces to roadside equipment from/of internal and external users. The ATMS software package will support the business processes of both Highways England and Rijkswaterstaat, consisting of (Rijkswaterstaat. 2019):
6 The three-phase PCP involved the collaboration of Dutch, Flemish, and English partners (public sector): Vlaamse Departement voor Mobiliteit en Openbare Werken, Rijksdienst voor Ondernemend Nederland, and Innovate United Kingdom. [ Return to note 6. ] 7 https://cordis.europa.eu/docs/projects/cnect/2/318722/080/deliverables/001-NewsletterCHARMPCPinphase2editionJune2015.pdf [ Return to note 7. ] | |||||||||||||||||||||||
|
United States Department of Transportation - Federal Highway Administration |
||