Enhancing Active Transportation and Demand Management (ATDM) with Advanced and Emerging Technologies and Data SourcesChapter 5. Design and Deployment Elements and MethodsWithin this chapter, the design and deployment elements and the methods to facilitate and optimize the use of emerging data sources and technologies are detailed. Design elements can be described as the logical and/or physical (e.g., agencies) data elements. The deployment elements are described as the data sources themselves, the system platforms, and infrastructure. This section discusses these challenges in detail and informs agencies of potential solutions and common approaches to modern active transportation and demand management (ATDM) technology and data enhancements. Before delving into the details of elements and methods, the findings documented in FHWA's case study "Demonstrating Performance-Based Practical Design through Analysis of Active Traffic Management," FHWA-HOP-1-087 are important to introduce.(15) This case study illustrated how a performance-based practical design approach was used to analyze and make tradeoffs when examining potential active traffic management (ATM) strategies. By considering decision criteria in design rather than after deployment, the implementing agency able to optimally provide the greatest benefit. 5.1 Design ElementsEarlier chapters in this document have identified and described in detail the emerging technologies and data sources. Many of these technologies are transforming ATDM practices and enhancing the state of the art. These transformations are forcing agencies look to consider ATDM deployments in new ways. Two high-level technology challenges that should be initially considered include:
Logical Data ManagementAgencies should fully investigate the implications of LDM as the initial step of any ATDM objective. In 2017, FHWA published Scoping and Conducting Data Driven 21st Century Transportation System Analysis,(31) which describes a continuous improvement process (CIP) to integrate data-driven time-dynamic operational analyses within transportation systems management. To illustrate the importance of LDM for data scoping, consider a task to integrate connected vehicle data for ATDM. Based on the desired outputs from analyzing connected vehicle' data, the process and technologies implemented to manage the data may differ greatly. High-resolution connected vehicle' data in raw format, for example, may provide real-time congestion reporting at 100 samples per second, or accelerometer and gyroscope data, which could be leveraged to automatically detect accidents and abnormal driving. For a region, this could result in the need to manage massive data set. Without scoping data management, an agency may not fully understand if storage and processing raw data is necessary, or if aggregating and processing data at the edge would provide the necessary data resolution. Considering the magnitude and velocity of data from sources described in section 2.3 of this document, the scoping of data management will have significant operational and cost implications. Analysis of data for ATDM will largely involve spatiotemporal data sets. For example, modern approaches to incident management may involve correlation of location-based sensor data, including vehicle detection through probe or sensor data, connected vehicle data, crowdsourced data, and other correlation data such as regional events, emergency room capacity, etc. The analysis of spatiotemporal data requires that both temporal and spatial correlations be considered. Analysis based on temporal and spatial dimensions of data adds significant complexity to the data analysis process. Scoping the approach used to enhance, store, and share regional spatiotemporal data is critical to successful implementation of modern ATDM projects. The FHWA guidance, Scoping and Conducting Data-Driven 21st Century Transportation System Analyses,(31) provides information about using the outcomes of the CIP process to drive the selection and implementation of the physical data management tasks described below. Physical Data ManagementThe emergence of the transportation data sources identified earlier indicates that Departments of Transportation (DOTs) will soon be facing significant big data challenges of their own, specifically as it relates to ATDM. Connected travelers, vehicles, and infrastructure will drive growth in data that will enhance transportation systems management and operations (TSMO), but these new data require an information technology (IT) infrastructure, processes, and skills capable of handling data acquisition, marshaling, and analysis. The remainder of this section discusses the physical data management model for modern transportation data, industry and government developments in big data, and emerging data analysis techniques. Characteristics of Big DataAs stated in Integrating Emerging Data Sources into Operational Practice – State of the Practice Review, FHWA-JPO-16-424,(24) the first four V's (volume, velocity, variety, and veracity) are attributes of the data itself, each requiring additional considerations to supplement and modernize traditional systems. While the fifth V (value) is the business benefit that can be created using big data. 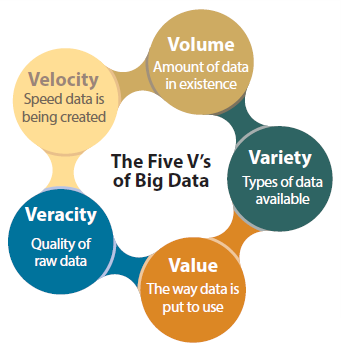 This illustration depicts the five V's of big data. These are: Volume, which is the amount of data in existence; variety, which includes the types of data available; value, which is the way data is put to use; veracity, which is the quality of raw data; and velocity, which is the speed data is being created. Each of the five V's is placed in a circle, and these circles are connected and form a circle around the words the five v's of big data.
Figure 22. Illustration. The five "V's" of big data. Source: FHWA Descriptions of the five V's follow:
5.2 Data SourcesOrganizations planning for ATDM will face a number of hurdles when turning their big data opportunities into meaningful actions. Without proper planning and consideration, a big data solution can turn into an inefficient system with latency and performance issues. Just like a transportation solution for congestion in a growing city, a big data solution should be thoughtfully designed before any physical construction takes place. The process model depicted in table 8 is a useful way of thinking through a big data solution by breaking it into four distinct steps.
AcquisitionAcquisition refers to the collection and preprocessing of data from a variety of systems within the organization (internal sources) and systems outside the organization (external sources). External sources of data frequently require more consideration due to differing data formats, more privacy, governance, and security concerns (e.g., rights to use and distribute, sensitivity of the data, corrupt or malicious files, etc.). Additionally, methods for ingesting data are continuing to evolve and depend on many factors: (1) the volume of data coming in; (2) the data source; (3) how quickly data are needed; and (4) how much preprocessing of data is necessary (e.g., extract/transform/load [ETL]) before being ready for analysis. The methods and characteristics of how data are acquired are important to consider because they can directly affect the capabilities and considerations for how data is marshaled, analyzed, and acted upon. Currently, data acquisition (or ‘constant acquisition') for TSMO agencies is in the form of polling field devices using National Transportation Communications for intelligent transportation system (ITS) protocol or proprietary protocols, accessing data feeds from third parties using Web services, and sharing traveler conditions data with other systems. These questions are intended to be representative, thought-provoking, and extensive, but not exhaustive. More will likely be developed and adapted based on the results of emerging technologies and data sources within ATDM.
MarshalingMarshaling refers to the sorting and storing of data. The five V's are of particular importance when it comes to marshaling the data. The high volume, fast velocity, diverse variety, and questionable veracity of big data require a robust and adaptable storage solution to harness its value. A big data solution should be capable of storing all types of data an organization is interested in collecting at the speed needed to collect and process it for actionable insights. This includes the ability to compress and archive legacy data as well as newly collected data that are not necessary for immediate or frequent analysis.
AnalysisAnalysis refers to how an organization wants to use their data, including the ability to find insights and inform decisions through advanced analytical techniques and visualization. Analysis can be performed at many different speeds and can use a wide variety of tools and techniques. One set of methods uses statistical, descriptive, and predictive models to provide hindsight, insight, and foresight, respectively. For example, predictive models may one day be used to forecast traffic conditions based on weather, incidents, historical traffic data, and other factors. Additionally, new techniques are rapidly emerging to analyze data previously considered too difficult, including unstructured data like text, audio, and video. Improvements in video analytics technologies may make streaming video from closed-circuit television (CCTV) more valuable than it is today. With properly designed acquisition, marshaling, and analysis methods, tools such as live, interactive dashboards can be designed to minimize the time from data ingestion to actionable insights. This is similar to what Performance Measurement System and Transportation Information System are doing for TSMO agencies today with traditional databases and acquisition methods.
Data StorageGiven that the data being collected by the regional systems are coming in various formats (e.g., tabular, video, text, etc.) and types (e.g., structured and unstructured), the process of cleaning, organizing, storing, and managing these data will be of major consequence to the operational success of the regional systems and, by extension, the State DOT repository. Conventional wisdom for all data stored and processed in this scenario is that the data should be secured, fault-tolerant, scalable, and backed up. Additionally, there may be a benefit at the regional traffic management center (TMC) level of compressing and archiving data locally while the responsibility of long-term data storage lies at the Statewide level. Regional systems need to support terabytes (TBs) of data arriving daily. Assuming an initial data size of 100 TBs (data that already exist within these regional systems) and a daily intake of 2.2 TBs of data, a minimum storage capacity of approximately 600 TBs with an increase of 300 TBs approximately every 6 months would be necessary. The larger TMC in this scenario has approximately three times the data of the smaller in all respects, and consequently requires three times the storage as well (i.e., 1.8 petabytes [PB]). It is worth noting here that these rough calculations are for storage of all of the raw data from the emerging sources. This clearly points to the need for aggregation and edge processing of the information in the real-time streaming analytics before it is stored. If this were the case, the demand for storage at all regional systems, and the Statewide repository, will be reduced. Significant system resources (random-access memory or RAM and disk) for processing raw data into aggregations and summaries will still be important. Significant costs can be associated with the acquisition and management of high-performance, PB-scale storage solutions. Many agencies opt to utilize cloud-based solutions, which offer subscription-based models to right-sized and scalable storage services. Data SharingImpacts on Big Data Tools and Technology Deployment Due to Agency Needs for Data Sharing Traffic management agencies and TMCs continue to evolve towards more cross-jurisdictional data-sharing functions and coordination with peer and partner agencies through both technical systems and communication methods. As the connected traveler and connected vehicle data sources emerge, the needs to share information with partners will never be greater. As has been true in traffic management for years, travelers do not perceive crossing of jurisdictional boundaries; they simply expect systems, functions, and services to work regardless of the jurisdiction. In particular, when dealing with trajectory data from physical data management, commercial connected vehicles, and connected travelers, starting and ending points of trajectories will invariably fall outside of agency boundaries for a significant portion of trips. Holistic views of systems such as regional emissions models will invariably be made better with regional data sharing. In this section, we discuss some of the issues related to data sharing and big data tools and technologies with respect to several types of institutional relationships, including:
The volume, variety, velocity, and veracity of connected traveler, connected vehicle, and connected infrastructure data will put TSMO agencies firmly into the realm of big data. 5.3 System PlatformsThe technology supporting big data and cloud-scale systems continues to evolve, offering a myriad of choices to agencies that may help them meet their ATDM objectives. This section is intended to discuss solutions at the general level and provide suggested practices for selecting services supporting ATDM implementations. Historically, the primary technology choice for agencies has been whether to host data and systems on-premise, in the cloud, across multiple clouds, or using a hybrid approach. These concepts are discussed on the following page.
As of 2019, many emerging technologies exist that provide increased flexibility to agencies when selecting which platforms are utilized to deploy their ATDM solutions, including:
The ability to deploy and migrate systems and data across a variety of platforms allows agencies to build ATDM solutions based on business needs, without the constraint of utilizing a single cloud vendor or technology stack. Considerations
5.4 InfrastructureAs stated earlier, deployment elements of a system can be divided into three broad categories: data sources, system platforms, and infrastructure. Data sources and system platforms have been addressed above. Field infrastructure is addressed below. Field InfrastructureATDM solutions can present unique challenges with regards to field infrastructure design. The structural and geometric design must be evaluated. Specific design features for existing and future field infrastructure may impact the development and deployment of ATDM solutions. Fixed ObjectsConsidering fixed objects, the implementation of ATDM solutions may impact the clear zone, either through the installation of additional roadside equipment (e.g., shoulder-mounted signage) or the proximity of moving traffic to fixed objects. For example, fixed objects may be within the clear zone if dynamic shoulder lane use, dynamic lane use, or dynamic lane reversal is in operation, and if drivers leave the roadway, they have a higher chance of striking an object before recovering. Thus, agencies may elect to place new objects outside the clear zone, remove fixed objects if possible, relocate them beyond the clear zone, or shield them with barriers if they are in a place where they are likely to be struck. Overhead ClearanceSome deployment of ATDM-related solutions may involve the installation of new structures, such as overhead gantries and sign bridges. New structures need to meet existing clearance minimums. These solutions may also have an impact on overhead clearance with existing devices such as sign bridges. Geometric DesignInterchange geometrics are important when implementing such ATDM solutions as adaptive dynamic ramp metering, dynamic junction control, or dynamic lane use control. For example, ramp modifications may be necessary to accommodate additional capacity for ramp metering strategies. Design elements of any ATDM strategy that may have a fundamental impact on the facility should include pavement and signing designs and general design requirements, including controlling criteria and minimum American Association of State Highway and Transportation Officials values. These include but are not limited to:
5.5 Technology TestingTechnology testing is an integral part of deployment of ATDM. Technology testing is the process of analyzing a system or a component by providing defined inputs and comparing them with the desired outputs. Testing can be divided into two categories: manual testing or automated testing. Manual testing is, as the name suggests, done manually (i.e., requires human input, analysis, and evaluation). Automated testing is the automated version of manual software testing; using automation helps in avoiding any human errors. The error may occur due to humans getting tired of a repeated process. Automated testing programs will not miss a test by mistake. The automated test program will also provide the means of storing the test results accurately. The results can be automatically fed into a database, which can be used to provide necessary statistics on how an ATDM solution is performing. Objectives of automated testing are as follows:
5.6 Public OutreachData privacy and cybersecurity are of vital concern to both an implementing agency and the general public. A balance between public outreach and security is not unique to the transportation domain. For transportation systems, the standard for analysis of security for application information flows is based on Federal Information Processing Standard (FIPS) 199, device class security controls are based on FIPS 200 and National Institute of Standards and Technology Special Publication 800-53. Regarding data privacy, The Privacy Act of 1974 protects the personal information the Federal Government collects and regulates how it can disclose, share, provide access to, and keep the personal information that it collects. The discussion of privacy might include the following: a stated privacy policy, clear delineation for handling PII, a statement of information collected, and bounds of data use including shared information cookies and other tracking devices. To keep the public informed, note the clarity for the need for public outreach in the ‘Cybersecurity 2020 Census' statement": "We will maintain the public's trust and confidence by protecting their data and keeping them informed." (48) https://www2.census.gov/cac/sac/meetings/2018-12/smith-cybersecurity-public-trust.pdf | |||||||||||||||||
|
United States Department of Transportation - Federal Highway Administration |
||