Enhancing Active Transportation and Demand Management (ATDM) with Advanced and Emerging Technologies and Data SourcesChapter 3. Active Transportation and Demand Management ApplicationsThis chapter discusses the specifics of the active transportation and demand management (ATDM) solutions and approaches and how they can be enhanced using the technologies and data sources described in chapter 2. Figure 12 depicts the challenge and tremendous opportunity that is faced by the implementers of ATDM solutions. Nearly all ATDM and/or advanced transportation management system (ATMS) deployments have the same basic functions, they:
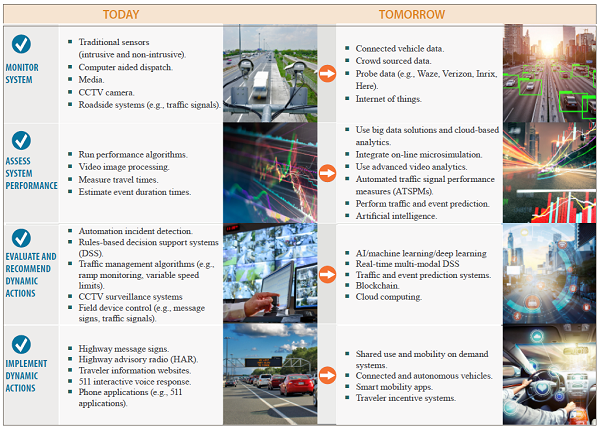 This info graphic is set up like a table with two columns labeled today and tomorrow. The columns are divided into four rows labeled as monitor system, assess system performance, evaluate and recommend, dynamic actions, and implement dynamic actions. For the monitor system row, the items listed for today are: Traditional intrusive and non-intrusive sensors, Computer aided dispatch, media, CCTV camera, and Roadside systems, for example, traffic signals. For the monitor system row, the items listed for tomorrow are: Connected vehicle data, Crowd sourced data, Probe data, for example, Waze, Verizon, Inrix, and Here), and Internet of things. For the assess system performance system row, the items listed for today are: Run performance algorithms, Video image processing, Measure travel times, and Estimate event duration times. For the assess system performance system row, the items listed for tomorrow are: Use big data solutions and cloud-based analytics, Integrate on-line microsimulation, Use advanced video analytics, automated traffic signal performance measures (ATSPMs), Perform traffic and event prediction, and Artificial intelligence. For the evaluate and recommend dynamic actions row, the items listed for today are: Automation incident detection, Rules-based decision support systems (DSS), Traffic management algorithms (e.g., ramp monitoring, variable speed limits), CCTV surveillance systems, and Field device control (e.g., message signs, traffic signals). For the evaluate and recommend dynamic actions row, the items listed for tomorrow are: AI/machine learning/deep learning, Real-time multi-modal DSS, Traffic and event prediction systems, Blockchain, and Cloud computing. For the implement dynamic actions row, the items listed for today are: Highway message signs, Highway advisory radio (HAR), Traveler information websites, 511 interactive voice response, and Phone applications, for example, 511 applications. For the implement dynamic actions row, the items listed for tomorrow are: Shared use and mobility on demand systems, Connected and autonomous vehicles, Smart mobility apps, and Traveler incentive systems. This info graphic is set up like a table with two columns labeled today and tomorrow. The columns are divided into four rows labeled as monitor system, assess system performance, evaluate and recommend, dynamic actions, and implement dynamic actions. For the monitor system row, the items listed for today are: Traditional intrusive and non-intrusive sensors, Computer aided dispatch, media, CCTV camera, and Roadside systems, for example, traffic signals. For the monitor system row, the items listed for tomorrow are: Connected vehicle data, Crowd sourced data, Probe data, for example, Waze, Verizon, Inrix, and Here), and Internet of things. For the assess system performance system row, the items listed for today are: Run performance algorithms, Video image processing, Measure travel times, and Estimate event duration times. For the assess system performance system row, the items listed for tomorrow are: Use big data solutions and cloud-based analytics, Integrate on-line microsimulation, Use advanced video analytics, automated traffic signal performance measures (ATSPMs), Perform traffic and event prediction, and Artificial intelligence. For the evaluate and recommend dynamic actions row, the items listed for today are: Automation incident detection, Rules-based decision support systems (DSS), Traffic management algorithms (e.g., ramp monitoring, variable speed limits), CCTV surveillance systems, and Field device control (e.g., message signs, traffic signals). For the evaluate and recommend dynamic actions row, the items listed for tomorrow are: AI/machine learning/deep learning, Real-time multi-modal DSS, Traffic and event prediction systems, Blockchain, and Cloud computing. For the implement dynamic actions row, the items listed for today are: Highway message signs, Highway advisory radio (HAR), Traveler information websites, 511 interactive voice response, and Phone applications, for example, 511 applications. For the implement dynamic actions row, the items listed for tomorrow are: Shared use and mobility on demand systems, Connected and autonomous vehicles, Smart mobility apps, and Traveler incentive systems.
Figure 12. Infographic. Advanced transportation demand management today and tomorrow. Source: FHWA Through the emergence of new data sources and technologies, the way ATDM will be performed is expected to improve. These transformational changes include:
3.1 Active Transportation and Demand Management ApproachesThis section discusses specifics on how new technologies and data sources can be used to improve ATDM solutions. Active Traffic Management using Emerging Technologies and Data SourcesActive traffic management (ATM) deals with dynamically managing recurrent and non-recurrent congestion based on prevailing and predicted traffic conditions. It increases throughput and safety through the use of integrated systems and includes automation of dynamic deployment to optimize performance quickly without the delay that occurs when operators must deploy operational strategies manually. ATM approaches focus on influencing travel behavior with respect to lane/facility choices and operations. The use cases and descriptions later in this section discuss operational ATM solutions and how they can be improved through the enhanced technology and data sources identified in chapter 2. It should be noted that many ATDM deployments include multiple solutions at once, i.e., a "typical" ATM corridor often employs dynamic lane use, dynamic shoulder use, VSLs and adaptive ramp metering simultaneously. A clear example of how ATM is enhanced via an innovative new technology or data source is through the use of connected vehicle applications (e.g., vehicle to infrastructure [V2I] and vehicle to others [V2X]), which include smartphone V2X applications. Today, for most ATM applications, intrusive or non-intrusive traffic detectors are used to assess real-time traffic flows for ATM algorithms. Other incident detection methods are used to identify non-recurrent conditions such as crashes. These technologies include CAD systems, video image processing systems (VIPS), and automatic incident detection (AID) algorithms. Through the use of connected vehicle data, more granular traffic probe data can be obtained directly from vehicles. These data are much more granular and accurate; hence they can improve the timeliness and accuracy of many ATM functions. These data can augment or replace other current data sources used today. Also, dissemination of information to the motorist can be greatly improved through connected vehicle technology, including connected vehicle applications. For example, dynamic speed limits recommendation can be transmitted directly to the vehicle rather than via expensive roadside signs. Similarly, queue warning, weather warning, and dynamic shoulder use messages can go directly to the driver, which will improve overall operations and maintenance (O&M) costs. See the end of this section for descriptions of how advanced and merging technologies and data sources that can provide benefit to ATDM, mapped against the steps of the active management cycle. Active Demand Management using Emerging Technologies and Data SourcesActive demand management (ADM) uses information and technology to dynamically manage demand, which includes redistributing travel to less congested times of day or routes or reducing overall vehicle trips by influencing a mode choice. ADM seeks to influence more fluid, daily travel choices to support more traditional, regular mode choice changes. Some example ADM applications that can be improved via enhanced data sources and technologies include dynamic routing, pricing, and predictive travel times. Systems that have deployed predictive travel times include the San Diego Integrated Corridor Management System (ICMS), which leverages microsimulation tools and historical data to implement traffic predictions. Today, ML can be used to improve these same capabilities as can big data, cloud computing, and new probe-based data sources. Implementation of dynamic routing can be a tricky task, especially the methods that are used to recommend alternate routes. This is where the use of smartphone applications including crowdsourced applications may be beneficial. If a transportation agency desires to have traffic rerouted to avoid a serious accident, they can leverage these applications to direct drivers to the alternates that they prefer, such as alternatives where they can adjust traffic signal timings accordingly. Dynamic pricing algorithms can be improved through the use of more enriched data sources (e.g., connected vehicle data, probe data, etc.) where big data and cloud computing can be leveraged for the best dynamic pricing options/recommendations. See the end of this section for descriptions of how advanced and merging technologies and data sources can provide benefit to ATDM, mapped against the steps of the active management cycle. Active Parking Management using Emerging Technologies and Data SourcesActive parking management (APM) is the implementation of dynamic management of parking facilities to optimize performance and utilization of those facilities while influencing travel behavior at various stages along the trip making process: i.e., from origin to destination. Dynamically managing parking can affect travel demand by influencing trip timing choices, mode choice, and parking facility choice at the end of the trip. This ATDM approach can also have a positive impact on localized traffic flow by providing real-time parking information to users and ensuring the availability of spaces to reduce circling around parking facilities. A key example where APM can make the best use of enhanced technologies and data sources is for dynamic wayfinding. Today, systems like the San Francisco Smart Parking and Los Angeles Express Park perform parking availability detection using traditional means such as streetline detectors or parking proximity sensors. Newer technologies can do this in a more efficient manner, e.g., CCTV cameras with video analytics can monitor large parking lot areas with a single camera. Also, the means to direct people to available parking spaces can be done using smartphone applications in addition to roadside message signs. Active Transportation and Demand Management Improvements using Emerging Technologies and Data SourcesSee below for a depiction of advanced and merging technologies and data sources that can provide benefit to ATDM, mapped against the steps of the active management cycle. Stage 1 — System Monitoring Enhancements for Active Transportation and Demand ManagementMonitoring for system conditions such as roadway congestion levels, traffic incidents, construction activities, and weather conditions can be improved or enhanced by using these data sources or technologies:
Also, new mapping technologies such as crowdsourced mapping and high-definition (HD) mapping can assist with the common operating picture (COP) used within system monitoring tools. The use of cloud computing, big data, and data analytics can aid with performing system monitoring, especially as it relates to monitoring large amounts of complex data. Stage 2 — Assess System Performance for Active Transportation and Demand ManagementWithin current ATM solutions, real-time systems utilize algorithms and other basic analytic tools to assess system performance. This can include real-time COP mapping for observing conditions as they unfold. There are some modern and emerging technologies that can improve how, and how accurately, performance is assessed. Some of the best emerging technologies include the use of big data and data analytics engines to assess the vast amounts of data that are being collected. In the future, there will likely be much larger and more granular data available from likely sources such as connected vehicle data. One of the key benefits of big data analytics is that they can aid at providing insights into data correlations that humans would not naturally see. Other key technologies that can aid in assessing system performance are AI tools, which include ML and DL. Through programming with AI tools, the conclusions of system performance can be greatly improved. One example is that AI can aid with prediction of traffic conditions and events, which is a much more proactive approach, i.e., ATDM systems will then be able to assess not only current performance but future performance. Performance can also be assessed in real-time using more advanced video analytics technology, which includes solutions that can identify traffic flow performance issues or other traffic event or incident issues. This includes wrong way driving, stalled vehicles, fire and smoke detection, etc. Stage 3 — Evaluate and Recommend Dynamic Actions for Active Transportation and Demand ManagementThe next stage of the active management cycle is to evaluate and recommend dynamic actions based upon the performance assessments completed during Stage 2. This is where DSS can be improved. AL, ML, and DL can enhance DSS, which includes the concept of basing decisions on future predictions rather than just upon current conditions only. On-line microsimulation tools offer a way to assess and evaluate strategies in real-time to determine which strategies will work most successfully. Cloud computing and more advanced data analytics can be used as well to evaluate the dynamic actions. With the appropriate computing power and/or cloud computing environments, these analytics can be done very quickly. Edge computing can also be used to analyze conditions and behavior such as video analytics, pedestrian detection, and poor local traffic signal performance. Stage 4 — Implement Dynamic Actions for Active Transportation and Demand ManagementNew emerging technology can be used to implement the ATDM actions as well. This includes the following:
Use CasesThis section discusses use cases for applying emerging technologies and data sources to improve how ATDM is accomplished. The use cases provide examples of what is being used now, and what can be enhanced using new technologies and data sources. Use Case 1: Recurring Congestion on Freeways and HighwaysBrief DescriptionOn weekday mornings, recurring freeway congestion occurs as commuters travel into the metropolitan area to report to work. Actors
Pre-conditions
Basic Flow: Currently in UseFigure 13 is a representation on this use case without advanced or emerging technologies and data sources applied. 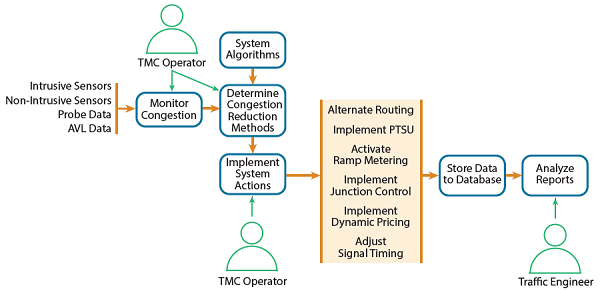 This diagram shows the flow of information used to reduce congestion using Active Transportation and Demand Management software. The diagram flow begins on the left side where a Transportation Management Center Operator makes use of intrusive sensors, Non-Intrusive Sensors, Probe Data, and Automatic vehicle location data to monitor congestion. The Transportation Management Center Operator then determines the Congestion Reduction Methods that are based on system algorithms and then the operator implements the system actions that include Alternate Routing, Implement PTSU, Activate Ramp Metering, Implement Junction Control, Implement Dynamic Pricing, and Adjust Signal Timing. After implementation of one of these methods, data is stored to a database and a traffic engineer can then analyze reports generated from the data. This diagram shows the flow of information used to reduce congestion using Active Transportation and Demand Management software. The diagram flow begins on the left side where a Transportation Management Center Operator makes use of intrusive sensors, Non-Intrusive Sensors, Probe Data, and Automatic vehicle location data to monitor congestion. The Transportation Management Center Operator then determines the Congestion Reduction Methods that are based on system algorithms and then the operator implements the system actions that include Alternate Routing, Implement PTSU, Activate Ramp Metering, Implement Junction Control, Implement Dynamic Pricing, and Adjust Signal Timing. After implementation of one of these methods, data is stored to a database and a traffic engineer can then analyze reports generated from the data.Figure 13. Diagram. Recurring congestion use case (traditional). Source: FHWA A description of the stages follows:
Basic Flow: Emerging Technologies and Data SourcesFigure 14 is a representation on this use case with advanced or emerging technologies and data sources applied. 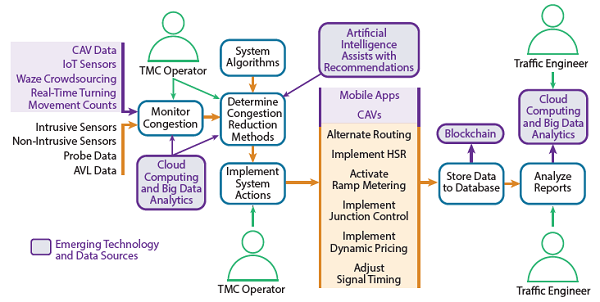 This diagram shows the flow of information used to reduce congestion using Active Transportation and Demand Management software, with additional emerging technology and data sources input. The diagram flow begins on the left side where a Transportation Management Center Operator makes use of intrusive sensors, Non-Intrusive Sensors, Probe Data, and Automatic vehicle location data to monitor congestion, and gets additional input from emerging technology and data sources of data, Internet of things Sensors, Waze Crowdsourcing, Real-Time Turning, and Movement Counts. Also, cloud computing and big data analytics provide information for monitoring the congestion. The Transportation Management Center Operator then determines the Congestion Reduction Methods that are based on system algorithms, with additional input from emerging technology and data source cloud computing and big data analytics and uses emerging technology and data source artificial intelligence that assists with the congestion reduction recommendation. Then the operator implements the system actions that include Alternate Routing, Implement HSR, Activate Ramp Metering, Implement Junction Control, Implement Dynamic Pricing, and Adjust Signal Timing with additional actions from emerging technology and data sources mobile applications and Connected and autonomous vehicles. After implementation of one of these methods, data is stored to a database and an Emerging Technology and Data Sources blockchain. A traffic engineer can then analyze reports generated from the data and enter this information into the Emerging Technology and Data Sources Cloud Computing and Big Data Analytics source.
Figure 14. Diagram. Recurring congestion use case with new data and technology. Source: FHWA A description of the stages follows:
Post ConditionsSuccessful ConditionCongestion is detected more quickly. Congestion and delay levels are more accurate. More appropriate implementation actions are recommended and implemented. The system learns and improves itself over time. Better analytics and reporting. Recurring freeway congestion is measurably reduced. Failure ConditionDetection times and congestion level accuracy are only marginally improved. Freeway congestion is not reduced. Implementation improvements are only marginal when compared to cost. Use Case 2: Major Incident on FreewayBrief DescriptionA typical ATDM use case is related to how a major freeway incident is detected, the decisions made on how to respond to the incident, and the method(s) to respond to the incident. Figure 15 represents a use case on how a typical freeway incident is handled, keeping in mind that there are different options and variations that can be employed. 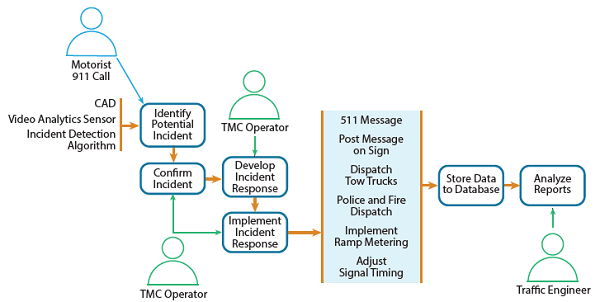 This diagram shows the flow of operations in a traditional incident management case. Identifying a potential incident begins through input from a motorist making a 911 call or from Computer aided dispatch, video analytics sensor, or an incident detection algorithm. A Transportation Management Center Operator then confirms the incident, develops an incident response, and then implements the incident response. The incident response can be a 511 message, posting of a message on a sign, dispatching tow trucks, dispatching fire or police, implementing ramp metering, or adjusting signal timing. Following the response, data is stored in a database and a traffic engineer analyzes reports based on the data.
Figure 15. Diagram. Incident management use case (traditional). Source: FHWA Actors
Preconditions
Basic FLow: Currently in Use
Figure 16 characterizes the same freeway incident management use case but introduces new data sources and technologies. 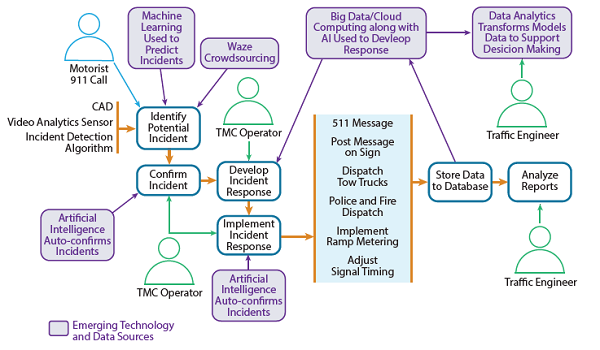 This diagram shows the flow of operations in an incident management case using emerging technology and data sources. Identifying a potential incident begins through input from a motorist making a 911 call, from Computer aided dispatch, video analytics sensor, or an incident detection algorithm, or emerging technology and data sources machine learning used to predict incidents or Waze crowdsourcing. A Transportation Management Center Operator, or an emerging technology and data sources artificial intelligence program auto confirms the incident. Then the Transportation Management Center Operator or emerging technology and data sources big data cloud computing along with artificial intelligence develops an incident response. The Transportation Management Center Operator, or an emerging technology and data sources artificial intelligence program auto confirms the response and then implements the incident response. The incident response can be a 511 message, posting of a message on a sign, dispatching tow trucks, dispatching fire or police, implementing ramp metering, or adjusting signal timing. Following the response, data is stored in a database and a traffic engineer analyzes reports based on the data. In addition, the stored data is input into the emerging technology and data sources big data cloud computing and artificial intelligence component. Finally, the emerging technology and data sources big data cloud computing and artificial intelligence component inputs information into the emerging technology and data sources data analytics system that transforms model data to support future decision making, including input from a traffic engineer.
Figure 16. Diagram. Incident management use case (new technology and data sources). Source: FHWA Basic Flow with Emerging Technologies and Data Sources
Post ConditionsSuccessful ConditionThe incident is cleared, and traffic is cleared in a timely manner. Failure ConditionThe incident is cleared, but not in a timely manner, or causes additional incidents. Use Case 3: Parking Near the AirportBrief DescriptionIn preparation for a week-long trip, a traveler is examining options for parking his vehicle near the airport. Actors
Preconditions
Basic Flow: Currently in UseFigure 17 depicts a typical airport parking use case. 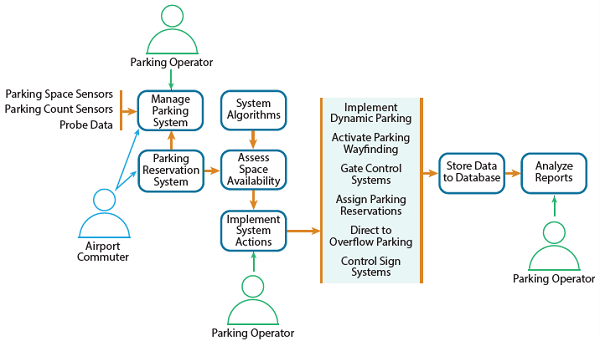 This diagram shows the flow of information in a typical airport parking use case. The diagram flow begins on the left side where a Parking Operator makes use of parking space sensors, parking count sensors, probe data, and input from the parking reservation system and airport commuters to manage a parking system. This data, along with input from system algorithms assesses parking space availability. The space availability along with input from the Parking Operator then implements the system actions that include implement dynamic parking, activate parking wayfinding, gate control systems, assign parking reservations, direct to overflow parking, and control sign systems. After implementation of one of these methods, data is stored to a database and a parking operator can then analyze reports generated from the data.
Figure 17. Diagram. Airport parking use case (traditional methods). Source: FHWA
Basic Flow: Emerging Technologies and Data SourcesFigure 18 represents the same parking system use case but uses merging technologies and data sources. 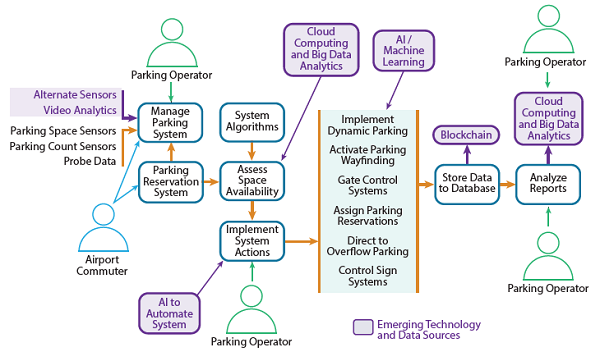
This diagram shows the flow of information in an airport parking use case where Emerging Technology and Data Sources are used in addition to the typical inputs. The diagram flow begins on the left side where a Parking Operator makes use of parking space sensors, parking count sensors, probe data, input from the parking reservation system, airport commuters, and Emerging Technology and data sources of alternate sensors and video analytics to manage a parking system. This data, along with input from system algorithms and emerging technology and data sources cloud computing and big data analytics assesses parking space availability. The space availability along with input from the Parking Operator and emerging technology and data sources artificial intelligence to automate the system, then implements the system actions that include implement dynamic parking, activate parking wayfinding, gate control systems, assign parking reservations, direct to overflow parking, control sign systems, and emerging technology and data sources artificial intelligence and machine learning. After implementation of one of these methods, data is stored to a database and a parking operator can then analyze reports generated from the data. After implementation of one of these methods, data is stored to a database and an Emerging Technology and Data Sources blockchain. A parking operator can then analyze reports generated from the data and enter this information into the Emerging Technology and Data Sources Cloud Computing and Big Data Analytics source. Figure 18. Diagram. Airport parking use case (new technologies and data sources). Source: FHWA
Post ConditionsSuccessful ConditionThe vehicle is able to park in the reserved spot. Failure ConditionThe reserved spot was not available, leaving the driver to search for another. |
|
United States Department of Transportation - Federal Highway Administration |
||