Multimodal System Performance Measures Research and Application: Innovation and Research PlanChapter 3. Research FindingsLiterature ReviewThe literature review found no "ideal" or universal multimodal transportation system performance measure or approach. There is clearly a strong focus on measuring performance through speed, delay, and reliability. The identified measurement processes focus most substantially on the performance of the highway system, for reasons of historical priority naturally buttressed by the most prolific data, now being enhanced through crowdsourced data from GPS devices. Transit performance measurement is making progress, aided by the increased use of automated vehicle locator (AVL) technology that provides continuous information on vehicle position that can be used to determine speed, delay, and on-time performance. The same types of technology innovations have not made their way to the non-motorized modes, although automatic counting devices are beginning to return data on usage for some bicycle facilities. Discussions with a wide cross-section of experts and practitioners in the field supported the findings of the literature review: no method truly compares and accounts for all of our modal options in the planning and programming process, which sustains modal thinking and program silos. At the same time, discussions indicated a high level of interests in pursuing, defining and testing such a method. An "Ideal" MeasureThe literature review task confirmed the findings of the project work statement that transportation system performance measurement continues to be modally oriented. The orientation is primarily due to data limitations, resulting in a mode specific, facility-based analytical framework. This framework has become so ensconced in the profession that it is taken as a given. Thus, an "ideal" measure faces not only data challenges but conceptual and acceptance challenges as well. Chapter 2 presents the reasons why a complete person trip perspective is best suited for an "ideal" multimodal measure. Complete person trips reflect a traveler's perspective, provide a rational basis for defining the system, and reduce aggregation challenges. The "ideal" measure should also be easily understood by professionals and travelers and provide feedback on system performance at any selected location, regardless of size, across the United States. Finally, because it provides a new perspective, the "ideal" measure can become a capstone for a new set of related, complete, trip-based measures. The research team developed MSP as the "ideal" measure of multimodal transportation system performance. Productivity is the ratio of inputs to outputs in a production process and, for transportation systems, completed person trips are outputs, and network travel times are production inputs. The MSP is the number of completed person trips per minutes over a selected network/area and during a selected travel time. The higher the score, the higher the productivity. Table 1 illustrates a calculation method for the MSP (others are certainly possible). Eight differing complete person trips are listed in table 1 along with travel times for each under three scenarios. Trips per minute for each trip is totaled across all trips to calculate the MSP. The first scenario presents a base condition. In scenario 2, the travel times for trips 4 and 5 increase, reducing the MSP to 0.26. In scenario 3, scenario 1 travel times stay the same, but a walk trip is added to raise the MSP to 0.32. It is worth noting that even though the added walk trip is slow, its overall travel time is consistent with the other trips, thereby raising the score. The MSP measure is designed to provide feedback on the three performance perspectives listed in the last chapter:
Data Gap AnalysisAs noted in chapter 2, the MSP requires continuous and traced complete trip data. It also requires detailed network information. Standardized and detailed network data are readily available from several propriety and non-proprietary sources. Non-proprietary sources include Open Street for roadways, bicycle, and pedestrian facilities and General Transit Feed Specification (GTFS) for transit. Complete person trip information is more elusive. Private companies such as Google, Apple, and Cubq, are collecting the data from mobile phones and GPS devices. GPS data provides accurate information but with small sample sizes. Based on GPS data, location-based services (LBS) data from mobile phone apps provide the same accuracy for an increasing number of trips. The recommended MSP measure requires continuous and traceable complete trip information. Given the current limitations of such data, the research shifted to assessing the extent and quality of more conventional travel data collected through electronic traffic counting technology, transit AVL and passenger counter (known as APC) systems and GTFS-fed traveler information systems, and bicycle-pedestrian counting programs. Those data require surrogate measures, ones that attempt to replicate the MSP with the limited data. The first surrogate measure is total person trips, which approximates the MSP by estimating total system demand for any given time period. Person trips is the summation of total trips across study area segments. The second is "weighted person trips," which approximates the productivity of travel across the network. Weighted person trips is estimated in three steps, the first calculating PMT by segment (segment person trips multiplied by segment length), the second summing PMT across facility segments within the pilot test study area, and the third dividing the summed PMT by the total travel time across those same facility segments. Pilot TestsThe three pilot tests conducted for this research determined the quality of data collected and the feedback from surrogate measures described in the last section. Specifically, the pilot tests determined how well the surrogate measures answered questions such as:
Pilot Test LocationsA national scan of potential pilot test sites proved challenging because of the lack of multimodal data at any potential location. The lack of data was particularly true for bicycle and pedestrian data. The scan resulted in three pilot locations:
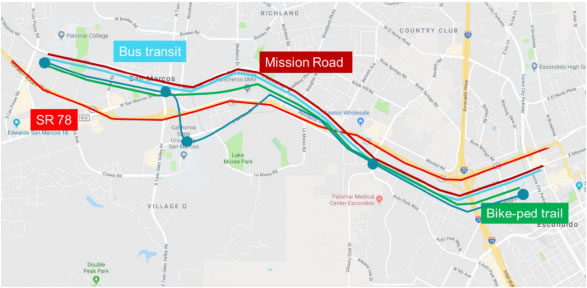
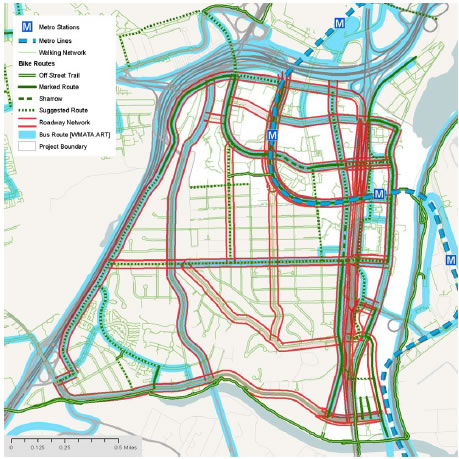
The pilot tests measured performance from differing perspectives. The San Diego pilot tested the surrogate measures across a multimodal corridor. In both the Crystal City and Philadelphia pilots, the perspective changed to measuring performance of trips beginning or ending in the study area. The San Diego corridor was divided into three segments. The California Department of Transportation (Caltrans) provided the SR 78 count and travel time data, the North County Transit District (NCTD) provided count and travel-time data for its Sprinter rail and local bus transit systems. Bicycle and pedestrian counts, not travel times, were provided by the San Diego Association of Governments (SANDAG) for three locations along the corridor's bicycle and pedestrian trail. In Philadelphia, the Delaware Valley Regional Planning Commission (DVRPC) collected highway, transit, bicycle, and pedestrian count data along a cordoned area surrounding downtown Philadelphia. The count locations have remained consistent during differing data collection periods so that DVRPC could track changes in travel among modes over time. Data collection periods extended over short periods (1 or 2 days at most). DVRPC did not collect travel times. The study team developed roadway data in Crystal City from crowdsourced data provided by StreetLight, which were checked against a limited set of traffic count data provided by Arlington County. The StreetLight data was averaged by hour and month, and included segment vehicle counts, segment travel times, and origin-to-destination travel times and distances. The Washington Metropolitan Area Transit Authority (WMATA) provided tap-on and tap-off records for riders either entering or exiting the Metro transit system at the Pentagon City and Crystal City stations. Bus data from both WMATA and Arlington Transit provided daily on and off information for study area stops, but not information about travel times on the system. Arlington County provided bicycle and pedestrian count information from four locations in the study area. Bicycle and pedestrian travel time data were not available. 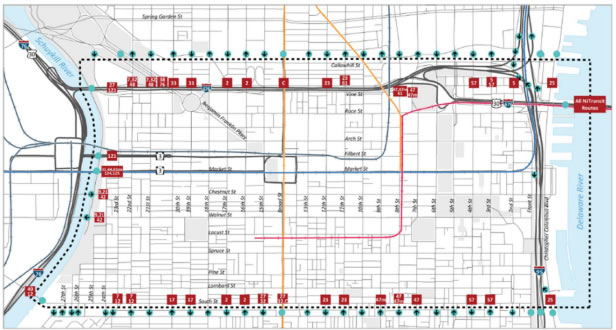 Figure 6. Map. Downtown Philadelphia study area (image provided by Delaware Valley Regional Planning Commission).5
ResultsData. To the extent they could be cross-checked, the facility-based, pilot-test data appeared accurate. The biggest data issues were inconsistencies in the timing, location, and types of travel data, making it difficult to paint a complete picture of multimodal performance for any of the pilots. Measures. Despite inconsistent and incomplete data, the surrogate measures provided both expected and insightful feedback on multimodal performance. Insights of note include the following:
ObservationsCompleteness and Quality of Data. The notable data problem uncovered by the pilot tests was the challenge of obtaining complete trip data. At the time of the tests, only complete auto vehicle trip data were available, and those data were provided as hourly averages by month, not continuous over small time slices. Because complete trip data were not available, pilot test results were unable to test the MSP measure (completed person trips per network minute). The pilot tests uncovered other data problems, most notably the lack of coordination among agencies and modes when collecting travel data. An exhaustive national scan of potential pilot test sites identified only one location, downtown Philadelphia, with a coordinated multimodal data collection effort. The scan made it apparent that bicycle and pedestrian data are scarce, thus the availability of those data became the primary criterion when contacting agencies. Even with reasonable bicycle and pedestrian data, it was difficult to find locations where data from differing modes were collected during the same time periods, indicating that most data collection efforts support single mode performance measurement, not multimodal measurements. System DefinitionConfirming the system definition challenge highlighted in chapter 2, defining the pilot test networks was difficult because of the lack of information about travel demand and how it related to the selected networks. The study team defined the networks for two of the pilot studies (the Philadelphia pilot area was defined by the DVRPC). The San Marcos to Escondido study area was easier to define because it was larger than Crystal City (demand and network differences increase as the geographic focus increases) and because the network has a one-dimensional (east- west) orientation. Experience with travel demand in similar corridors, rather than a data based rationale, played a part in how to bound the study area. Crystal City presented a greater challenge because it was smaller and was designed to reflect how well the transportation system serves a place-based destination. Decisions about how to define the network were complicated. The most clear-cut decision was to include only ramps and not the mainlines of the expressways on the edge of Crystal City. This eliminated through trips from the analysis. Such decisions could not be made for arterials and transit. When reporting on the relationships for major roads and premium transit in both the San Marcos to Escondido corridor and Crystal City, it had to be assumed that those networks served the same travel markets, a necessary and often taken-for-granted assumption in segment-oriented performance measures. It was possible in Escondido and Crystal City that the roadway and transit travel markets differ significantly, thereby leading to the erroneous conclusion that the major facilities in both areas worked together to serve demand. This potential travel market disparity was particularly true in Crystal City, where the network extended in several directions. To address this issue, the Crystal City pilot added an assessment of travel along the north-south US-1 and Metrorail corridor. Even then, the relationships between travel markets on both facilities likely differed because of differences in the areas served by the roadway and transit networks. Aggregation Challenges. For reasons described in chapter 2, aggregating modal segment information into a single system measure was difficult. For the person trip surrogate measure, screenlines were used to account for over-counting person trips on segments. For the weighted person trip measure, segment person trips were multiplied by segment lengths and divided by travel times across aggregated segments. In addition, it was difficult to create apples to apples aggregations across modes. This was particularly true for Crystal City where the network extends in different directions. Ultimately, the Crystal City segments were organized around the US-1 and Metrorail corridor. What If?Assuming complete person trip data were available for all three sites, it is likely the pilot test analysis could have been simpler and the feedback more straightforward and understandable. Areas, not networks, would have been selected and subdivided by parcels, geography based on U.S. Census Bureau data, or traffic analysis zones. Complete person trip data for a defined time period would have been collected for each subdivision with dynamic networks defined by the traced paths of those trips. An MSP score for each subdivision would have been determined by first calculating the number of person trips traveling between each subdivision (origin) and destination (origin-destination, or OD, pair), then dividing the total by the travel time between the OD pair, then summing the scores for all pairs (similar in concept to the example in table 1). The areawide MSP would be the summation of all OD pair scores. The overall MSP score could have been stratified in many ways, such as by mode, corridor, destination type, etc. The MSP scores could have provided insightful feedback on network efficiency and resiliency. While those place-based MSP scores could indicate poor performance to and from a given area, traced path information, in combination with facility-based performance analysis, would be needed to identify specific network problems causing the poor performance. |
|
United States Department of Transportation - Federal Highway Administration |
||