Multimodal System Performance Measures Research and Application: Innovation and Research PlanChapter 2. Definitions and Work ScopeTransportation performance measures continue to evolve as travel demands and transportation systems become more complex and the richness and affordability of data improves. Early measures, still in use today, focus on relationships between travel demand and network conditions on facility segments of a single mode. While transportation agencies are developing and applying multimodal measures, such as multimodal levels of service (mode-specific measures), many of those measures continue to focus on network segments rather than larger systems. The transportation industry has yet to define an integrated multimodal system performance measure, primarily due to a lack of data for such a measure. Developing such a measure will not only require new data, but a conceptual shift from a mode specific, network-based perspective to a multimodal complete trip-based perspective. This chapter details the reasons for and dynamics of the multimodal complete person trip perspective. It then describes the characteristics of an integrated multimodal system measure and the data required for such a measure. It concludes with the specific objectives and a description of the research plan. There are several related multimodal system performance research initiatives underway, including accessibility and connectivity. The former focuses on the number of destinations within a reasonable time frame of a given origin, while the latter focuses on how well differing modes connect with each other to provide seamless travel. This multimodal system performance research is intended to provide a different perspective by homing in on how well the multimodal system performs in concert to serve actual travel on the system. The "ideal" multimodal system performance measure would ultimately provide operators and planners to adjust and improve networks in ways that optimize overall system productivity. Complete Trip PerspectiveThe multimodal transportation system provides a web of travel mode and path options for travelers. The system has become increasingly complex, particularly in urban areas where travel across multiple modes is high. Technology is adding to the complexity by increasing both the number of travel options and the information travelers use to explore among options. Transportation agencies are tasked with continually modifying the system to improve how well it serves travelers based on performance feedback. Current transportation performance measures assess performance on mode specific facility segments, with adjustments and improvements on problematic segments assumed to benefit the larger system. This single mode, facility-based perspective is due primarily to the type of data available: facility-oriented travel data. While system performance monitoring can be improved by increasing the number and duration of travel data recording locations, such data may provide an incomplete, and perhaps an inaccurate, picture of performance. This is because the characteristics of trips on any given network segment differ: some trips are short, others are long; some are bound for work, others bound for a store; some have many viable travel options, others have few; etc. Knowing such characteristics can provide additional context for defining performance problems and potential solutions. Figure 1 illustrates facility-based performance measurements. It depicts two segments located in different areas (contexts). Roadway demand, shown by the orange lines on both figures is five trips per hour, which equals the simplifying fictitious capacity of five trips per hour. Given limited information, it is logical to conclude neither segment performs well and that adding capacity, either through operational or geometric improvements, is the best way to improve performance. 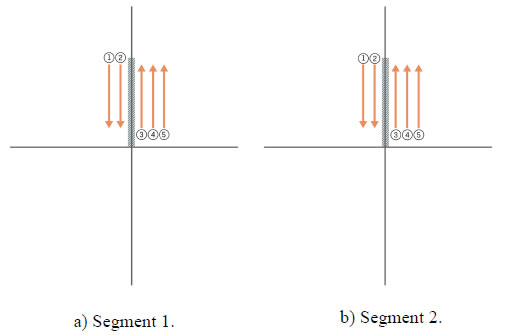 Figure 1. Illustration. Compound graphic depicts two simplified facility-based perspectives. Figure 2 enhances the perspective by adding the complete multimodal network to the picture. Segment 1 on the left has multiple alternative travel mode and path options, with both a transit route (shown by blue dots) and a walking / bike trail (shown by green dots) running parallel to the study segment, while segment 2 has limited options (a transit line, in blue dots, running perpendicular to the study segment. This enhanced perspective reflects the intent of recent context-sensitive, Complete Streets initiatives, and hints at the possibility for strategies other than adding capacity to segment 1 to improve performance. Unfortunately, because the problem continues to be defined by facility-based count data, it is difficult to draw definitive conclusions on how a richer system serves travel demand. 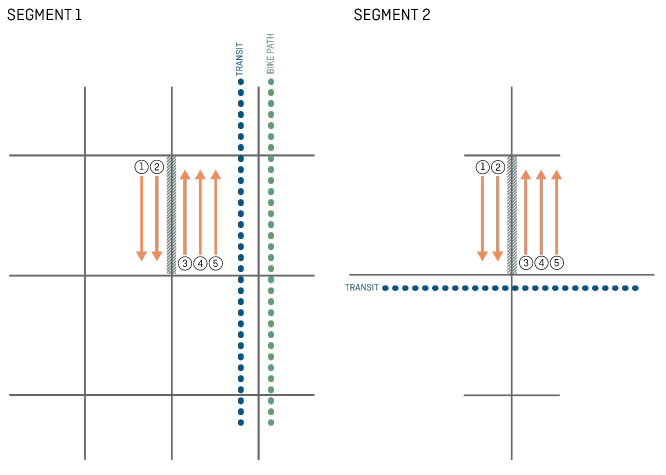 Figure 2. Illustration. Compound figure depicts contextualized facility-based perspectives Figure 3 enhances the perspective even further by adding not only the system information shown in figure 2, but the origins and destinations of all trips on the two example segments. This new "complete trip" perspective more clearly illustrates the travel market for trips and how well the system serves those markets (vehicle trips are shown by orange lines, transit trips are shown by blue lines, bike trips shown by green lines). The origins and destinations of trips on segment 1 match the orientation of the travel modes and paths reasonably well, further supporting the possibility of improvements other than added roadway capacity to segment 1. 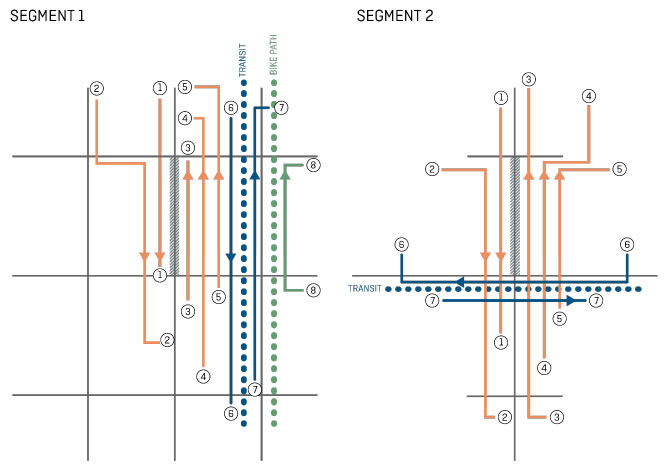 Figure 3. Illustration. Compound figure depicts the complete trip perspective. Performance FeedbackThe research focused on the ability of multimodal system performance measures to provide feedback on system performance from three perspectives:
Measure CharacteristicsComplete Person TripsAs described in the last section, complete person trip information provides an enhanced perspective on performance and it reflects and quantifies the primary goal of travelers, which is to reach desired destinations within a reasonable amount of time and cost. Complete trip data also simplifies how performance is measured by simplifying the definition of the system being measured and the aggregation of data across the multimodal system. Regarding simplifying the definition of the system: because complete trips are indivisible, they provide a well-defined, travel market-based, rationale for selecting the system to measure. Mode-specific facility-based travel data currently in use record only portions of trips and offer no clear-cut rationale for selecting the system. As demonstrated in the figures on the previous pages, it is difficult to discern potential relationships between travel demand and multimodal networks using mode-specific facility-based data. As a result, analysts make educated guesses about such relationships. Regarding the second point about simplifying data aggregation: complete trip data are readily totaled once the system is defined and records are selected. Because single mode facility-based data often count the same trip over multiple segments, data must be proportioned by length of the segments, which then become the basis of measurement. To illustrate this, assume the multimodal network, or system, is defined as four adjacent segments and each segment is a quarter mile long. Peak hour person trip counts over the four segments are 100, 200, 200, and 100 and travel times are 1, 2, 2, and 1 minutes. Adding the counts and dividing by the total travel time (600 trips / 6 minutes = 100 trips per minute) will over-estimate network productivity if some or all the trips are counted multiple times. To account for this, segment counts are multiplied by segment lengths and summed across the network (100*0.2 5 + 200*0.25 + 200*0.25 + 100*0.25 = 150). The total system Person Miles Traveled (PMT) is then divided by the overall travel time (150 PMT / 6 minutes = 25 trips per minute) to estimate performance. The resulting score appears to adjust for over counting, but it is possible that the summed PMT may go too far and under-estimate performance. An extreme example illustrates why this is so. If all trips on each network segment begin and end at the end points of that segment, thus no trips are double counted, network performance would indeed be 600 not 150. Consequently, PMT based performance results are likely to differ from complete trip-based results. They are also likely to vary by the somewhat arbitrary decisions about how segments are defined. Finally, complete person trips, not vehicle trips, are needed for measurement because person trips account for the total number of trips made. In addition, they account for differences in the characteristics of person trips made on each vehicle. Person trips on nearly all transit vehicles and on many automobiles, have differing trip origins, destinations, and travel times. Continuous InformationTravel demand on the transportation network changes constantly during the course of a day. Continuous data, or data summarized into short time slices, provides feedback on those differing conditions. Continuous data are necessary to measure system resiliency, or the ability of the transportation system to provide viable travel options and/or a quick return to typical travel conditions. Information should be summed at hourly intervals (time slices) or preferably less, given the short durations of most incidents. Traceable TripsAs noted above, complete trip data that records the times and locations of trips as they move through the system can match trips with the network, thereby allowing analysts to select complete trip information for any given segment or collection of segments on the network. They also allow analysts to partition complete trip travel times across any of the segments used by the trip. Scalability and PerspectiveMultimodal system measures should have the ability to quantify performance at differing levels of geographic detail, i.e., sub-areas, corridors, and regions, to enable consistent and comparable results among and across regions. When scaling the measure, there is a need to consider that as the geographic focus for measurement zooms in the differences between the spatial extent and orientation of travel demand and networks increase. At a regional scale or greater, the multimodal network extends well beyond the spatial extent of most complete person trips, but as the focus zooms in to a corridor or sub-area, the geographic extent of complete person trips will reach beyond the selected study network. Such differences strain the integrity of the measurement and creates the dilemma of whether to maintain integrity from a network based perspective of shift to a place-based perspective. A complete person trip's basis for measurement, by default, generates a place-based measurement, where the spatial pattern of selected complete trips dynamically defines the study network. This is a far different perspective than the traditional practice of drawing boundaries around a portion of a network, be it a corridor or a sub-area, and measuring performance within the bounds of that network. Because networks ultimately are designed to serve places, such as travel to and from an employment center, measuring performance from a place-based perspective has value and is worth exploring in future multimodal system performance measure research and applications. Supporting DataCurrently available transportation network data is abundant, detailed, and accurate for roads and transit. Bicycle and pedestrian information are of reasonable quality and improving over time. Continuous, real-time roadway travel times from crowd-sourced mobile devices are equally abundant and have evolved to the point where it is increasingly possible to track all trips (or a large enough sample of trips) across all travel modes and travel paths. Unfortunately, those data sources are under the control of private vendors and not readily available to transportation agencies at this time. The richness of data, if made accessible by transportation agencies, will allow for a complete multimodal system performance measure in time. Research FocusThis research is designed to identify a system performance measure and the data needed to support the measure. Given the lack of data and fundamental research into multimodal system performance measures, the research does not delve into potential applications of such a measure, although potential applications provided context for the research process. The research focused on measuring existing and past conditions, not on multimodal modeling and forecasting. Nevertheless, it recognizes important connections between the measure and modeling including:
The research focused on passenger travel and, as such, insights on freight and goods movement are limited to passenger trips made by this important travel market, not on the magnitude of freight and goods moving through the system. Research Work ScopeThe research effort is divided into the following tasks:
|
|
United States Department of Transportation - Federal Highway Administration |
||