Considerations of Current and Emerging Transportation Management Center DataChapter 2. Emerging Data SourcesThe private sector is constantly evolving and innovating—trying to create the next data product or service that will give businesses a competitive advantage. While it is difficult to predict the future, this section includes data that is becoming available now or will likely become available in the next several years. Not every private sector provider wants to reveal its anticipated products or schedules, but table 1 provides a list of newer and emerging data sources that not all agencies have used yet.
1Crowdsourced incident and congestion data is any data willingly and intentionally generated and reported by the public who receives something in return for their contributions. For the purposes of this document, it refers to travelers reporting incidents and congestion in realtime as they come across it using smartphone apps or similar technology. [ Return to Table Note 1 ]
Examples of companies that supply the data in table 1 are included in table 2 along with the sources of their data.
Differences and Similarities in Collection, Processing, and Aggregating DataThe public sector has historically relied on deploying physical infrastructure on public rights of way to collect data to support transportation operations. Traditional intelligent transportation systems (ITS) equipment such as sensors, vehicle counters, and cameras allowed agencies to get a better understanding of system conditions. Agencies were responsible for the procurement and installation of these sensors along with ongoing maintenance. This was both a blessing and a curse. Agencies were accustomed to procuring physical things—things that could be owned, tagged, inventoried, and held. Once installed, the agency was fully responsible for care and maintenance, including routine calibration, physical repair, power, communications, etc. If maintained and calibrated, these sensors and devices could provide relatively high-quality data, but only in areas where they were deployed. The private sector, with rare exception,1 has been limited in its ability to deploy its own equipment on the public right-of-way. Seeing opportunities in the Internet of Things and wireless technologies, the private sector instead focused on these emerging technologies and the opportunities they presented to potentially add value to agency operations. As wireless and mobile technology continued to develop and smartphone penetration skyrocketed, the private sector was able to develop new ways of obtaining data of a quality similar to that of public agencies, but on a larger scale, covering most of the roads in the Nation, and doing so without deploying much (if any) infrastructure. Table 3 summarizes the operations-related uses for each data type and how public sector agencies could obtain the data or an approximation of that data without purchasing it directly from a third party.
2Crowdsourced incident and congestion data is any data willingly and intentionally generated and reported by the public who receives something in return for their contributions. For the purposes of this document, it refers to travelers reporting incidents and congestion in realtime as they come across it using smartphone apps or similar technology. [ Return to Table Note 2 ]
Processing and Analytics DifferencesPublic agencies have kept pace with the latest relational database storage and analytics capabilities necessary for the effective usage of existing agency data—like volume and speed sensors, advanced traffic management system (ATMS) event records, etc. For example, a large State agency might deploy 15,000+ traffic flow sensors on their highways that record volume and speed data every 20 seconds. Most agencies can easily handle this level of data storage. Even though this seems like a significant amount of data, it comes nowhere close to the quantity of data produced by the tracking of Global Positioning System (GPS)-equipped cellular phones, light detection and ranging (LiDAR), or other CVs applications. As the public sector continued to invest in relational database technologies to store its sensor and ATMS data, the private sector had to fast track its own, newer storage and analytics capabilities to keep up with development and demands of the wireless and mobile markets, which were creating massive streaming datasets that would not fit into existing relational database management systems. This meant the private sector needed to develop big data analysis and storage capabilities well beyond those of most public sector agencies. Now that public agencies are tapping into these big-data streams, some are finding that their own relational databases are ill-equipped to process, host, and leverage the data to its fullest potential. Agencies are faced with several choices: 1) adopt or develop the same big data capabilities as the private sector and invest in hardware storage or cloud services, 2) outsource the hosting of these datasets to the private sector or other third parties, or 3) not attempt to ingest raw data, but instead leverage application programming interfaces (APIs) or data summary and insights services from the data providers without the need to download and manage large datasets. The remainder of this chapter will describe these datasets in more detail—giving an overview of potential applications, data providers, pros and cons, etc. Later chapters will discuss business models, the value of agency data, and contracting guidance. Crowdsourced Incident and Congestion DataDescriptionCrowdsourced incident and congestion data is any such data willingly and intentionally generated and reported by members of the public who get something in return for their contributions. Crowdsourced transportation data does not include probe-based data. Instead, crowdsourced data refers to travelers reporting incidents and congestion in realtime as they come across it using smartphone apps or similar technology. Applications of Crowdsourced Incident and Congestion DataMany applications can use crowdsourced incident and congestion data in the same way as agency incident and congestion data. For example, crowdsourced data can help manage traffic in realtime by providing TMCs with awareness of new incidents and congested spots. TMCs can dispatch field units to incident scenes more quickly, or implement congestion mitigation strategies in response to congestion reports. In addition, crowdsourced data applies to realtime operations and can also be archived and used in planning and performance management efforts. Table 4 shows a few agencies that are making use of crowdsourced data and applications today.
General Attributes
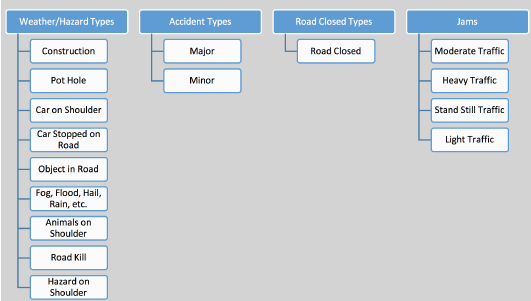 Figure 2. Diagram. Examples of Waze event types and subtypes. Source: University of Maryland Center for Advanced Transportation Technology Laboratory. Data AvailabilityThere are multiple platforms that TMCs can leverage to glean data from the crowd. Some platforms are focused on transportation while others are primarily social networks. Some agencies mine data from social networks by evaluating contents of posted messages and finding key indicators of traffic-related information. For example, some agencies used machine learning algorithms to recognize typical message constructs that may identify an incident. These algorithms can assign a level of confidence to the results by comparing the location information, time, and other attributes across other social networks and agency systems. Other agencies simply monitor social media messages from trusted partners or users (like the media, public safety departments, etc.). Many States and municipalities are starting to encourage their citizens to use apps that allow citizens (the crowd) to take pictures of maintenance issues (like potholes, damaged lights, signal issues, curb/sidewalk issues, etc.) and send them to the agency (along with geo-located photos, attributes, etc.). A database can manage the citizen reports, which is turning into a "ticketing system" for many smaller agencies. Pros and ConsAs shown in figure 3, crowdsourced data tends to provide broader coverage than individual agencies may be able to afford with limited resources and jurisdictional responsibilities. Crowdsourced data may be generated anywhere people travel, encounter issues, and have internet access. This means users can report on interstates, State and county roads, local roads, neighborhoods, etc. 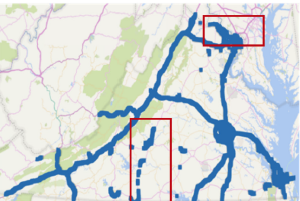 a) Waze events.  b) Virginia Department of Transportation events. © 2018 I-95 Corridor Coalition Figure 3. Screenshots. Red boxes highlight the coverage differences in the Waze data versus the Virginia Department of Transportation data Source: I-95 Corridor Coalition. n.d. Closing the Realtime Data Gaps Using Crowd-Sourced Waze Event Data. Unpublished technical report. Crowdsourced data can be timelier than agency-generated data due to the higher probability of travelers coming across an incident or encountering congestion than an agency detecting it via its sensors, cameras, and field patrols. A recent I-95 Corridor Coalition (ICC) study compared the amount of time it takes for events to appear in the Waze data feed compared to the amount of time it takes the agency to identify the incident and put it into their ATMS or 511 platform.2 Agencies usually detect major collisions on interstates sooner than Waze. However, Waze identifies smaller events, debris, and disabled vehicles before the ATMS—sometimes by 15 minutes or more. These smaller events do have the potential to become larger or cause secondary incidents if not dealt with in a timely manner. Table 5 shows the results of the ICC study, indicating the average length of time Waze reported an event before the DOT ATMS reported it when both reported the same event (includes events in California, Florida, and Virginia).
Source: I-95 Corridor Coalition. n.d. Closing the Realtime Data Gaps Using Crowd-Sourced Waze Event Data. Unpublished technical report.
ATMS = advanced transportation management system. DOT = department of transportation. As a general observation, official entities do not verify crowdsourced data because any user can report anything. Crowdsourced data providers usually have built-in mechanisms for a "selfmoderating" community, where other travelers can confirm or reject reports, therefore providing some level of confidence that the reported incident or congestion is real. As previously noted, Waze data feeds provide confidence and reliability scores. Confidence scores range from 0 to 10 and measure how other drivers react to the report (a higher score indicates positive feedback from other Waze users). Reliability scores measure the experience level of the person reporting the event. The more a user contributes and the more they receive positive feedback from other Waze users, the higher their score. Many agencies use a combination of the confidence and reliability scores to determine whether it is worth acting on a particular event. Figure 4 shows how these scores are displayed and filtered in one traffic management system. 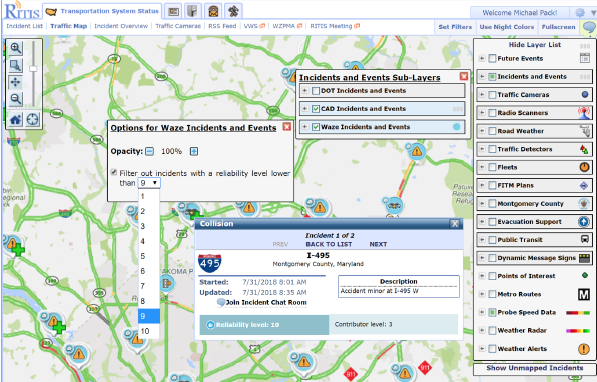 © 2019 University of Maryland Center for Advanced Transportation Technology Laboratory Figure 4. Screenshot. Many agencies filter out Waze data that have a lower reliability level. Source: University of Maryland Center for Advanced Transportation Technology Laboratory. Use Cases for Crowdsourced Incident and Congestion DataUse Case: Regional Integrated Transportation Information System (RITIS) Waze data integration. RITIS ingests realtime Waze data for the entire country. State DOTs and other public agencies use RITIS to fuse data from multiple providers into a single, common operational picture, or as a data aggregator of third-party data feeds like Waze. Formatting Waze and other third-party data into standardized data feeds enables incorporation of data back into a realtime ATMS platform. Figure 5 shows the RITIS map with Waze data overlaid. Users are able to filter the display of Waze events based on the reliability score. Several agencies then access the RITIS data application programming interface and re-ingest the Waze data (along with other third-party incident data feeds) in a single stream. 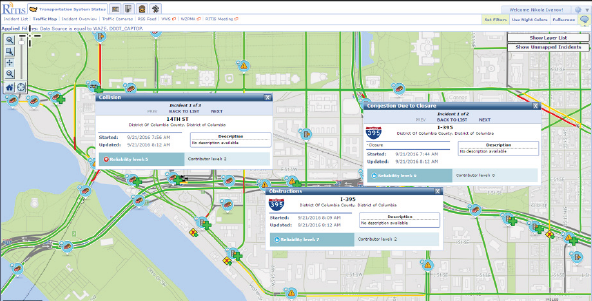 © 2019 University of Maryland Center for Advanced Transportation Technology Laboratory Figure 5. Screenshot. Realtime Waze data integrated into the Regional Integrated Transportation Information System platform. Source: University of Maryland Center for Advanced Transportation Technology Laboratory. 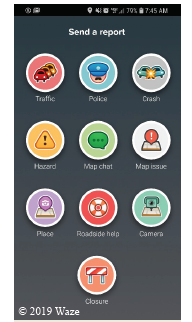 Source: Waze.
Figure 6. Screenshot. Waze smartphone app. The RITIS platform also archives Waze data at the national level. Operators can use the RITIS archived Waze data analytics module to understand where to stage field responders or plan service routes by analyzing the location of incident hot-spots by time-of-day and day-of-week. Google-owned Waze provides a smartphone app that allows drivers to report incidents, congestion, and other traffic-related events (figure 6). Over the last several years, Waze has partnered with a number of public agencies (cities, States, and regions) across the world to provide crowdsourced data in exchange for agency-generated planned event information. Waze calls this its Connected Citizens Program (CCP). Waze provides three primary types of notification data: alerts, jams, and irregularities. Waze provides CCP partners with extensible markup language (XML)/JavaScript Object Notation (JSON) files. Data providers and users must overcome challenges with both data size and quality to transform raw Waze data to reliable information that can help DOTs make data-driven decisions. Data Size: Waze generates a substantial number of new notifications on a daily basis. The Center for Advanced Transportation Technology (CATT) Laboratory at the University of Maryland has been ingesting data from Waze for several years in its RITIS realtime data fusion platform. On an average day, CATT Lab's RITIS platform receives approximately 27,000 Waze events across 12 States (approximately 54,000 events if including jams). This is significantly more than the number of ingested, stored, and visualized events across all States,3 as shown in table 6. For example, Waze could result in a 400-fold increase in the number of events in Massachusetts. As such, ingesting only the desired Waze events by applying filtering will be essential to increasing the usability of the data. As shown in figure 7, the average number of Waze events is highly correlated to the vehicle miles traveled (VMT) in each State.
Source: University of Maryland Center for Advanced Transportation Technology Laboratory.
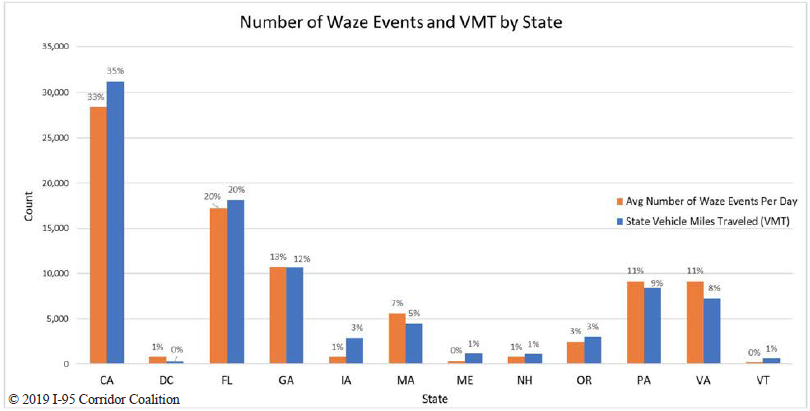 Figure 7. Chart. Waze events and vehicle miles traveled by State (excluding jams). Source: I-95 Corridor Coalition. n.d. Closing the Realtime Data Gaps Using Crowd-Sourced Waze Event Data. Unpublished technical report. Data Quality: Waze's data quality can be susceptible to redundancy, completeness, and unreliable information such as the generation of false-positive events.
Example Waze Incident Data: Waze supports the types and subtypes of user-generated alerts shown in Table 7:
Source: Waze, Google Developers Web page. Available at: https://developers.google.com/waze/data-feed/overview, last accessed March 17, 2019.
Waze data is in either XML or JSON format. An example of a weather hazard notification is below in the XML format with a description of each element as shown in table 8. <item>
</item> <item>
</item>
Here is the same example in JSON format: {"country":"IT", "roadType":1, "magvar":258, "subtype":"", "reportRating":0, "reliability":6, "reportDescription":"blocco del traffico per alcuni veicoli nella ZTL (Zona Traffico Limitato) Non possono circolare Veicoli per iltrasporto persone Dal lunedì al venerdì, dalle ore 8 alle ore 19 veicoli benzina Euro", "location":{ "x":7.6800935614336545, "y":44.9991565694201 }, "type":"WEATHERHAZARD", "uuid":"39d9dc07bd743b35ba6b833f5cbd1ce1", "pubMillis":1448546704610}, {"country":"IT", "magvar":0, "subtype":"ROAD_CLOSED_EVENT", "city":"Nichelino", "street":"Via Fenestrelle", "reportRating":0, "reliability":9, "reportDescription":"lavori", "location":{"x":7.627331910061528,"y":45.00419885851123}, "type":"ROAD_CLOSED", "uuid":"1064e72c0d3b332d95c61dcab524aa5c", "pubMillis":1446918728242}, Example Waze Speed/Congestion Data: Waze generates traffic jam information by processing the following data sources:
Table 9 describes traffic jam parameters, which are also in XML.
An example of a traffic jam notification is below in the XML format. <item>
</item> Use Case: Metropolitan Area Transportation Operations Coordination (MATOC) TweetDeck. Figure 8 is from the MATOC program in the National Capital Region. The MATOC operations center actively monitors Twitter feeds through a software application called TweetDeck (https://tweetdeck.twitter.com/). Through this application, the MATOC operations personnel are able to get information from other agencies, the media, and even the public who may prefer tweeting rather than using Waze. Monitoring these feeds requires additional diligence and practice (figure 9). Operators must configure their TweetDeck to report out on users, hashtags, and other information deemed relevant to the operator. It took several months of effort to refine their settings before the feeds were providing the level of information they desired. They must also tweak their settings every few months to ensure everything continues to run smoothly. Despite the initial effort involved, the operators like the system so much that they dedicated an entire media wall to the feeds so that it is always visible. 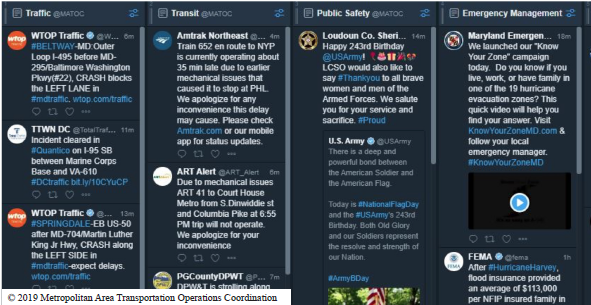 Figure 8. Screenshot. A small portion of the Metropolitan Area Transportation Operations Coordination Twitter monitoring system. Source: TweetDeck screenshot provided courtesy of the Metropolitan Area Transportation Operations Coordination Program. 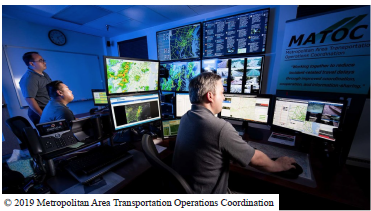 Figure 9. Photo. The Metropolitan Area Transportation Operations Coordination operations room with TweetDeck prominently displayed on the upper-right media wall panel. Source: Metropolitan Area Transportation Operations Coordination. The following provide direct access to Twitter feeds:
The Twitter API and examples of data from tweets are available at hhttps://developer.twitter.com/en/docs/basics/getting-started. Many agencies, however, will not directly integrate Twitter feeds into their ATMS platform, but will use third-party viewers of data for situational awareness. Figure 10 shows an example of a traffic alert from the Denver Police Department.  Figure 10. Screenshot. The Denver Police Department uses the #Traffic hashtag to alert the public (and other agencies) about traffic events. Source: Twitter/Denver Police. Use Case: Pushing Data back to Crowdsourced Users. Crowdsourced data can go two ways. Several agencies are now using Waze's CCP to provide agency data back to Waze users. This can come in the form of providing the location, times, etc. of road construction projects, special events, or collisions (figure 11). However, the Port Authority of New York and New Jersey (PANYNJ) is also using Waze to influence routing and driver behavior. 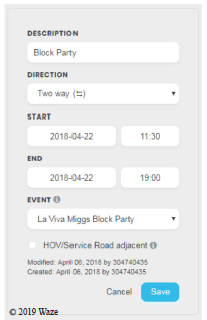 Figure 11. Screenshot. Example of a crowdsourcing event. Source: Waze. PANYNJ leverages Waze's website for agency partners to create realtime road closures when they need traffic to divert away from specific roads leading up to a terminal. When traffic congestion increases on a particular route, PANYNJ tells Waze about the road closure, which then prohibits Waze user's navigation systems from directing them onto that roadway. A realtime closure can indicate temporary closure of a segment in one or both directions to all Waze users. When the realtime closure is active, the affected segment will be marked with red-and-white stripes, and Waze will not route any traffic through or onto the segment. Waze instructs users to report a realtime closure only when a road closure is complete in one or both directions.4 There are several possible ways to prevent Waze from routing traffic over a segment. Table 10, excerpted from Waze's technical support documentation, explains the options. During a realtime closure, Waze will not route to a destination on the closed segments, nor partway through the closed segment, even if that is the closest segment to the destination. Instead, it will pick a stop point on the next closest segment. If the closed segment is much longer than the part of the road actually closed to all traffic, this can result in directing users to a nearby street even though they should be able to drive to the destination. For this reason, if a closure is very localized and going to persist for more than 1 week (e.g., a bridge replacement), it might be worth the effort to edit the closed segment.5 If the user is on a closed segment, Waze will find a route that begins in the closed segment and find the shortest distance to a segment with no closure.
Source: Wazeopedia, "Realtime closures." Available at https://wazeopedia.waze.com/wiki/USA/Real_time_closures, last accessed March 17, 2019.
Use Case: Utah DOT Crowdsources Maintenance. The Utah DOT (UDOT) worked with SeeClickFix to customize a solution for citizen reporting of roadway maintenance issues. SeeClickFix is an application that allows citizens to take pictures of maintenance issues and send them to the agency (along with geo-located photos, attributes, etc.). In addition to collecting citizen requests, the solution acts as a service-request management system that has helped to improve agency efficiencies and transparency. The Utah Click'n Fix website (figure 12) even prints out service reports to show how the agency is managing requests over time. When more than one citizen service request comes in for a single issue, consolidating and handling the requests as one saves time on maintenance issues. This consolidated work means that employees no longer have to write 50 emails or make 50 phone calls in response to 50 separate citizen service requests. Utah citizens can report issues through UDOT's smartphone app, which empowers citizens and the DOT to resolve maintenance and safety issues more quickly (figure 13). 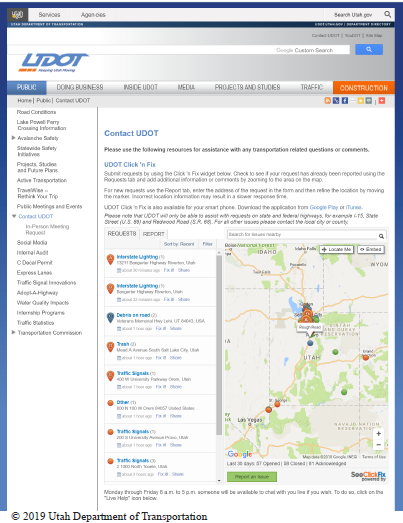 Figure 12. Screenshot. Utah Department of Transportation's Click'n Fix widget accompanies the Click'n Fix application. Source: Utah DOT, Contact Website. Available at: https://www.udot.utah.gov/main/f?p=100:pg:0::::T,V:376.  Figure 13. Illustration. Utah Department of Transportation's smartphone app empowers citizens and the agency to resolve maintenance and safety issues more quickly. Source: Utah Department of Transportation, SeeClickFix Website. Available at: https://seeclickfix.com/pages/case-studies/utah-dot.html. Roadside Basic Safety Message DataDescriptionCVs and infrastructure can use special communications protocols, such as dedicated short-range communications (DSRC), 5G (the fifth generation of wireless technology), and others, to exchange basic safety messages (BSM) and infrastructure messages (figure 14). These communications protocols allow vehicles and infrastructure to exchange messages within 1,000 meters approximately 10 times per second primarily to support safety applications, and secondarily to support mobility applications. Under BSM Part 1, vehicles communicate their size, position, speed, heading, acceleration, and brake system status to each other and to the infrastructure.6 BSM Part 2 includes additional data elements, such as weather data and vehicle status data. Similarly, connected infrastructure can transmit its status to vehicles or perform action in response to received BSM data. Although poorly defined, infrastructure message format does include some potential message types that represent digital descriptions of the roadway (e.g., signal phase and timing (SPaT) messages or MAP type messages). In addition to these, infrastructure messages could include information regarding speed limits, especially as they change in work zones and school zones; dynamic message sign information; and other advisories. 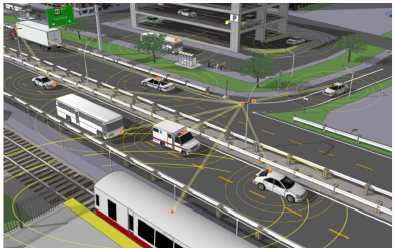 Figure 14. Illustration. U.S. Department of Transportation connected vehicle and connected infrastructure concept. Source: U.S. Department of Transportation, Intelligent Transportation Systems Joint Program Office. Available at: https://www.its.dot.gov/itspac/october2012/PDF/data_availability.pdf. ApplicationsBSM data has many potential uses, including:7
AttributesBSM is broadcast approximately 10 times per second, which is sufficient for most basic safety applications. However, many roadside unit (RSU) providers also have other data transmission capabilities that can have latency as low as 20 ms and as high as several seconds depending on the application.Details
Data AvailabilityCurrent data coverage is limited to pilot sites and test sites, at least in terms of data that is available to TMCs. As connected vehicles and infrastructure deployments proliferate, the coverage will most likely increase as well. Many vehicle manufacturers and original equipment manufacturers (OEMs) are building out CV functionality. However, it is not clear what data may be available for agencies to consume beyond existing pilot deployments and test sites. OEMs are building their own cloud services or partnering with other third parties that are based on the concept of bundling connected data and selling it to interested parties, including the public sector. For example, at least one company acts as a neutral third party that provides the service of collecting and transmitting CVs data to interested parties using APIs. At this time, the United States Department of Transportation (USDOT) has provided access to a number of CV and infrastructure data sets from pilot implementations and test sites through its public data portal (table 11).
Source: United States Department of Transportation, Intelligent Transportation Systems Joint Program Office. Available at: https://www.its.dot.gov/data/search.html.
On the infrastructure side, a number of CV communication and network companies provide connected infrastructure functionality; e.g., traffic signals, critical hazard alerts, and roadway weather conditions. Third-party companies have developed applications that utilize infrastructure data to support safety and mobility applications. Pros and ConsCV and infrastructure data allows drivers to be safer through better information regarding vehicle surroundings and environment. It also allows agencies to disseminate important and tailored information directly to drivers and vehicles in a much more integrated fashion than was traditionally possible using dynamic message signs (DMS) or highway advisory radio (HAR). CV and infrastructure data can be very large and rapid, which provides a challenge for agencies to process it in realtime and use it to guide decisions or manage congestion. It is unclear what level of aggregation (if any) is necessary for data to be useful in each application. The current level of market penetration for CVs and connected infrastructure is low, therefore, it has minimal use for TMCs focused on realtime operations at this time. However, deployment of this technology will continue across the country with more data becoming available every day. Use Cases for Roadside Basic Safety Message DataUse Case: Wyoming Connected Vehicle Pilot. As part of the Wyoming CV Pilot, the University Corporation for Atmospheric Research (UCAR) has implemented a Pikalert system (figure 15) that combines vehicle-based measurements with traditional weather observations to provide alerts to CVs traversing the corridor. Pikalert consists of several components:
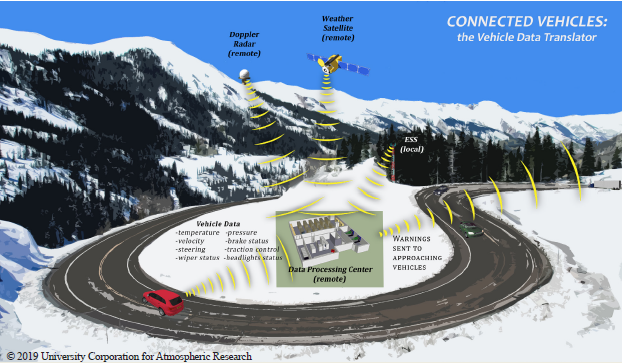 Figure 15. Illustration. The Pikalert concept. Source: University Corporation for Atmospheric Research, Research Applications Laboratory, "Promoting Vehicle Safety, Mobility, and Environmental Efficiency" Web page. https://ral.ucar.edu/solutions/promoting-vehicle-safety-mobility-and-environmental-efficiency. Vehicle Data Translator The Vehicle Data Translator consists of three stages:
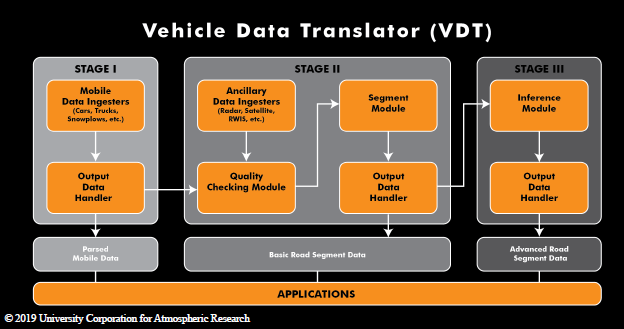 RWIS = road weather information system Figure 16. Diagram. Vehicle Data Translator Architecture. Source: University Corporation for Atmospheric Research, Research Applications Laboratory. Enhanced Maintenance and Decision Support System. EMDSS incorporates CV data into a forecast and decision process. Traditional sensors and equipment-generated data is enhanced and supplemented by CV data that provides more robust coverage and more detailed information about conditions on the entire corridor. This combined information supports maintenance operations and provides the opportunity for a proactive approach in handling adverse weather conditions. This proactivity improves safety and provides an opportunity for more effective use of limited resources by targeting the most critical problem spots before issues arise. Motorist Advisory and Warning Application. MAW capitalizes on the rich output of vehicle data translators to provide travelers with hyperlocal and near-realtime road weather information, as well as accurate 24-hour forecasts of road weather conditions. Realtime and Archived Trajectory DataDescriptionTrajectory data is time-stamped location data from vehicles, cell-phones, or other GPS-enabled devices moving throughout a network. This is sometimes referred to as "bread-crumb trail" data. Figure 17 illustrates an example of trajectory data where each red dot represents a ping from the vehicle as it moves from point 0 to point 14.  Figure 17. Map. Example trajectory data for a single trip. Source: Google. The system can make data anonymous in different ways. For example:
Because of the privacy protocols, probe vehicle data providers add 1 to 2 days of latency prior to delivery to agencies. However, technology and capabilities are improving each day with anticipation of this data set being available in near-realtime in the next year or two. The data has many application areas for both planning and operations. Applications of Realtime Trajectory DataTrajectory data is a new dataset with a great deal of potential for operations management. Realtime uses of trajectory data include:
In addition to realtime uses, trajectory data is also valuable in operations planning. For example, planners can use trajectory data as follows:
AttributesFor each individual trip, trajectory data usually includes:
Identification of each origin, destination, and waypoint uses latitude/longitude pairs and timestamps. Some providers "snap" these latitude and longitude points to a particular road segment. Collection of waypoints at varying intervals depends on the probe vehicle type and location and can occur from once per second up to once every 5 minutes. Data AvailabilityTrajectory data is relatively new to the market, and only a few companies are providing access to this information. At least one company provides analytics services on top of other third-party data providers and location-based service providers; however, those services may not provide direct access either to individual trips or to the raw trajectory data. Ride-hailing companies are also starting to make limited O-D datasets available to select researchers in limited metropolitan areas. These data sometimes have heavy restrictions on use, limit the O-D analysis to larger geographic zones, and do not provide route choice analysis. As the demand for this data rises and technology improves, other companies with access to "probe-like" data will probably offer similar data sets. Pros and ConsA huge benefit of the trajectory version of O-D data is the ability to construct an entire trip based on origin, destination, and the route taken during the trip. No other data set on the market has the potential to provide such rich information about route and mode choice. Trip data from third parties is more cost effective than travel diaries or roadblock studies. However, there is a 1 to 2 day lag between when the data is collected and when it is available to an agency. This makes the data particularly useful for after-action reviews (AARs) and otherwise understanding the greater impacts of operations decision on the traveler. In the near future, this information will be available in realtime or near realtime, thus making it more applicable to realtime signal control, ramp metering, dynamic routing, and more. One of the challenges is the size of the data set. For example, data for the relatively small State of Maryland for one year of data includes nearly 100 million individual trip records, and over 7 billion waypoints. Analysis of data of this size requires dedicated information technology (IT) infrastructure and expertise—either in-house or provided by a third party. 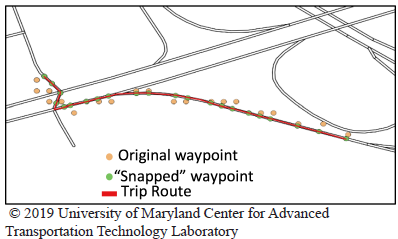 Figure 18. Illustration. Snapping waypoints to routes can sometimes be a challenge. Source: University of Maryland Center for Advanced Transportation Technology Laboratory. Latitude/longitude pairs identify most waypoints, and only a select few providers pre-map the waypoints to TMC-segments or OpenStreetMap (OSM) segments. This means that data users may need to be able to conflate those locations to an underlying map to be able to map the trips to specific roadways and corridors (figure 18). Because latitude/longitude pairs may not be exactly accurate due to GPS errors and noise, in dense urban areas or dense roadway networks, subsequent waypoints may appear to jump from one road to another and back as the probe vehicle traverses the network. Collecting waypoints at longer time intervals makes it more difficult to determine the exact route taken between one ping and another. This presents a challenge when attempting to construct a trip using those waypoints. A benefit of machine learning algorithms is that they allow users to snap the waypoints to the network with a high degree of accuracy. However, implementing machine learning algorithms requires understanding data science, geographical information systems (GIS), and how machine learning works. Use Cases for Realtime and Archived Trajectory DataUse Case: Impact of New Tolling on Travelers and Mode Choice. The Virginia Department of Transportation (VDOT) recently implemented high occupancy tolling on I-66 leading into the District of Columbia. These variable tolls can range from $4 to $47 per trip. Realtime and historic trajectory data can show the impacts of these tolls on route choice. VDOT is using trajectory data to understand which routes motorists took to get into the District prior to the tolling going into effect. They are then evaluating how motorists' routes changed after implementing the tolling. A future application could be to evaluate—in realtime—how changing the rates throughout the day is affecting trips, which arterials are taking the brunt of the extra traffic, and the exact routes that commuters are taking to avoid the tolls. Use Case: Impact of Construction on Travelers. Several DOTs and metropolitan planning organizations (MPOs) leverage O-D (trip) data with trajectories and routing details for realtime operations. Transportation systems management and operations (TSMO) groups can use this data to understand the impacts of work zone management practices, develop different traveler information and communication strategies, establish more effective signal timing plans, and support freight operations. These same agencies can use the trajectory data to support before-and-after studies to show how the finished construction projects have changed route choice. Use Case: Maryland DOT Mid-block Signal Timing Analysis. Trajectory data has the power to support signalized arterial applications. Collection of waypoints throughout a trip enables collection of true travel times within cities among a very large number of routes. Whereas standard probe data provides average trip speeds from intersection to intersection, trajectory data can provide mid-block to mid-block travel times, allowing agencies to quickly understand turning movement travel times and overall signal performance (figure 19). 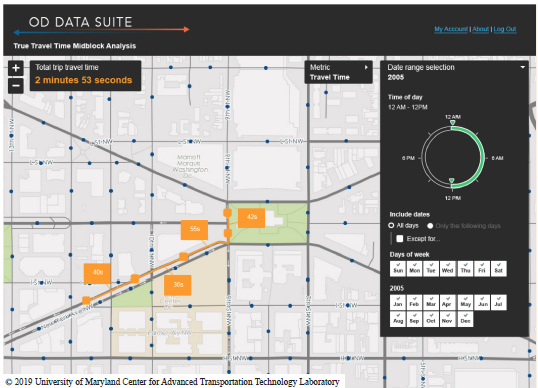 Figure 19. Illustration. The Center for Advanced Transportation Technology Laboratory's Origin-Destination Data Suite uses trajectory data to conduct midblock analyses. Source: University of Maryland Center for Advanced Transportation Technology Laboratory. The Maryland DOT is funding the development of a mid-block travel-time analysis suite using INRIX trajectory/trips data. This tool will provide a ranked list of all turning movements in a city, allowing signal operators to understand the user delay cost associated with all turning movements in a city (figure 20). The graph in the lower right shows how many trips made it through this particular intersection (left turn) within the first cycle, second cycle, and third cycle. 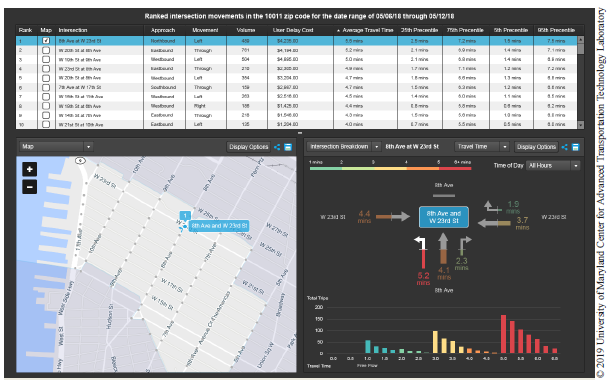 Figure 20. Screenshot. The Center for Advanced Transportation Technology Laboratory's Origin-Destination Data Suite provides ranked intersection movements by zip code and date range based on trajectory data. Source: University of Maryland Center for Advanced Transportation Technology Laboratory. INRIX trip data comes in several formats with multiple output files that include metadata (table header definitions, source data, device types, waypoint details for each trip, origins, destinations, etc.). While the entirety of the files is too expansive to include in this document, figure 21 is an example output from one of these many files describing trips and the waypoints along a particular trip. This cropped file shows only eight waypoints of a much longer trip. The expanded file shows thousands of additional trips and waypoints. 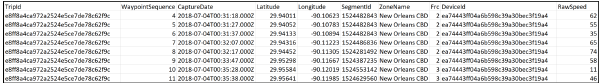 Figure 21. Screenshot. Example data feeds. Source: INRIX. INRIX trip data shows actual trajectories and waypoints for individual trips, which allows an agency to conduct true route analysis, travel-time analysis, and more for individual trips. The data is quite voluminous because it contains individual trip data, and third parties have developed a number of tools to help agencies better utilize the data. Use Case: Maryland DOT Identifying Travelers Impacted by a Project. Leveraging trajectory data enables agencies to perform outreach and education prior to major construction projects, detours, etc. Figure 22 shows how the Maryland DOT-funded O-D Analytics suite shows where trips that passed over a very specific road segment originated. The same tool also shows the destination of those same trips. 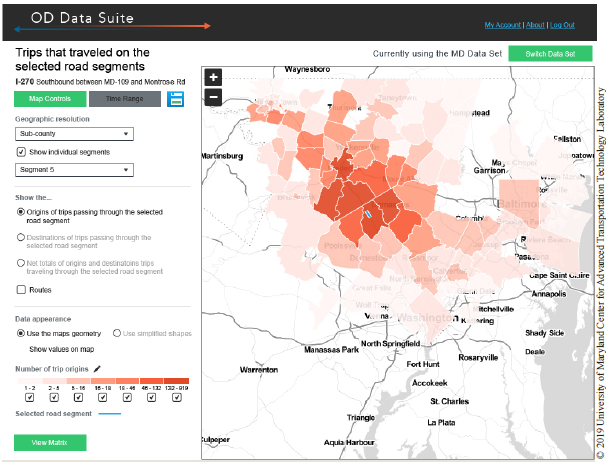 Figure 22. Screenshot. The Origin-Destination Analytics Suite illustrates the origins for trips that passed over a very specific road segment. Source: University of Maryland Center for Advanced Transportation Technology Laboratory. Crowdsourced Map DataDescriptionTraditionally, public and private sector entities generated map data for specific uses. In transportation, most agencies purchase map data from one of the major map data providers. However, over the last several years, crowdsourced maps have become more prevalent and more viable for use in transportation operations. Public apps and websites create and update crowdsourced maps in near realtime or on a small delay if the contributor community needs to verify the changes. Most of the time, these maps are freely available (figure 23). Private sector map providers still use crowdsourcing to improve their maps, but the map data is still proprietary. 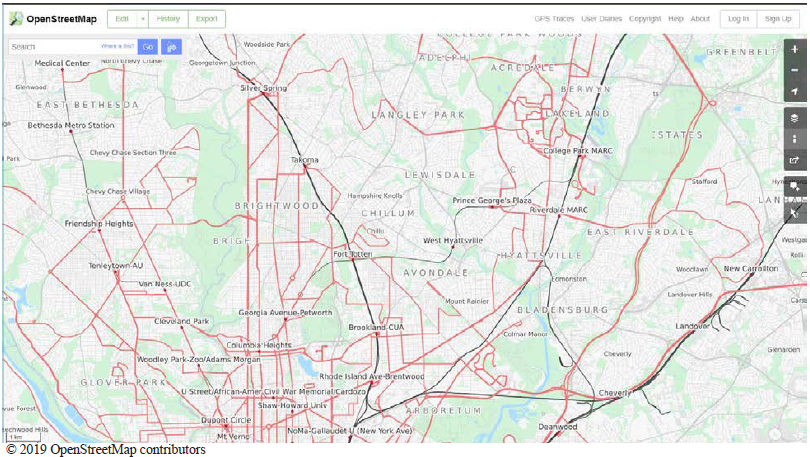 Figure 23. Screenshot. Example OpenStreetMap. Source: OpenStreetMap. Applications of Crowdsourced Map DataCrowdsourced map data allows agencies to have access to more accurate and more frequently updated map data than available with traditional maps. It does not necessarily change the way TMCs use maps. Instead, many TMCs use crowdsourced map data in their ATMS or for their traveler information systems. AttributesCrowdsourced map data usually consists of the same or similar data elements as any traditional map, including roadway networks, landmarks, businesses, parks, etc. In general, crowdsourced map data is not a different data product, but rather a differently created data product.
Data AvailabilityThere are several crowdsourced map data providers including free, open-source options such as OSM and other private-sector providers. Many of these providers use large user communities that contribute map information, including GPS traces, link creation and identification, landmark and asset information, etc. Others may use technology deployed in vehicles to analyze surroundings and update map information such as speed limit information, restrictions, roadway changes, etc. While each crowdsourced map data provider offers similar data elements, they collect data in different ways. A large community of global map contributors edits the OSM data. They collect and add map data elements and layers and publish them under the open source license. This approach enables data to be updated frequently and accessible to anyone interested in using the map. Map users are free to enhance the OSM map by adding information to it, with a caveat that users need an open source license to publish added data. While, conceptually, the OSM model appears to be ideal for rich and accurate mapping, the open source caveat often results in users not being willing to contribute their additions to the open source community, since their data is either proprietary, valuable to the contributor, or private in nature. OSM data is truly free to use. It can be downloaded fully by any agency with few restrictions. While many agencies also think of other maps as being free, one may not actually download the raw basemap data from many common map providers. OSM also includes user-generated map data that goes beyond roads. For example, contributors may have mapped out the locations of nearby items of interest, such as trees, fire hydrants, public restrooms, potholes, etc. OSM data have some limitations, which may or may not affect traffic operations. Because the OSM system depends on volunteers to produce and edit maps, data quality and consistency can vary from location to location around the world. Metadata can sometimes be lacking, which makes it difficult to know if certain layers are current. The data is also not completely authoritative. While the road network was derived from U.S. Census data, making it fairly trustworthy, other layers (e.g., points of interest, location of trees, etc.) may be less authoritative. Because of the OSM limitations listed above, a number of third-party map distributors have entered the market to address these limitations. These distributors enhance raw OSM maps and provide additional data elements, layers, and hosted services at a cost. Most crowdsourced map data providers offer several different ways to obtain and use this data. TMCs are able to purchase raw map data, such as shapefiles and associated attributes, and integrate that data into their native ATMS. Alternatively, TMCs can procure hosted services in forms of tiling services or other map services. These hosted services allow TMCs to embed links to an external map service or to build maps in realtime by querying tiling services hosted elsewhere. OSM data (figure 24) are available as a topological data structure consisting of four primary elements: nodes, ways, relations, and tags. This data is stored in a primary database that hosts all edits and is the primary source of all OSM data output formats. In addition to raw data, users are able to obtain individual GPS traces submitted by contributors. Note that figure 24 illustrates the data that is used to create the information on the mapping or image tiles. The map is not just pictures that can readily be integrated into a GIS platform. 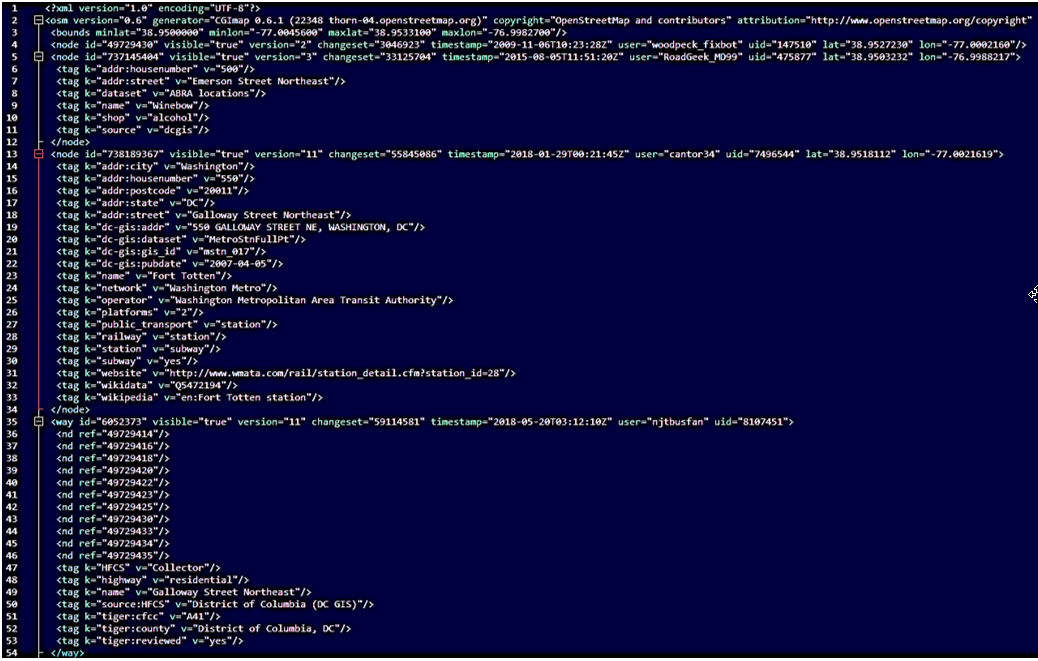 © OpenStreetMap contributors. Figure 24. Screenshot. Example of OpenStreetMap data in extensible markup language format. Source: OpenStreetMap. Data is available under the Open Database License. Pros and ConsThe greatest benefit of crowdsourced map data is in its update frequency. Crowdsourced maps do not have to rely on expensive and infrequent satellite sweeps or physical path traversing. Instead, map users can contribute changes and additions to existing maps to keep them updated in near realtime. 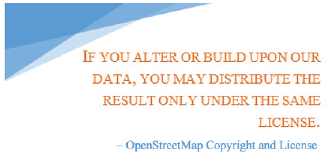 Figure 25. Screenshot. License rules for OpenStreetMap. Source: OpenStreetMap. As with other crowdsourced data, there is some level of unreliability due to the possibility of users intentionally or unintentionally providing erroneous data. However, these map user communities are usually quick to "self-heal" through change moderation or independent verification by other users. One provider often prompts its users to answer several questions about locations, businesses, and landmarks (e.g., "is there a wheelchair accessible ramp?") to validate and enhance existing data. In cases of crowdsourced map data that also requires an open data license, the license may force agencies to share any derived data in the public domain. This might violate other licenses and agreements, and the data might not be wanted. For example, the OSM license requires users who derive data from OSM to publish that data back under Open Data Commons Open Database License (figure 25). This may be undesired if derived data is of sensitive or proprietary nature. The above licensing rule should not restrict agencies from using OSM data. Agencies can still create derivative products, such as additional map layers, without having to share those back. It is only when an agency directly edits the OSM files/database that those data need to be re-shared with the community. This subtle difference in understanding the licensing terms allows third parties to leverage OSM data to create their own derivative products and services that they then sell back to agencies and other companies. For some specific applications in transportation, crowdsourced map data may be not be sufficiently accurate by itself. For example, agency asset-management divisions may need to know details about individual assets that the user community creating the map might not focus on. They could still leverage a crowdsourced map for understanding the road network, but they might have to create their own supplemental layers for certain assets like guardrails, signs, etc. if the user community had not already created those layers. Use Cases for Crowdsourced Map DataUse Case: Virginia DOT 511 System. VDOT 511 traveler information system (figure 26) uses MapBox and OSM as their primary map data. VDOT overlays a number of data elements on top of OSM base data, including event locations and details, DMS, color-coded segments based on realtime probe vehicle speed, Waze-reported events, weather conditions, etc. MapBox builds additional detail on top of OSM and then provides that product and associated services at a cost (figure 27). 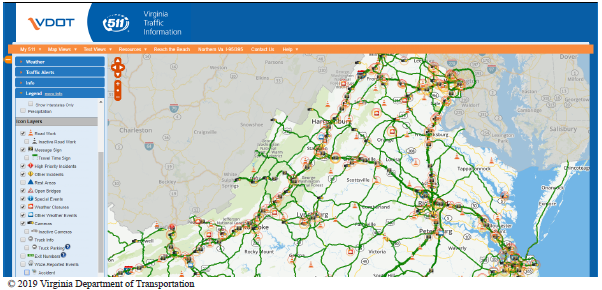 Figure 26. Screenshot. The Virginia Department of Transportation 511 home page. Source: Virginia Department of Transportation, 511 Website. Available at: http://www.511virginia.org/. 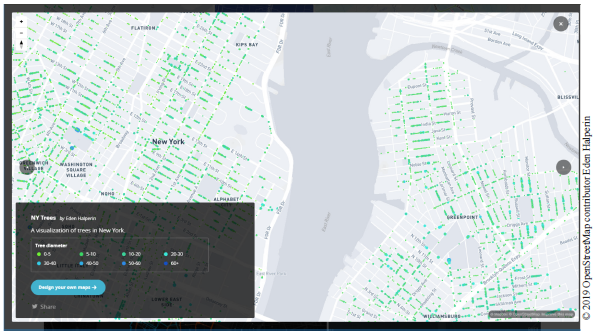 Figure 27. Screenshot. Example of a MapBox map visualizing trees in New York City. Source: Mapbox, Gallery, Website. Available at: https://www.mapbox.com/gallery/#map-0. 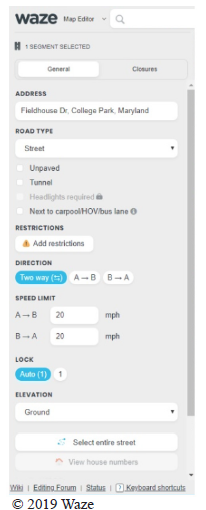 Figure 28. Screenshot. Inputs panel on the Waze Map Editor. Source: Waze. Use Case: Port Authority of New York and New Jersey Road Closure Application. PANYNJ uses the Waze crowdsourced map as part of its online road-closure application to indicate which roads are closed. This helps to keep traffic from being routed onto those roadways. Waze collects crowdsourced map data in addition to collecting crowdsourced congestion and incident data as a basis for their maps (figure 28). Each Waze user can report map errors or contribute new information (e.g., new roads, new infrastructure such as red-light cameras, etc.) using the Waze Map Editor. This makes Waze map very accurate and timely when it comes to the roadway network. However, Waze map is not available for purchase by third parties at this time, and therefore it is of limited use to TMCs. Waze allows users to use a map editor to suggest changes in existing map data, and if the user is a known map editor in their area, or other users verify the suggested change, that change becomes permanent in the new map. Waze has defined different user levels based on their level of engagement on the platform. Users logged into the Waze app collect points as they drive more miles and as they report events and have those events validated by other users. Classification of Waze users into different map editor levels depends on the amount of driving they do and the number of edits they submit. Initially, users can only make edits within 1 mile around routes they traversed. Trustworthy Waze users gain the ability to provide edits more broadly based on integration and validation of their map edits. In addition to regular Waze users, different geographic regions have dedicated Waze Map Editors verified by Waze as trusted contributors who can validate other editors' contributions and provide guidance. General Transit Feed Specification (GTFS) One of the byproducts of Google Maps was the generation of Google Transit Feed Specification (later released as General Transit Feed Specification). GTFS was created as a way for Google to collect agency transit data (schedules, routes, fares, etc.) and display them on the Google Maps. Agencies saw this as a great opportunity to provide transit data to a wider customer base and built their systems to provide GTFS feeds and further enhance Google Maps, opening up new opportunities to provide value-add to their customers. Use Case: California's Bay Area 511 System. 511 SF Bay is the multimodal traveler information system managed by a partnership of agencies led by the Metropolitan Transportation Commission, the California Highway Patrol (CHP), and the California Department of Transportation. The system provides traveler information for Bay Area travelers via the web or phone. 511 SF Bay uses Google Maps online to show a range of realtime and static traffic, carpooling, transit, parking, and bicycling information. Google Maps (figure 29) is an example of a proprietary map that uses Google-generated map data in combination with user-contributed data. Google collects location information using their own mobile devices, devices running the Android operating system, and devices running Google location services-powered apps. In addition to this, Google has invested in a fleet of Google StreetView vehicles that traverse roadways (and, recently, trails) and generate images of the locations on the map as part of their StreetView service (figure 30). Users of Google Maps are frequently asked to contribute to map data by validating data collected by Google (such as verifying the location a user navigated to is correct, or verifying that hours of operation for a business are correct), as well as contributing supplemental data such as images of the business or landmark, reviews of services, etc. Due to the significant size of the Google Maps user base, it tends to have one of the more accurate and up-to-date map data sets. Still, updating brand new roads can take a little time—sometimes longer than a DOT would like. While agencies can purchase Google Maps for use in their TMCs, it can be expensive and may limit an agency in what maps can be used for and how they can be modified or enhanced. The Google Maps platform provides three different products: maps, routes, and places. Each product consists of a number of capabilities available via APIs (figure 31). For example, routing products allows users to generate directions for different modes of transportation, distance matrices that provide travel times and distances for locations, and road traveled during a trip. 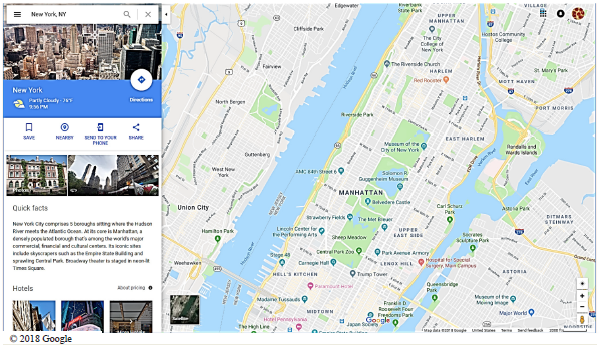 Figure 29. Screenshot. Google Map. Source: Google.  Figure 30. Screenshot. Google StreetView. Source: Google.  Figure 31. Screenshot. Example routing result code from Google Maps. Source: Google. Probe-based Speed DataDescriptionOver the last several decades, agencies often used floating car data to supplement speed data collected by the traditional static sensors. Use of floating cars was intermittent, tedious, and time consuming, which proved to be only marginally useful. Over the last 10 years, the private sector expanded on this concept by using technology built into vehicles and smartphones to transform a large percentage of travelers into probe vehicles. As the number of probes rose, the accuracy and reliability of probe speed data increased to the point where day-to-day transportation operations and planning efforts realized significant benefits. Probe vehicle data comes from vehicles and people equipped with embedded GPS devices (in their vehicles or smartphones) and provides speed and travel time information. Planning and operations use this information now that it can be aggregated and anonymized. Another way to generate probe vehicle data is using toll tags, as the Florida DOT (FDOT) does (figure 32). Toll operators use toll tags to identify and re-identify vehicles as they traverse the toll facility and use that information to calculate speed and travel times between re-identification points. 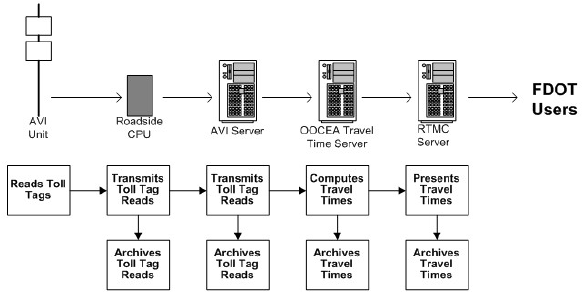 Figure 32. Diagram. Toll tag travel time calculation. Source: FHWA, iFlorida Model Deployment Final Evaluation Report, 2009. Available at: https://ops.fhwa.dot.gov/publications/fhwahop08050/chap_4.htm. Applications of Probe Vehicle DataProbe vehicle data has many applications, including, but not limited to:
AttributesProbe vehicle data is different from traditional ITS sensor data because it is link-based (probe) rather than point-based (sensor). This means that calculation of speed and travel time occurs over some distance on the roadway. Each speed/travel time record is associated with a timestamp and geographic link identifier as well as some form of confidence score that provides insight into the reliability of each data record. In the early days of probe vehicle data, providers exclusively used traffic message channel codes to identify geographic links associated with speed and travel time data. However, in recent years, data providers have increased granularity and coverage of their measurements to be able to provide data in sub-segments and outside of the traffic message channel network. Those smaller links vary across providers as they use proprietary technology and aggregation methods in data generation. Links can be as short as a couple hundred feet.
To get the best available data and largest possible coverage, agencies sometimes purchase data that may be complementary to each other from multiple providers. Many agencies have developed data use agreements that include quality expectation clauses that ensure that providers adhere to minimum quality requirements and maintain a competitive market. To achieve this, agencies often employ independent validators to analyze data and compare it to ground truth data to ensure it complies with the minimum required accuracy and quality standards. Data AvailabilityPrivate sector probe vehicle speed data providers work with their partners and service users to collect billions of GPS data points aggregate them into speed and travel time data records based on underlying map segmentation. Transportation Network Companies (TNCs) collect similar data, but are not currently selling this information to public agencies for operations purposes. This data is limited to areas where TNCs operate and have significant penetration, which is limited to large metropolitan areas. Additionally, many toll facility operators collect probe speed data using toll tag readers. For example, the Florida Turnpike Enterprise collects toll tag data and conflates it to their custom link-based map used in conjunction with their sensor data to monitor congestion and detect any issues related to traffic flow on the toll road. The Florida Turnpike Enterprise uses toll tag reads from different gantries to determine average link speed on their toll facility. It uses its own roadway segmentation that does not conform to any specific standard, but works well with their internal operations map. Then they calculate speed and travel time across those links based on toll tag identification. The agency collects toll tag data and conflates it to their custom link-based map used in conjunction with their sensor data to monitor congestion and detect any issues related to traffic flow on the toll road. Pros and ConsThe primary benefit of probe vehicle data is ubiquitous coverage of the roadway network. In comparison to traditional ITS sensors deployed on a limited subset of the network, probe vehicle data can be collected anywhere there are equipped vehicles or devices. The current state of technology shows that probe vehicle data covers a large and growing percentage of all roadway networks. Figure 33 shows an example from Georgia, where the triangles represent the location of sensors deployed by the Georgia DOT in Atlanta. Roads with color on them are receiving probe-based speed measurements from a private sector probe-based speed data provider. 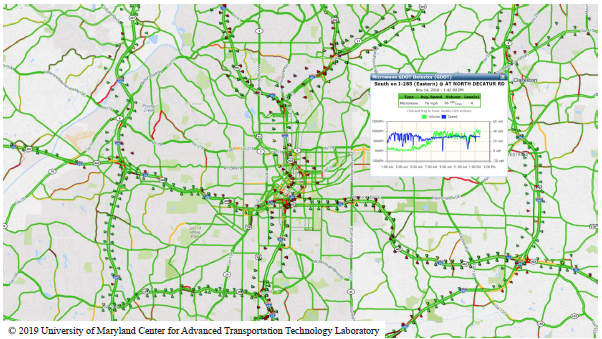 Figure 33. Screenshot. Probe data provides ubiquitous coverage. Source: University of Maryland Center for Advanced Transportation Technology Laboratory. Probe vehicle data has demonstrated a high level of accuracy and quality on highways, especially in metropolitan areas. However, the quality and accuracy of probe vehicle data on arterial roadways are not as high due to the nature of interrupted flow. However, providers have been working on improving data on the arterial roadway network and have shown some improvements over the last several years. One of the major challenges associated with probe vehicle data is that it does not have associated volume information. So while speed and travel time information may be accurate, it is not clear how many vehicles may be experiencing that speed and travel time. This information is still mainly generated by the static ITS sensors. In recent months, there has been emerging research providing methods to approximate volumes for probe vehicle data. While not 100 percent accurate, these methods will continue to improve and be a viable option for operations and planning use. Use Cases for Probe-Based Speed DataUse Case: Capital Investment and Project Selection. Agencies have a responsibility to identify best uses of limited funds and resources to improve safety and mobility. Previous project selection and capital investment decisions required significant analysis and research influenced by political pressure or vocal groups. With the availability of probe vehicle data, agencies have an opportunity to identify necessary projects based on insights from data. For example, agencies can use probe vehicle data to generate a list of the most congested spots in a region (municipality, county, State, or multi-State region). Probe vehicle data helps to identify bottlenecks, sets of consecutive roadway segments where speeds drop below a certain threshold and remains below that threshold for some period. Properties of each bottleneck include its average length, duration, intensity, and frequency and pattern of occurrence. Significant and repeating bottlenecks can be good indicators of issues that can be resolved through implementation of improved operational strategies or capital investments. Figure 34 shows bottleneck ranking using INRIX data. 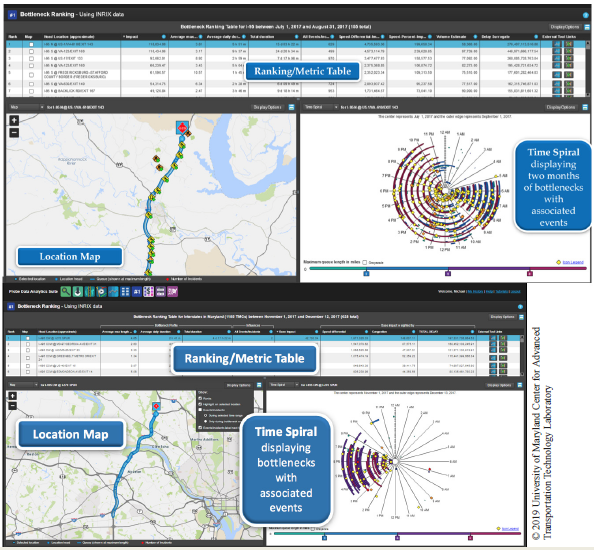 Figure 34. Screenshot. Bottleneck ranking. Source: University of Maryland Center for Advanced Transportation Technology Laboratory. Once a particular project location is identified, probe vehicle data can be used to analyze conditions prior to, during, and after implementation of the solution to determine the actual impact of the investment (figure 35). Animating speed data over time shows changes in congestion patterns. Probe vehicle speed data can be combined with other data sets, such as traffic volumes, traffic type classifications (commercial or passenger), and estimated value of travelers' time, to determine user delay costs (figure 36) and cost changes resulting from project implementation. Similar analysis can evaluate major event impact. 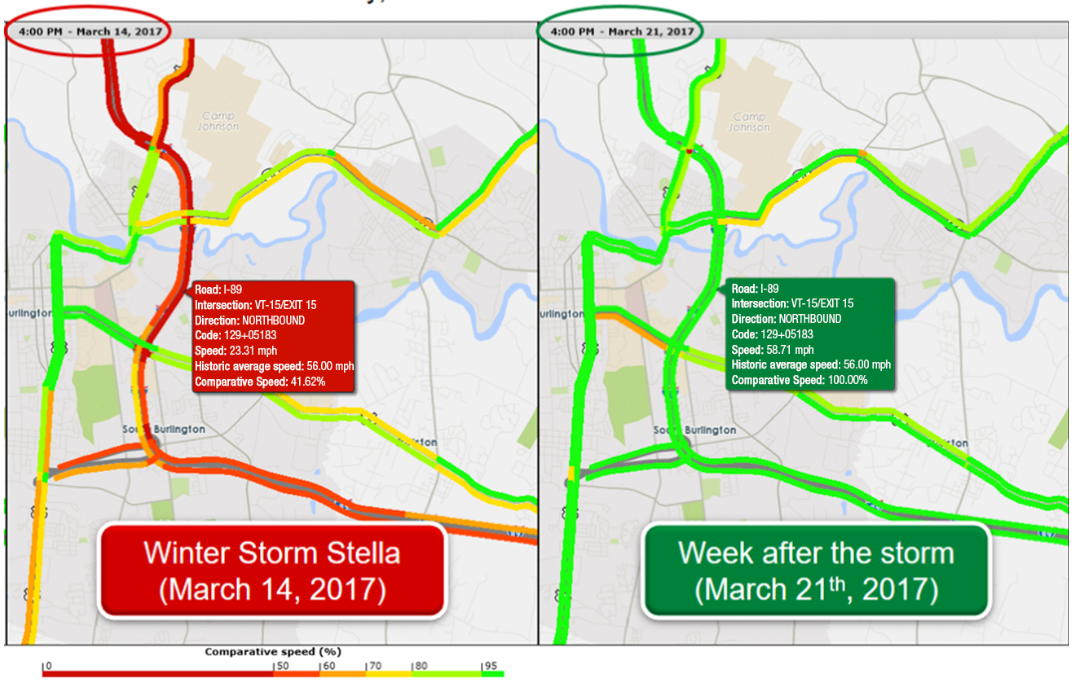 © 2019 I-95 Corridor Coalition Figure 35. Screenshot. Trend map shows a comparison of performance before, during, and after a major event. Source: I-95 Corridor Coalition, Real-Time Traffic Incident Management Information System User Group Presentation. Available at: www.i95coalition.org. 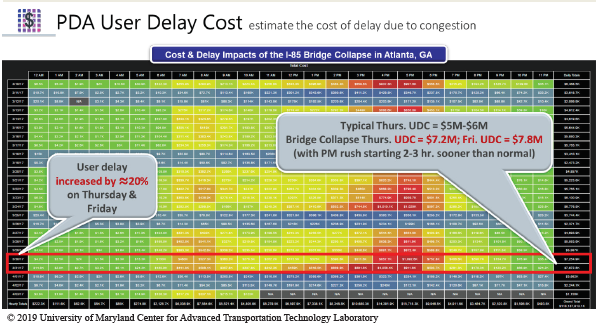 Figure 36. Screenshot. User delay cost resulting from a major event. Source: University of Maryland Center for Advanced Transportation Technology Laboratory Use Case: Performance Management and Reporting. Probe vehicle data can help agencies evaluate mobility performance of the transportation system at varying geographic levels, from hyperlocal to regional. Probe vehicle speed and travel time data can provide the ability to calculate valuable metrics such as travel time index, buffer time index, and planning time index, which provide insight into system performance in comparison to average conditions, historical conditions, or ideal free-flow conditions. These metrics can help an agency evaluate its operations and identify areas for improvement. Realtime dynamic performance dashboards use these metrics (figure 37) to identify issues in realtime as well as for inputs into daily, weekly, monthly, quarterly, and annual reports to the legislature, decision makers, and the public. Figure 38 shows an example performance report. 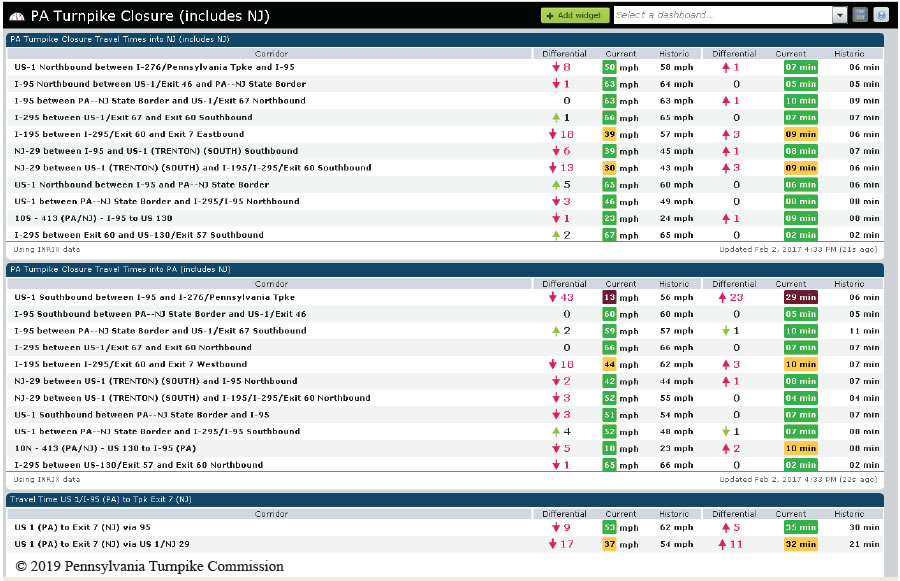 Figure 37. Screenshot. Example of a performance dashboard travel time widget. Source: Pennsylvania Turnpike Commission. 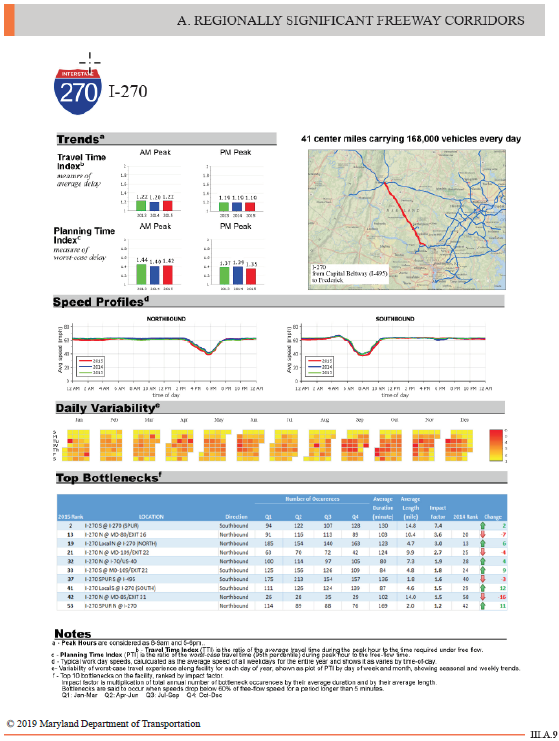 Figure 38. Screenshot. Example performance report. Source: Maryland Department of Transportation, 2015 Maryland Mobility Report. Available at: https://www.roads.maryland.gov/OPPEN/2015%20mobility%20report%20draft_highres_for%20website1.pdf. Use Case: Traveler Information and Holiday Traffic Forecasting. Archived probe vehicle data provides insight into travel patterns, especially as they relate to holiday traffic. Agencies can use these historical patterns to forecast impacts and inform the traveling public accordingly. For example, the Baltimore Metropolitan Council uses probe vehicle speed and travel time data to identify best days and times for travel during Thanksgiving week and publishes that information on their website to inform the traveling public (figure 39). 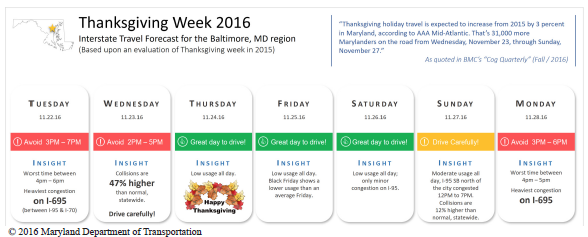 Figure 39. Screenshot. Example of an Interstate travel forecast for the Baltimore, MD region during the week of Thanksgiving in 2016. Source: Baltimore Metropolitan Council. Use Case: Multiple Uses Across Planning and Operations. State DOTs, MPOs, and cities are using probe-vehicle speed data for a range of planning and operations purposes including traveler information and travel time generation, before and after studies, project prioritization, and performance measurement. Maryland DOT, Arizona DOT, and Pennsylvania DOT are examples of organizations that use probe speed data from INRIX for traveler information and travel time generation, before and after studies, project prioritization, and performance measurement. INRIX primarily works with freight operators, fleet vehicles (such as taxicabs, United Parcel Service, FedEx, etc.), individual OEMs, and their custom app users to collect location data over time. INRIX aggregates individual probe readings per roadway segment to calculate segment-based speed and travel time in near realtime. In addition to speed-readings and travel time calculations, INRIX provides confidence scores that implicitly indicate the number of probes used to generate data and the level of modeling/imputing/archived data used to supplement low probe count. INRIX makes this segment-based speed and travel time data available to TMCs as a realtime data feed, archived raw data dump, or as part of the analytics package that includes both data and a set of data analysis tools. INRIX provides speed, travel time, and confidence score values per segment of the road at a frequency as low as once per minute. They offer several different roadway segmentation patterns:
 Figure 40. Screenshot. Example of INRIX TMC-based metadata. Source: INRIX.  Figure 41. Screenshot. Example speed and travel time data. Source: INRIX. The confidence score indicates the quality of speed and travel time data. The score can be 10, 20, or 30.
Note that the data depicted in figures 42 and 43 is not relevant per se; rather, the purpose of these illustrations is to indicate typical data type and configuration. 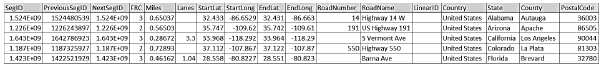 Figure 42. Screenshot. Extreme Definition metadata. Source: INRIX. 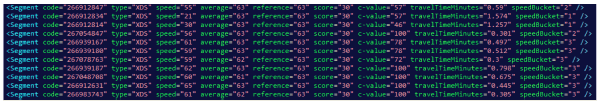 Figure 43. Screenshot. Example speed and travel time data expressed in extreme definition format. Source: INRIX. North Carolina DOT, FDOT, and Georgia DOT use probe speed data from HERE for these activities (figure 44). 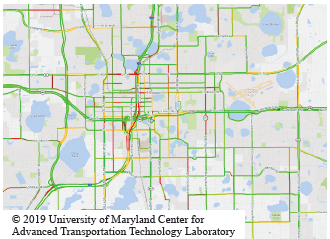 Figure 44. Screenshot. HERE speed data in Orlando, FL. Source: INRIX. HERE works with smartphone manufacturers and cell service providers, as well as OEMs, to collect location data over time. HERE and INRIX data formats are very similar, with slight differences in how they define data quality measures. HERE also provides data access to TMCs via realtime feeds, archived raw data dumps, and analytics platforms that include both data and analysis tools. Similar to INRIX, HERE provides speed, travel time, and confidence value per segment of the road at frequencies as low as once per minute (figure 45 and figure 46). HERE data use several segmentation patterns as well:
HERE probe data also comes with a quality measurement in the form of a confidence factor.
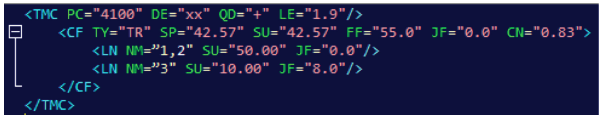 Figure 45. Screenshot. Example HERE traffic message channel per-lane data. Source: HERE.  Figure 46. Screenshot. Example HERE sub-segment per-lane data. Source: HERE. In conjunction with the ICC, Maryland DOT is currently testing the use of data from the private sector vendor, TomTom, for a range of planning and operations functions. TomTom collects probe speed data from its navigation system users, which include both passenger and freight vehicles. Unlike INRIX and HERE, both of which are present globally in some way, TomTom has a strong presence outside of the U.S. and generally larger coverage in Europe. Similar to INRIX and HERE, TomTom collects segment-based speed and travel-time data and provides this data to TMCs as realtime data feeds. Similar to INRIX and HERE, TomTom provides segment based speed and travel-time at frequencies as low as once per minute (figure 47). TomTom data uses two segmentation patterns as well:
 Figure 47. Screenshot. Example TomTom data. Source: TomTom. High-Resolution Asset AreaDescriptionThe parallel development of higher fidelity sensors, LiDAR, and efficient machine learning algorithms has enabled companies to begin collecting asset data at a high resolution and in realtime. Today, many passenger vehicles are equipped with powerful sensors, and many high-end connected and semi-automated vehicles have high-definition cameras and LiDAR. Companies have found ways to use those sensors and cameras to collect information about a vehicle's environment and use that data to update agency asset-management systems with the latest and greatest information. For example, a vehicle can use machine learning to process an incoming image from an on-board camera like those found on some higher-end semi-autonomous vehicles and recognize a speed limit sign. Not only does the vehicle recognize that an object is a speed limit sign, but it can also determine the listed speed on the sign and compare it to the stored value (either in a remote or local database) and determine if the sign has changed. The use of these cameras on CVs is a form of crowdsourcing that can be used to support asset management. Specialized vehicles can measure other asset states, such as pavement cracks, potholes, pavement markings, signs, etc. As vehicles collect data on these assets, they can compare them over time to determine if they are deteriorating at an expected, slower, or faster rate. Applications of High-Resolution Asset DataHigh-definition asset data can update asset information for maintenance, operations, and planning purposes. For example, detecting the existence of a new sign or change in a sign can provide update information for internal maps and keep the asset inventory up-to-date for maintenance and operation purposes. Similarly, pavement conditions can be stored and analyzed over time to determine the rate of deterioration to prioritize maintenance investments. AttributesData attributes vary based on technology and specific asset focus, but generally, data includes location, timestamp, and asset information. Asset information can be available as point clouds, images, deviation measurements, etc.
Point Clouds and Asset Mapping. Point cloud data is sometimes considered a subset of high-resolution asset data. It is the underlying data on which some (but not all) high-resolution asset data is built. Point cloud is becoming a more popular way to identify and provide insights into assets on and adjacent to the road (or the condition of the road itself). Sometimes referred to as LiDAR data or three-dimensional scanner data, point cloud data collects extremely precise x,y,z coordinates that can be combined with timestamps, intensity, Red, Green, Blue (RGB) values, and other attributes to generate three-dimensional views of assets (signs, guard rails, pavement cracking, trees, etc.). A scanned point cloud for even a small area often consists of billions of points. At this scale, many agencies struggle to store and process these point clouds to generate meaningful asset information. Transformation into mapped assets makes point clouds useful, as shown in figure 48. Companies specialize in extracting meaningful asset information from LiDAR point clouds. For example, one company extracted features such as lanes, guardrails, barriers, signs, street lights, drainage, and other assets and create a mapped asset database used by maintenance and operations at FDOT. Other companies are producing high-resolution maps and developing asset management solutions for DOTs now—all based off of point-cloud data, which they store, transform, and manage for the agency. 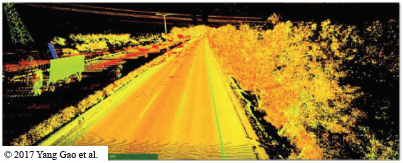 a) Original point cloud data.  b) Point cluster of pavement markings.  c) Vectorized pavement markings. Source: Yang Gao et al. (2017). Automatic extraction of pavement markings on streets from point cloud data of mobile LiDAR. Measurement Science and Technology. 28 085203. Available at https://doi.org/10.1088/1361-6501/aa76a3. Data AvailabilityA number of data providers offer high-resolution asset data using new technology and artificial intelligence. Some example providers include the following:
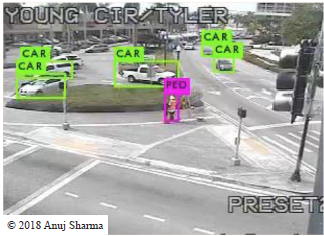 Figure 49. Illustration. Deep learning object identification presented. Source: Anuj Sharma, presentation to the 2018 TRB Annual Meeting Session P18-21443. Pros and ConsThe primary benefit of the new technology and data collection methods for high-definition asset data is that data can be available in near realtime. Previously, asset data collection required significant effort and cost, leading to infrequent use. Now asset data collection occurs at a much higher frequency and by multiple vehicles, making the data available in nearly realtime. Another challenge in using sensors, LiDAR, and cameras to collect asset data is that there could be situations in which collected data is inaccurate. For example, a database may claim that there is a speed limit sign at a particular location, but as the vehicles pass that location, a truck in an adjacent lane obstructs the sensor's view of the speed limit sign. In this situation, the sensor, camera or LiDAR may claim removal of the speed limit sign since it was not visible. Similarly, some sensors, and many cameras, do not perform as well in adverse weather conditions such as rain, snow, and fog. In this case, data collected by a mobile sensor may be inaccurate or unreliable. While data is valuable, it may be difficult to handle in its raw format. For example, until processed, point clouds or contours may not be useful or actionable for an agency to provide valuable information. Agencies rarely have the resources or expertise to process massive raw point cloud data sets, so they have to rely on third parties to process that data and package it for use in operations and maintenance. Wi-Fi and Bluetooth Re-identification DataDescriptionThis technology provides true, measured travel times and O-D data between two locations. Wi-Fi and Bluetooth re-identification data became a valuable source of actionable information as smartphone penetration increased to the point where almost every driver, passenger, bicyclist, and pedestrian has a smartphone that is equipped with Wi-Fi and/or Bluetooth. In recent years, many vehicles also have Wi-Fi or Bluetooth transceivers as well. Wi-Fi and Bluetooth data is primarily location data collected by static Wi-Fi and Bluetooth scanners that can identify Wi-Fi or Bluetooth devices at different locations and use that information to infer speed and travel time information, and if deployed extensively throughout a network, can also be used for travel pattern and O-D analysis. Applications of Wi-Fi and Bluetooth Re-identification DataSome of the key applications of this data set include:
AttributesMost Bluetooth and Wi-Fi data consists of a media access control address (MAC address), a unique device address that identifies it as it moves through the network. For example, a vehicle is detected by one sensor that records the vehicle's MAC address. As that vehicle passes a second sensor, the MAC address is captured again. The distance between the two devices divided by the time between re-identification provides speed and travel times. Data AvailabilitySeveral private companies provide this data. Some providers offer Bluetooth roadside sensors that detect Bluetooth devices in realtime to approximate travel time. Another company provides Bluetooth devices that can be used to detect passing vehicles and pedestrians to obtain O-D, travel time, and trip pattern information. At least one company offers remote configurable devices that identify both Bluetooth and Wi-Fi devices and can determine travel patterns in various weather and traffic conditions. Another provides small portable devices as well as complete pole-mount sensor solutions for temporary or permanent data collection. Pros and ConsOne of the primary benefits of Bluetooth and Wi-Fi data is that it provides direct insight into individual trips between each sensor. Sensors are relatively inexpensive and lightweight, so deployment to address a core data need in an area is easy to accomplish. The down side of these sensors is that they still require power and communications back to the agency. They are a physical device that needs to be physically deployed and maintained. Data is only collected where sensors have been deployed, making them significantly more costly to deploy on a wide scale when compared to probe data. Data can only be collected from vehicles and Wi-Fi/Bluetooth-equipped devices that are turned on and actively broadcasting their signal. Data filtering needs to be built into the device or the agency to remove anomaly data from vehicles that pull over into retail areas and do not return to the road network for an extended time. Finally, Wi-Fi pollution and general interference can result in distortion or data drops. Credit Card Transacton DataThe All Hazards Consortium and the Department of Homeland Security use data from credit card point-of-sale machines to detect which businesses are open or closed following significant events (like a hurricane, snowstorm, or terrorist attack). The credit card swipe data serves as a surrogate measure of power outage information. Using the crowdsourced credit card swipes is an easy way to globally detect whether services are being restored properly in an area—which helps traffic operations, first responders, and maintenance crews understand where to focus their response and recovery efforts. Applications of Credit Card Transactions DataThe All Hazards Consortium's FLEET OPEN/CLOSED Service is designed to help locate open places of business that provide fuel, food, medications and medical supplies, retail stores, and hotel rooms during a prolonged power outage within a city, county, State, region, or across the United States. The basic benefit will include the ability to find fuel, food, pharmacies, and hotel locations during power outages. This information is for commercial use only and is not available to the public, ensuring that non-operational users do not overload the system. Besides this capability, the system can be used to support collaboration with electric companies regarding details on outage areas and where critical infrastructure exists that can be coordinated within the response coordination cycle with the electric sector liaison or contact person. The service is available 24 hours per day with electric updates made multiple times every day. This provides the latest information in near realtime. Navigating this site is simple and enables users to zoom in on a particular region, State, or city. This information is encrypted, secure, protected, and restricted to users only. AttributesThere is no personally identifiable information in these data feeds. The data only has the number of transactions and time of each transaction. There is also positioning information (addresses and business names) that tie the transactions back to a specific location. Pros and ConsThe data is only useful during major events that affect power in a region. Therefore, the agency is paying for data not used on a regular basis. The agency must also manipulate the data into a surrogate for power outages. For example, one can keep a record of transactions for all businesses over time, and then provide warnings to users when zero transactions are occurring during a specific time when businesses should be open and operational. The data provider requires additional levels of security and credentialing to be placed on users of this data. For example, the provider may require a specific level of encryption and a radio frequency identification (RFID)10 card for users who want to see the data. This is a relatively minor technical barrier, but can be an operational barrier if agencies need to purchase new computer equipment with card readers and RFID badges for employees. Connected Vehicle Data From Third PartiesDescriptionMany vehicle manufacturers assembled millions of vehicles with embedded CV technology (figure 50). Data from these providers can include wiper use, headlight use, heavy braking, traction control, fuel consumption, emissions, travel speed, acceleration and deceleration, and more. Example applications include using wiper activation data for rain and micro-level weather predictions, using heavy braking events for end-of-queue or debris detection, or using traction control engagement events for detecting slippery or icy road conditions. These predictions and detections allow agencies to pre-position maintenance and response crews to mitigate the impacts of events. 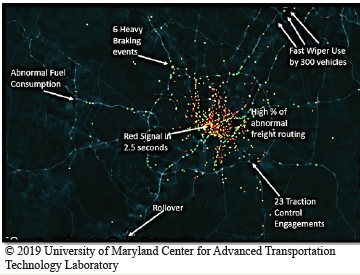 Figure 50. Illustration. Third-party, connected-vehicle events from the Washington, D.C. region. Source: University of Maryland Center for Advanced Transportation Technology Laboratory. Data AvailabilityTelematics providers have been making this data available to consumers and freight logisticians for years. However, some mapping and location data companies are on the cusp of making this data available to DOTs as part of their regular incident data feeds. Millions of these vehicles are operating on the Nation's roadways—more vehicles than in any CV Pilot in the United States today—and are reporting events precisely as they happen, exactly where they happen, without any need for installed roadside infrastructure. The data comes to a central server via wireless, cellular technologies embedded in vehicles. The data is anonymized, cleaned, and then provided as an incident feed to agencies and automobile manufacturers. Applications of Connected Vehicles DataSurface Weather Event Detection. When a driver turns on windshield wipers, this becomes a surrogate for the arrival of rain and (usually) the beginning of a period with wet and slippery pavement. Plotting exactly where and when dozens of vehicles turn on windshield wipers allows not just knowledge of where it is raining, but realtime calculation of the movement of weather at the micro-level; this will enable predictions about where it will hit next. Furthermore, reporting heavy braking, traction control engagement, travel speed, acceleration, and deceleration to TMCs without latency allows smart networks to react almost reflexively as major flow disruptions occur (e.g., to warn vehicles to slow down early). Early Event Notifications. Air bag deployments, rollover indicators, and extreme deceleration can immediately alert agencies of a potential incident on the roadway in advance of other detection technologies (like a 911 call, service patrol identification, etc.). AttributesData attributes vary from provider to provider, but look very similar to agency incident data. There is usually an event type, location, time stamp, etc. Pros and ConsBecause this data is automatically collected over any road network that has access to cellular data service, the DOT can quickly gain enhanced situational awareness on parts of their road network that would otherwise lack coverage. CV data can also alert the DOT of potentially dangerous events and surface conditions long before a scene becomes a true incident. This could allow the agency to be proactive instead of reactive—for example, in responding to slippery surface conditions noticed by traction control engagements in multiple vehicles. Alternatively, the data could potentially be voluminous and distracting to operators—much like crowdsourced data. Therefore, some additional filtering and automated integration with the ATMS is generally recommended. Realtime Turning Movement DataDescriptionRealtime turning movement data describes how many vehicles are taking a particular exit, turn, or are traveling through an intersection. Historically, this data was collected only via deployment of an extensive sensor network on exit ramps and at intersection approaches and exits. However, third parties are now directly measuring or estimating turning movements from a mix of probe data and other sensing technologies. Applications for Realtime Turning Movement DataRealtime turning movement data allows transportation agencies to determine driver compliance rates with routing advice. With the combination of high-resolution signal data and the commercial vehicle CV data, a transportation agency can realize greater benefits from integrated corridor management (ICM) concepts that link freeway operations and signalized arterial operations. Freeway and arterial operations will be able to coordinate better through shared information about network flows, rerouting, and the impacts of incidents and events. Agencies could suggest alternate routes and actually measure what percentage of vehicles are taking their advice (or making up their own paths). AttributesThe attributes vary between data providers, but one provider gives the percentage of traffic taking Exit A versus B at each intersection or turning left versus right versus going straight on arterials. Pros and ConsThe main drawback is likely that realtime turning movement data is new and the larger transportation community has not fully tested and validated it. Agencies that purchase this data will be able to derive new operational insights, but, since some of the data may be faulty, they need to perform some level of validation to ensure realistic decisions. Despite this caution, there is significant promise for this type of data. High-Resolution Signal DataDetailed SPaT plus sensor actuation data has a resolution of 1/10 of a second (10 Hz). This means that all of the fundamental metrics needed to understand how each signal is operating and how it is loaded with traffic will be available to the decision support system in realtime. A new class of small and relatively inexpensive "aggregator" devices makes it possible to interface with the controller inside each cabinet. These devices not only bundle sensor data streams and ship them to the TMC but also receive and implement commands coming from the TMC. This capability provides a low-cost connection for DSS to control precisely the phases and timings of large networks of signals at once. (These devices work with traffic signals of any age or technology, with or without a hardwired communication network, giving it broad usefulness for deployments later nationwide.) DescriptionTraditionally, snapshot view retiming methods managed signalized corridors that required manual data collection and modeling. As a result, daily counts were not representative of changing conditions throughout the day. This gave rise to signal timing that was not responsive to conditions. New data collection technology built into controllers generated high-resolution signal data recorded over 150 different controller events at a very high frequency. This high-resolution data allows operators to evaluate signal system performance in realtime and to provide strong support for accurate optimization of the system to manage traffic flow. Applications of High-Resolution Signal DataThe primary application of high-resolution signal data is in measuring the performance of a signal system in realtime to be able to optimize the system and adapt to the changing conditions in an automated manner. This realtime optimization takes the place of traditional signal operation modeling and estimation. From a planning perspective, archived high-resolution signal data can provide insights in seasonal variations and general changes over time. Similarly, this enables the use of high-resolution data to evaluate queues, turn movement counts, and volume to capacity ratios. In addition to mobility improvement applications, high-resolution signal data also provides safety benefits. It allows operators to detect and record red light and right-turn-on-red violations. Examples of the performance measures supported include:
AttributesHigh resolution signal data includes more than 150 different elements broken into active phase events, active pedestrian phase events, barrier and ring events, phase control events, overlap events, detector events, preemption events, coordination events, and cabinet/system events. All events are timestamped. Each collection of events comprises a detailed list of signal and detector states. Collection of controller events at 10Hz frequency means that operators have visibility into the state of the signal and intersection at a very fine granularity. Pros and ConsThe primary benefit of high-resolution signal data is that it provides many data points at a high frequency, which allows operators to understand the realtime conditions at the intersection and quickly react to or even predict congestion and poor signal performance. Agencies have identified a number of previously unattainable performance measures calculated using this data. Additionally, high-resolution signal controllers are inexpensive and can be phased into existing systems, allowing agencies to budget for and deploy high-resolution systems more quickly and affordably. The down side of this data set is that, at such a high frequency, it requires appropriate expertise and infrastructure to store and process. Air Quality Sensor DataDescriptionAir quality sensors are capable of identifying primary pollutants, generated directly by source, as well as secondary pollutants resulting from chemical reactions in surrounding air. The sensors collect a variety of measurements, including nitrogen dioxide, ozone, carbon monoxide, hydrogen sulfide, sulfur dioxide, and others. These sensors often can collect additional data elements such as sound and vibration, temperature, and in some cases light intensity. These low-cost sensors provide a hyperlocal view of air quality that can change from block to block and intersection to intersection in a dense urban area. Applications of Air Quality Sensor DataAir quality sensor data has several uses, especially in urban areas. For example:
AttributesSensors record timestamps and air concentration measures for a variety of pollutants, chemicals, temperature, pressure, and in some cases sound and vibration, as well as light intensity. Data AvailabilityMany different vendors manufacture and sell air quality sensors. Several organizations provide localized air quality data. For example, the City of Chicago is equipped with over 100 air quality sensors as part of the Array of Things11 collaborative effort between the Urban Center for Computation and Data (joint initiative of Argonne National Laboratory and University of Chicago) and the City of Chicago along with a number of other universities across the country. As part of this project, the city and University of Chicago have published the collected data for public consumption. Pros and ConsAir quality sensors are affordable, but they also provide hyper-local measurements, which means that in order to get a good aerial or regional insight into air quality, an agency would need to deploy a network of air quality sensors. In the case of transportation operations and planning applications, air quality sensors can provide valuable supplemental information, but are rarely sufficient on their own. Roadway Weather PredictionsDescriptionWhile basic National Weather Service prediction data has been available for many years, these predictions cover wide areas and tend to focus more on air temperature and precipitation averaged over a region. Several companies now offer ground-based (i.e., at street level) 48-hour weather predictions that are updated every hour. This information can be used to optimize winter weather response operations; improve snow event readiness; reduce staffing, fuel, and chemical costs; pinpoint treatment applications; and generally keep the roads safer and less congested. Farmers have utilized the weather prediction services of some of these companies for years, and now, seeing a similar operational need, they have branched out into the transportation domain. These companies are able to produce specialized and hyperlocal weather conditions and predictions from a mix of satellites, ground-based radar, ground-sensors, and most recently using connected vehicles' sensors (often from agency-owned plow and maintenance vehicles), and more. Specialized algorithms and data processing then produce more accurate ground-based weather predictions. Operators use this to understand the weather as expected and then experienced by the driver. Application of Weather PredictionsWeather can quickly and dramatically impact safety and mobility on roads. It can impact visibility. High winds can blow trucks off of roads and bridges. Icy roads can significantly impact vehicle performance. Table 12 shows the impacts on roads, traffic, and operations decisions.
Having accurate weather predictions on surface conditions can help agencies alert motorists of unsafe driving conditions, allow for pretreatment, and inform ongoing operational strategies that can dramatically affect safety and mobility. AttributesWhile each data and service provider is different, common data elements and attributes of road-weather prediction providers can include:
Data AvailabilityThis data is available from the private sector. One company has invested heavily in its weather solutions, which provide pavement and other weather predictions and data for maintenance and operations response. Originally developed for the agricultural industry, these weather solutions come in many forms, including a web-based client, mobile application, and data feeds. This company has even integrated some of its weather prediction products into other products and solutions, like signal systems applications and analytics. Another company offers a solution that leverages existing DOT (or other) closed circuit television (CCTV) cameras and image-processing technologies. Leveraging thousands of already-deployed cameras, the company processes images from these cameras to detect precipitation, cloud cover, fog, and other environmental conditions, then merges that information with other National Weather Service predictions and observations. Web-based analytics provide alerts to operators when specific conditions are detected. A few agencies have invested in in-house, full-time meteorologists. UDOT is one example, maintaining four full-time meteorologists in their Operations center 24 hours per day, 7 days per week. To reduce costs, these staff are allowed to provide meteorological services to other parts of the country in addition to their Utah geographies. Coverage varies by vendor. At least one provider leverages existing CCTV infrastructure, and therefore, certain attributes and alerts are more focused on areas where cameras have already been deployed. Another provider generally covers the entire country and all roads. Pros and ConsRealtime and predicted road weather information can be extremely beneficial to agencies operating in areas where winter weather, flooding, or other events can dramatically affect mobility and safety. The disadvantages to this data are relatively minimal and include cost, geographical resolution, and operator impacts. For example, while these services are higher resolution than most National Weather Service predictions, they are still limited to 1-kilometer square resolutions. This type of resolution is generally good enough for most maintenance applications. Also, high-quality road weather data can be relatively expensive; however, the benefit-cost can be significant, reducing maintenance costs, excess materials used, and fuel consumption and optimizing resource management. It can also have a significant impact on mobility, traveler information, and safety. Use Cases for Roadway Weather PredictionsUse Case: Indiana DOT. The Indiana DOT uses the Iteris ClearPath weather prediction software to help better manage the deployment of their snow plows and sand/salt trucks. With approximately 1,000 trucks in its fleet, the agency estimates that they can save over $750,000 in material costs alone ($750 per load of salt) if they can reduce their deployments by one trip. The use of more accurate weather predictions can help achieve this on multiple occasions throughout the year. This type of cost savings (which is conservative in that it only estimates the costs of materials, not operator time, fuel, equipment costs, or the reduction in crashes and safety impacts) quickly justifies the cost of the weather prediction service. Use Case: UDOT. UDOT has taken a different approach to predicting road weather conditions. As noted above, beginning in 2002, the agency employed its own full-time, in-house meteorologist in their traffic operations center (TOC). Unlike most weather reporting, the UDOT team does not provide a percentage chance of precipitation. Instead, they predict whether it will or will not snow, rain, etc. on different sections of roadways. Established under the TOC's Traffic Management Division, UDOT's weather program has two main components:12
The meteorologists provide services like:
Year-round, long-term weather forecasts are provided and used mainly for planning materials, staffing, and equipment. They provide pre-storm, during-storm, and post-storm weather forecasts to the maintenance managers, area supervisors, and local garages. They also provide forecast services for road rehabilitation and avalanche safety. Construction engineers and contractors also receive weather forecasts from the meteorologists for new construction and renovation projects. A 2008 research study was conducted to estimate the cost-effectiveness of the program on winter maintenance costs.1 The study estimated the value and additional saving potential of the UDOT weather service to be 11–25 percent and 4–10 percent of the UDOT winter maintenance costs, which include the costs of labor and materials. Based on this program's cost, the benefit-cost ratio was calculated at more than 11:1. In addition to maintenance and construction, the meteorologists provide weather forecasts to TOC divisions including:
They issue weather forecasts twice a day or more frequently as needed when conditions are changing rapidly. Additional Use Cases: The Federal Highway Administration's (FHWA's) Road Weather Management Program has documented 27 additional use cases for road weather operations.14 Computer-Aided Dispatch (CAD) DataDescriptionFirst responders and public safety agencies use CAD systems to identify the location of an emergency, the type of emergency, and then dispatch units to the scene. Generally, a 911 operator or a dispatcher who receives a call will enter basic information into a computerized system that pushes that information out to responders' mobile data terminals. The system can also be used by dispatchers to visualize field unit assignments to different calls. Some CAD systems are integrated with automated vehicle location (AVL) systems as well as telecommunications systems to allow for quicker information sharing and communications. Traditionally, CAD systems have been closed secure systems used exclusively by public safety personnel to manage field operations. However, most traffic incidents are first reported via cell phone calls to a 911 center. For example, up to 88 percent of incidents in Virginia were first discovered by the Virginia State Police. This means that public safety agencies are often aware of a traffic incident well before a TOC. By the time the DOT becomes aware of an incident, either via a courtesy or procedural call from the partner public safety agency, or by detecting it using CCTV or other ITS equipment, it could be 5–10 minutes or even longer after the incident occurred. That initial time after the incident is critical in achieving efficient and effective medical response and quick clearance. Over the last 15 years, many agencies have tried to integrate information from CAD systems into TMC operations to provide quicker incident detection and more efficient response. Some initial efforts focused on co-location of public safety and TMC personnel, but even in those instances, the communication and information sharing were inconsistent and limited. In the more recent past, agencies have begun integrating CAD systems data directly with the ATMS in a TOC to automate data exchange and reduce latency between when an incident occurs and when the TMC becomes aware of it. However, even these system integration efforts have encountered challenges related to information overload, sensitivity, and security. Applications of Computer-Aided Dispatch DataCAD data is mainly used to identify incidents more quickly and to identify incidents that a TMC would not otherwise be aware of either due to lack of coverage or jurisdiction. TMCs have integrated CAD data into their systems is several different ways:
AttributesLatency: Information is input into a CAD system in realtime as it occurs. As a call arrives to the 911 system, the dispatcher inputs relevant data into the system. This data is then pushed out to relevant field personnel and partners. However, information flowing to partners has to traverse several networks and firewalls between agencies. In addition to time for information to traverse the path between systems, some agencies and CAD systems have limitations when it comes to sharing mechanisms that prevent asynchronous information sharing. These systems may rely on some type of timer to dump and consume data, maybe once a minute or once every several minutes. Details: CAD data varies in level of detail and structure depending on agency and vendor. Generally, CAD data includes basic information including incident type, timestamp, and dispatched unit information. Some CAD data feeds also contain information about location, actions taken during the incident, caller information and status, etc. An example incident record coming from a CAD system to a TMC looks like this: <Incident>
</Incident> Data AvailabilityMost public safety agencies at the State level have CAD systems that were developed and maintained by different vendors. In a case where public safety and TMCs share information, each public safety agency works directly with a TMC to develop sharing mechanisms through their individual vendor applications. CAD data is not readily available to all TMCs across the country. Agencies are still working with their public safety partners to garner support and develop methods for exchanging this valuable data. CAD data coverage is directly related to a specific public safety agency jurisdiction. This means that municipal police CAD data may cover an urban area, while county police CAD data may cover arterial and county roads, and State police CAD data may be focused on interstates. The quality of data varies depending on the agency and system capabilities. Some systems provide a rich set of data elements, while others rely on mostly free-text entry that, while readable to a human, may not be very useful when it comes to automated integration into other systems. Figure 51 and figure 52 show examples of different CAD data that has been integrated into different ATMS platforms. The first two are from the State police in California, and the third is from the county police in Maryland. While one uses short-hand, abbreviations, and "10-codes" to describe the event, the other agency uses machine-readable text and "signal codes" to describe the event. 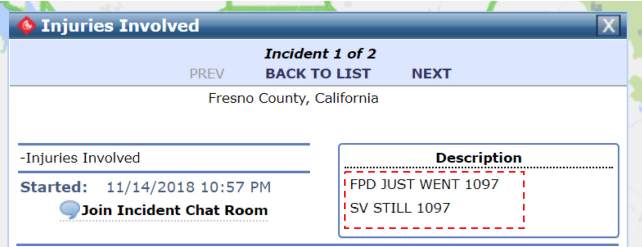 a) Difficult to read, free-text typed into the California Highway Patrol's computer-aided dispatch system (dashed box) and transmitted to Caltrans. 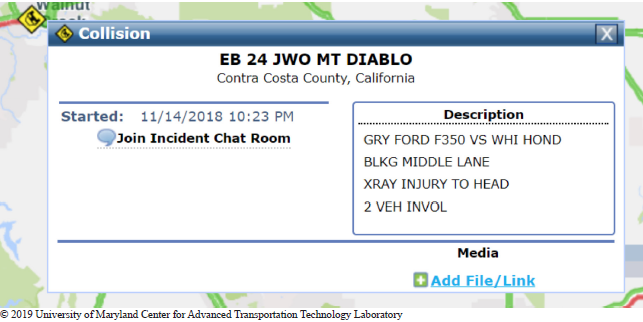 b) Example text free-typed to describe an incident, including use of verbal shorthand. Figure 51. Screenshot. A California Highway Patrol computer aided dispatch message. Source: University of Maryland Center for Advanced Transportation Technology Laboratory. 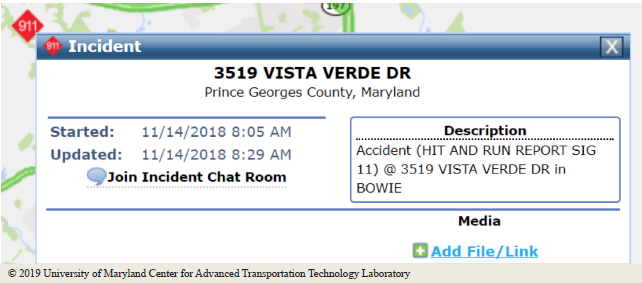 Figure 52. Screenshot. Prince George's County Maryland computer-aided dispatch system messages. Source: University of Maryland Center for Advanced Transportation Technology Laboratory. Pros and ConsThe most valuable contribution of CAD data to a TMC is in the form of faster incident detection and more effective response. TMCs can dispatch appropriate resources more quickly and clear the scene more effectively if they have a better understanding of the type of incident and its severity. In addition to improvements in incident clearance time, automated information exchange reduces the burden of communication workload and increases situational awareness. However, CAD data comes with many challenges. Most of the time, these systems were not developed to support transportation operations. This means that when adapted to share information with TMCs, there are several challenges:
Use Cases for CAD DataUse Case: California Highway Patrol Computer Aided Dispatch Data for Public Consumption. CHP is generally the first to become aware of incidents on major California highways through 911 calls. In an effort to keep the general public informed about congestion in major metropolitan areas, media outlets always look for the fastest and most reliable source of incident information. This resulted in CHP receiving a high volume of calls from media, and even their DOT partners, requesting information about current conditions and incidents. CHP found that the amount of time and effort expended on responding to these calls and requests was significant and was impacting the agency's ability to accomplish its primary mission of responding to and clearing incidents. CHP took a bold step to solve this problem by creating an XML data feed of all their transportation-related CAD data, except confidential information, and publishing it for public consumption. These data included detailed text about each and every publicly viewable incident. This means that anyone interested could obtain access to data and do whatever they wanted with it. Initially, some feared that this would result in major liability issues. Instead, the incoming call volume to CHP reduced significantly and resulted in lower cost and better focus on incident response. While the information in the XML feed was detailed, much of it was in the form of free text fields, making automated integration somewhat difficult. Nevertheless, availability of this information is invaluable for media, the public, and DOT partners looking for better situational awareness. Use Case: Virginia Department of Transportation Realtime Traffic Incident Management Information System. VDOT was interested in improving safety and mobility by sharing existing information currently available to VDOT with its partner public safety agencies. To break down information and communication silos, VDOT worked with their partners to develop a realtime data sharing system, illustrated in figure 54, using automated data extraction and filtering that limited the impact to operators' workload.  © California Highway Patrol. Figure 53. Screenshot. California Highway Patrol computer-aided dispatch log example. Source: California Highway Patrol public data feed (http://cad.chp.ca.gov/Traffic.aspx). The Realtime Traffic Incident Management Information System (RTIMIS) collects data from the CAD system and transmits it via secure connection to the integration partners, including VDOT TMC operators. This integration provided a 34-percent reduction in clearance time across 67 miles of I-95 by making TMC operators aware of incidents more quickly than before.15 In addition to clearance time reduction, RTIMIS CAD integration reduced communication workload as well as improved general situational awareness. VDOT found that CAD and TMC operators often have different goals, which impacts the quality of data being exchanged. For example, information that TMC operators may consider critical may not be important to CAD operators, so they may not enter it as frequently. Similarly, CAD systems use free text fields and shorthand that makes it very difficult to automate integration of valuable CAD data. Use Case: Florida Highway Patrol and SunGuide Integration. The FDOT ATMS platform, SunGuide, receives a filtered realtime CAD data feed. Through this integration, FDOT has seen a reduction in incident verification, response, management, and clearance time. FDOT operators become aware of incidents more quickly using CAD data and can evaluate incident severity and impact and dispatch appropriate field units and towing units more quickly. In addition to quantifiable improvements in incident response, the Florida Highway Patrol dispatchers have experienced a reduction in their workload as they do not have to take extra steps to notify their FDOT counterparts when requiring traffic incident management support. FDOT CAD integration is read-only with operators having the ability to dismiss alerts, create new events based on the alert, or associate an existing event to an incoming CAD event.  Figure 54. Virginia Department of Transportation Realtime Traffic Incident Management Information System high-level architecture diagram. Source: Virginia Department of Transportation, Realtime Traffic Incident Management Information System Presentation, April 23 & 24, 2018. Available at: https://i95coalition.org/wp-content/uploads/2018/06/3-I95CC-CAD-Workshop-Virginia-Presentation-Apr2018.pdf?x70560. 1 Eric Lipton, "U.S. System for Tracking Traffic Flow Is Faulted," New York Times, December 13, 2009. Available at https://www.nytimes.com/2009/12/14/us/14traffic.html, last accessed March 17, 2019. [ Return to note 1. ] 2 I-95 Corridor Coalition, Closing the Realtime Data Gaps Using Crowdsourced Waze Event Data. Unpublished technical report. [ Return to note 2. ] 3 Table 6 displays only select States for which the CATT Lab had access to both DOT ATMS and Waze data. [ Return to note 3. ] 4 Wazeopedia, "Realtime closures." Available at: https://wazeopedia.waze.com/wiki/USA/Real_time_closures, last accessed March 17, 2019. [ Return to note 4. ] 5 Wazeopedia, "Realtime closures." Available at https://wazeopedia.waze.com/wiki/USA/Real_time_closures#edit_the_closed_segment, last accessed March 18, 2019. [ Return to note 5. ] 6 For more information about BSM Part 1 and 2, see US Department of Transportation Vehicle Based Data and Availability Presentation at: https://www.its.dot.gov/itspac/october2012/PDF/data_availability.pdf. [ Return to note 6. ] 7 For more details, see B. Cronin, "Vehicle Based Data and Availability," presentation (n.d.). Intelligent Transportation Systems Joint Program Office, Research and Innovative Technology Administration, USDOT. Available at: https://www.its.dot.gov/itspac/october2012/PDF/data_availability.pdf [ Return to note 7. ] 8 For more information, see https://www.here.com/en/products-services/here-automotive-suite/connected-vehicle-services/here-road-signs. [ Return to note 8. ] 9 For more information, see https://geospatial.trimble.com/products-and-solutions/laser-scanning-solutions. [ Return to note 9. ] 10 Radio frequency identification uses electromagnetic or electrostatic coupling in the radio frequency portion of the electromagnetic spectrum to uniquely identify an object, animal, or person. This technology can be used to automatically identify and track tags attached to objects, such as cards. [ Return to note 10. ] 11 For more information, visit the "Array of Things" web page at https://arrayofthings.github.io/. The Array of Things is a collaborative effort among scientists, universities, local government, and communities in Chicago to collect realtime data on the city's environment, infrastructure, and activity for research and public use. [ Return to note 11. ] 12 Zhirui Ye. 2009. Evaluation of the Utah DOT Weather Operations/RWIS Program on Traffic Operations. Iowa Department of Transportation: Ames, IA. Available at: https://westerntransportationinstitute.org/wp-content/uploads/2016/08/4W2324_UDOT_Phase_II_Report.pdf, last accessed March 18, 2019. [ Return to note 12. ] 13 Strong, C. and Shi, X. 2008. "Benefit–Cost Analysis of Weather Information for Winter Maintenance: A Case Study," Transportation Research Record: Journal of the Transportation Research Board 2055: 119-127. [ Return to note 13. ] 14 Federal Highway Administration, Road Weather Management Best Practices. [ Return to note 14. ] 15 Virginia Department of Transportation, Realtime Traffic Incident Management Information System Presentation, April 23 – 24, 2018. Available at: http://i95coalition.org/wp-content/uploads/2018/06/3-I95CC-CAD-Workshop-Virginia-Presentation-Apr2018.pdf?x70560. [ Return to note 15. ] | |||||||||||||||||||||||||||||||||||||||||||||||||||||||||||||||||||||||||||||||||||||||||||||||||||||||||||||||||||||||||||||||||||||||||||||||||||||||||||||||||||||||||||||||||||||||||||||||||||||||||||||||||||||||||||||||||||||||||||||||||||||||||||||||||||||||||||||||||||||||||||||||||||||||||||||||||||||||||||||||||||||||||||||||||||||||||||||||
|
United States Department of Transportation - Federal Highway Administration |
||