Office of Operations
21st Century Operations Using 21st Century Technologies

Automated Traffic Signal Performance Measures Case Studies:
Pennsylvania Department of Transportation

Printable Version [PDF, 677KB]
You may need the Adobe® Reader® to view the PDFs on this page.
Contact Information: Operations Feedback at OperationsFeedback@dot.gov

United States Department of Transportation Federal Highway Administration

U.S. Department of Transportation
Federal Highway Administration
Office of Operations
1200 New Jersey Avenue, SE
Washington, DC 20590

FHWA-HOP-18-054

September 2018


PENNDOT TRAFFIC SIGNAL PROGRAM OVERVIEW

4 traffic signal employees; 14,000 traffic signals; 40,000 miles of roadway; $28M traffic signal program budget.

TRAFFIC SIGNAL SYSTEMS CAPABILITY MATURITY SELF ASSESSMENT

The Capability Maturity Model self-assessment framework contains six dimensions of capability. Three are process oriented:  1) Business Processes, 2) Systems and Technology, 3) Performance Measurement. The remaining three are institutional: 1) Organization and Workforce, 2) Culture, 3) Collaboration. With PennDOT, Business Processes, Systems and Technology, Performance Measurement, Organization and Workforce, Culture, and Collaboration fall in Level 3, which is Measured, Managed Risk.

Traffic Signal Systems Capability Maturity Self-Evaluation Tool: https://ops.fhwa.dot.gov/tsmoframeworktool/tool/tssc/

ATSPM CAPABILITY

The Pennsylvania Department of Transportation's (PennDOT) automated traffic signal performance measure (ATSPM) program is statewide in scale. PennDOT has implemented ATSPMs where high-resolution controllers and field communications are available. PennDOT's ATSPM system allows users to analyze the following performance metrics:

  • Approach delay
  • Approach speed
  • Approach volume
  • Arrivals on red
  • Coordination diagram
  • Pedestrian delay
  • Phase termination
  • Preemption details
  • Split failure
  • Split monitor
  • Turning movement counts

ATSPM IMPLEMENTATION

PennDOT's overall ATSPM goals include:

  • Reducing delay, emissions, and fuel consumption.
  • Reducing crashes and fatalities.
  • Focusing impacts on the economy and job creation.
  • Standardizing traffic signal equipment.
  • Establishing regional and multi-jurisdictional collaboration.

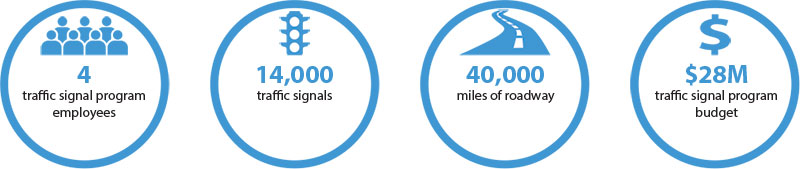
PennDOT uses open-source software developed by the Utah Department of Transportation for data storage and reporting. PennDOT uses a combination of modern signal controllers and vehicle detection systems to collect and archive high-resolution operational data with tenth-of-a-second timestamps. With communication from each signal to a central computer server, the data is stored and archived for analysis and reporting.

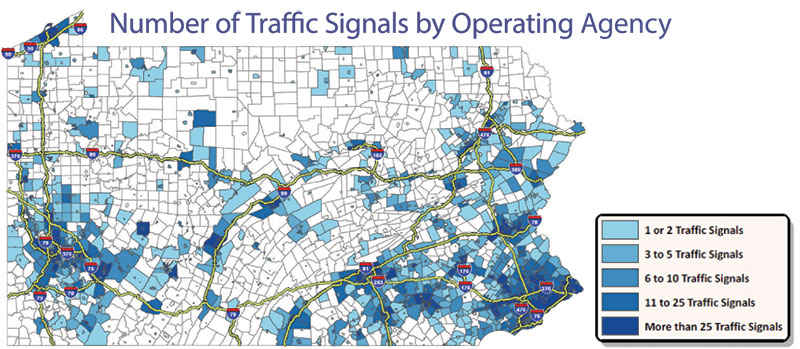
Future ATSPM plans include enhancement of PennDOT's unified statewide command and control software platform. The platform is needed because PennDOT connects with approximately 1,200 different signal owners and six different system software types, many of which are not compatible with newer systems. PennDOT's unified command and control integrates wide-ranging ATSPM inputs all in one platform.

Map showing the number of traffic signals by operating agency light blue- 1 or 2 traffic signals, corelian blue - 3 to 5, medium blue - 6 to 10, navy blue - 11 to 25, and dark blue - more than 25 signals.

Source: PennDOT, ATSPM Peer-to-Peer Presentation (January 23, 2018)

PennDOT is supplementing ATSPM to meet its delay, safety, emissions, economic, system standardization, and collaboration goals with corridor level probe data and performance management. Initial deployment of the probe data effort monitors 138 super-critical corridors, 2,184 traffic signals, and utilizes 776 arterial miles of INRIX data. Following initial deployment, PennDOT plans to expand implementation statewide and improve dashboard features. The probe data allows PennDOT to utilize the following tools:

  • Travel Time Comparison Tool: Compares travel time distributions on a single corridor over different time periods.
  • Arterial Ranking Tool: Ranks multiple corridors based on normalized median and interquartile travel times over the same time period.
  • Congestion Ticker: Tracks speeds of corridors over time to identify time periods and locations of congestion.

ADDITIONAL RESOURCES

For additional information please contact:
Eddie Curtis, FHWA Resource Center, 404-562-3920, Eddie.Curtis@dot.gov

EDC Logo

Every Day Counts (EDC), a State-based initiative of FHWA's Center for Accelerating Innovation, works with State, local, and private sector partners to encourage the adoption of proven technologies and innovations aimed at shortening and enhancing project delivery.

www.fhwa.dot.gov/innovation/everydaycounts/

Office of Operations