2017 Urban Congestion Trends
Measuring, Managing, and Improving Operations in the 21st Century
Printable version [PDF 5.6 MB]
You may need the Adobe® Reader® to view the PDFs on this page.
Contact Information: Operations Feedback at OperationsFeedback@dot.gov

U.S. Department of Transportation
Federal Highway Administration
Office of Operations
1200 New Jersey Avenue, SE
Washington, DC 20590
www.ops.fhwa.dot.gov
FHWA-HOP-18-025
April 2018
(left to right: Photo by Jim Lyle/TTI; Photo by Benoit Daoust/Shutterstock.com; Photo by Jim Lyle/TTI)
The Federal Highway Administration (FHWA) 2017 Urban Congestion Trends Report (UCR) provides the current state of congestion and reliability in 52 of the largest metropolitan areas in the United States. This report also highlights relevant successful operational strategies and performance management approaches implemented by state and local transportation agencies. The report concludes with a brief discussion of the new travel time-based performance measures that became effective May 20, 2017.
While this is the fourth year the National Performance Management Research Data Set (NPMRDS) has been used to calculate congestion and reliability metrics for the UCR, it is also the first year of a new contract with a new provider for travel time data (discussed more in-depth on page 4). The data set includes actual, observed travel times on the National Highway System (NHS) and is freely available for use by state departments of transportation (DOTs) and metropolitan planning organizations (MPOs) for their performance management activities. This report also documents a few examples from regional and local agencies using the NPMRDS for insights to better understand how their transportation system is operating.
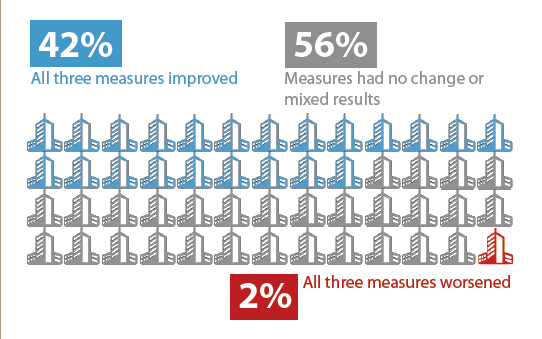
The graphic below provides 2016-to-2017 congestion trends from FHWA's UCR. Overall, congestion metrics have decreased from 2016 to 2017. The national congestion measures across all 52 metropolitan statistical areas included in the UCR are generally down from 2016 to 2017. Because the causes of congestion are varied and this year also includes a new data provider with a different method of collecting travel times, there are many things to consider when investigating this year's congestion trends. The focus of this report continues to be how operational improvements and strategies can help state and local agencies more effectively and efficiently address congestion growth.
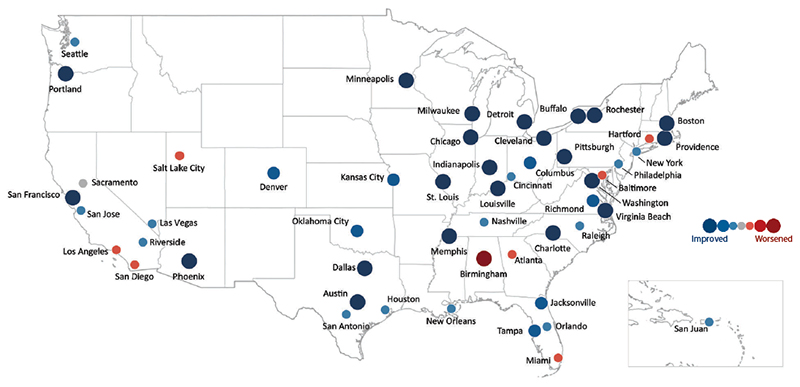
Urban Congestion Trends
Year-to-Year Congestion Trends in the United States (2016 to 2017)
NOTES
The results in this map are annual congestion trends. Quarterly UCR data are available at https://ops.fhwa.dot.gov/perf_measurement/ucr/.
Each symbol ( ) represents 1 metropolitan statistical area.
Congestion Facts
- From 2016 to 2017, the congestion measures at the national level were down. Caution needs to be taken with the comparisons this year since there is a new data provider and methods for data collection are slightly different.
- Across the country, 42 percent (22) of the 52 reported-on Metropolitan Statistical Areas (MSA) improved in all three of the measures.
- Only one MSA deteriorated in all three of the congestion measures compared to the 2016 values.
- The time penalty for a trip in an average day (TTI) increased or remained the same in 52% (27) of the MSAs.
- Travel time on the worst day per month decreased in 98% (51) of the MSAs.
Congestion Measure Definitions
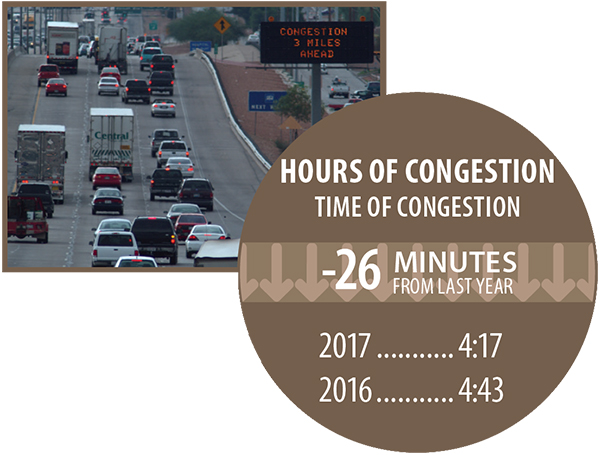
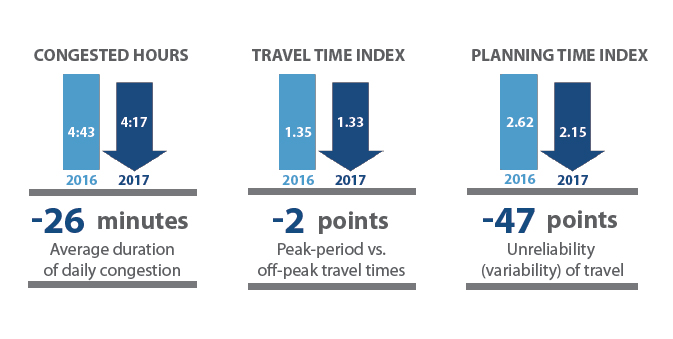
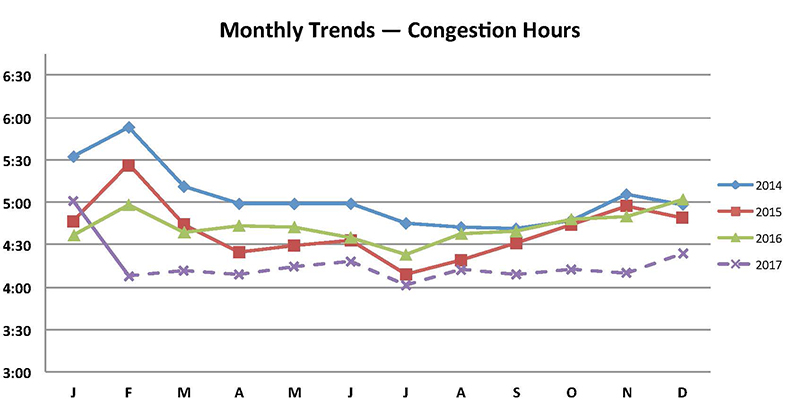
- Hours of Congestion—amount of time when freeways operate less than 90 percent of free-flow freeway speeds.
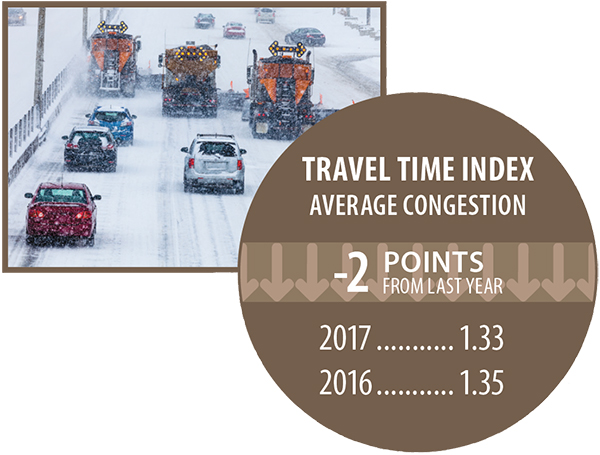
- Travel Time Index (TTI)—time penalty for a trip on an average day. A TTI of 1.30 indicates a 20-minute free-flow trip takes 26 minutes (20 × 1.30) in the rush hours.
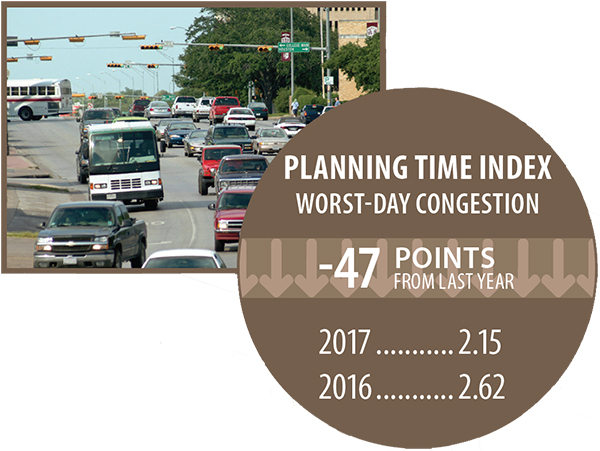
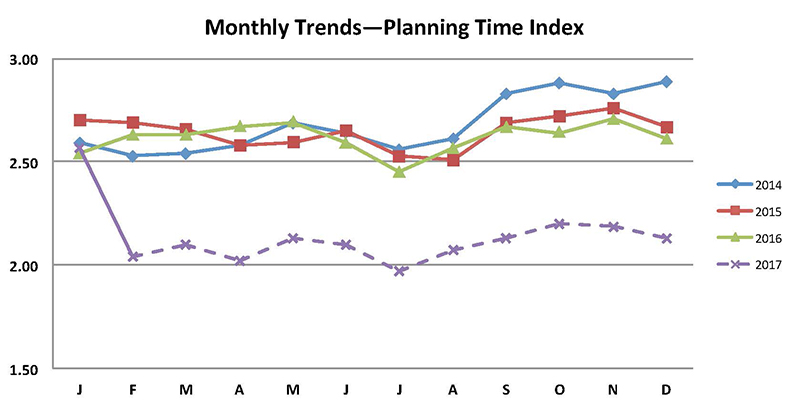
- Planning Time Index (PTI)—time penalty for a trip to be on time for 95 percent of trips (i.e., late for work on one day per month). A PTI of 1.60 indicates a 20-minute free-flow trip takes more than 32 minutes (20 × 1.60) one day per month.
Performance measures for 2017 use the most recent 2015 volume data, previous years used 2013 data. The dashed lines represent where the newest data were used.
Practical Applications of the NPMRDS
What Is the NPMRDS v2, and How Is It Different?
FHWA acquired the NPMRDS, an archived speed and travel time data set (including associated location referencing data) that covers the NHS and additional roadways near 26 key border crossings with Canada (20 crossings) and Mexico (six crossings).
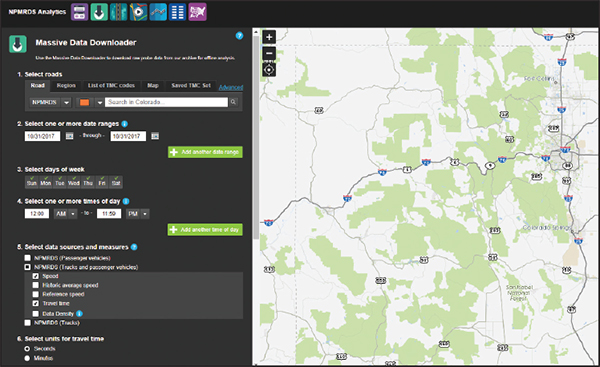
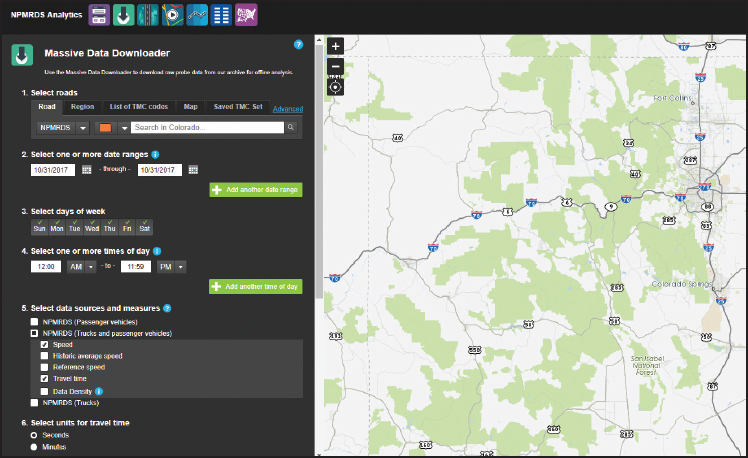
User interface for Massive Data Downloader on NPMRDS
The travel time portion of NPMRDS is updated each month. Three data sets are available that include speeds and travel times at 5 minute intervals on over 400,000 road segments for: passenger vehicles, trucks, and trucks and passenger vehicles combined. FHWA has made the data set available, at no cost, to State DOTs and MPOs to facilitate the application and use of performance measures. Travel time data is provided monthly.
The University of Maryland Center for Advanced Transportation Technology (CATT) Lab hosts the latest version of NPMRDS on its Regional Integrated Transportation Information System (RITIS) platform at npmrds.ritis.org, making the data available to download at user- defined geographies and temporal resolutions.
The NPMRDS data set is still based on actual reported vehicle data, exclusively — no imputation is included.
The NPMRDS v2 data set from February 2017 onward has several different features than the prior data set like path processing rather than point processing, increased completeness, and additional data fields. Some of the additions are listed below, including:
- "Data Density" indicator for each data set (passenger, truck, and combined), specifying the number of reporting vehicles (probes) contributing to the speed and travel time record: A = 1 to 4 reporting vehicles, B = 5 to 9 reporting vehicles, C = 10 or more reporting vehicles.
- Separate travel times on internal and external Traffic Message Channel (TMC) paths.
- Faster availability: new data available within five business days after the end of each month.
- Greater coverage with data completeness commitments.
- 14 HPMS attributes (including volume) conflated to the TMC network.
For more information:
Email: npmrds@ritis.org
https://npmrds.ritis.org/analytics/
THE NPMRDS IN ACTION
Nevada Department of Transportation
The Nevada DOT, as a part of their 2016 Performance Management Report, included metrics to "Reduce and Maintain Traffic Congestion on State Maintained Roads." Currently the two measures recorded are:
- Percent of Nevada interstate system mileage providing for reliable travel time.
- Percent of Nevada non-interstate NHS roads providing for reliable travel time.
These measures have an annual target of 90 percent with an ultimate target of 97 percent. Within NDOT, the Chief, Performance Analysis Engineer and Chief of Traffic Operations are the champions of these measures.
These measures indicate department performance and reach to the core of NDOT's central mission of providing a better transportation system for Nevada. The National Performance Measurement Research Data Set (NPMRDS) was used to track and measure performance of NDOT's interstate and non-interstate NHS roadway systems. Based on the analysis using calendar year 2015 data, 1,182 out of 1,234 interstate lane miles tracked provided for reliable travel times translating to 95.8 percent. Also, 3,547 out of 3,854 miles of non-interstate NHS roads tracked provided for reliable travel time equating to 92 percent.
For more information:
Peter Aiyuk, paiyuk@dot.state.nv.us
https://www.nevadadot.com/home/showdocument?id=6450
Maricopa Association of Governments, Phoenix, AZ
The Maricopa Association of Governments (MAG) is a council of governments that serves as the regional planning agency for the metropolitan Phoenix area. MAG researchers recently completed a three-year bottleneck study in the Phoenix area. A component of this research was an analytics and visualization tool that used NPMRDS travel time data to calculate and display locations and magnitude of the delay caused by the bottlenecks.
The site also has an interactive chart and map that allows users to view results for directional routes in various locations in their selected area of interest. In addition to the visual component, there is summary section to view data by hour and days of the week for time series analysis.
For more information:
Wang Zhang, wzhang@azmag.gov
http://bottleneckstudy.azmag.gov/
Operational Improvement Evaluations—Using Technology to Improve Operations
The evaluations that follow highlight innovative ways that agencies throughout the United States have improved performance through effective operations.
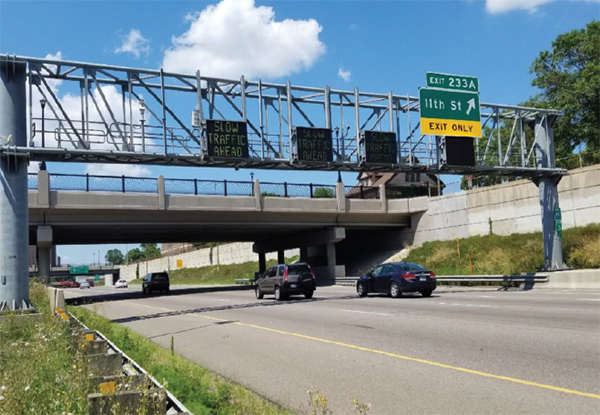
Active Traffic Management Queue Warning — Minnesota Department of Transportation
Active Traffic Management Queue Warning
ATM queue warning produced positive operational and safety benefits.
(Benefits: reduced congestion, increased safety).
The Investment
To reduce congestion and improve safety, MnDOT has deployed active traffic management (ATM) technology on two highways in the Twin Cities freeway network. The ATM system incorporates intelligent lane control signals (ILCS) placed over selected lanes at half-mile increments to warn motorists of incidents or hazards ahead. With advanced warning, drivers can slow down and possibly avoid crashes. Overhead, real-time electronic messages that warn of queuing conditions ahead can prepare motorists to reduce speed and avoid potential rear-end collisions. Such messages have the added benefit of improving mobility since fewer crashes will improve traffic flow.
The Return
The data collected show that warning messages delivered by the ATM system can be effective in alerting drivers to queuing conditions. Data recorded at the I-35W location revealed that:
- Messages delivered by the ILCS system helped drivers maintain a steady speed and eliminate stop-and-go travel.
- Some drivers did not always heed the first queue warning message to decrease speed, but they did slow down farther along the roadway.
Source: MnDOT
For More Information:
Deb Fick, Minnesota DOT, deb.fick@state.mn.us
http://www.dot.state.mn.us/research/TS/2017/201720TS.pdf
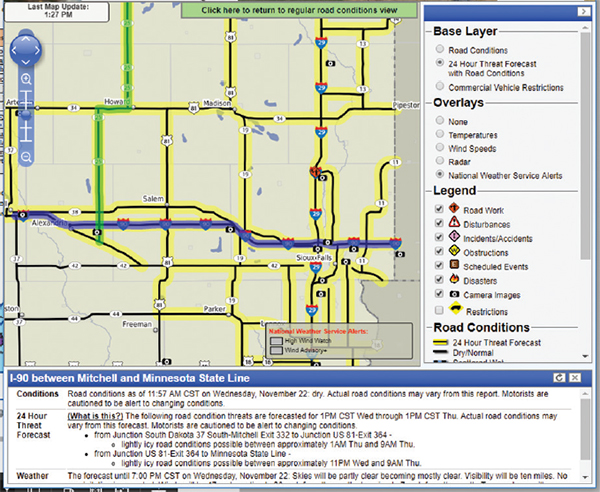
Responsive AND Predictive Weather Traffic Management — South Dakota DOT
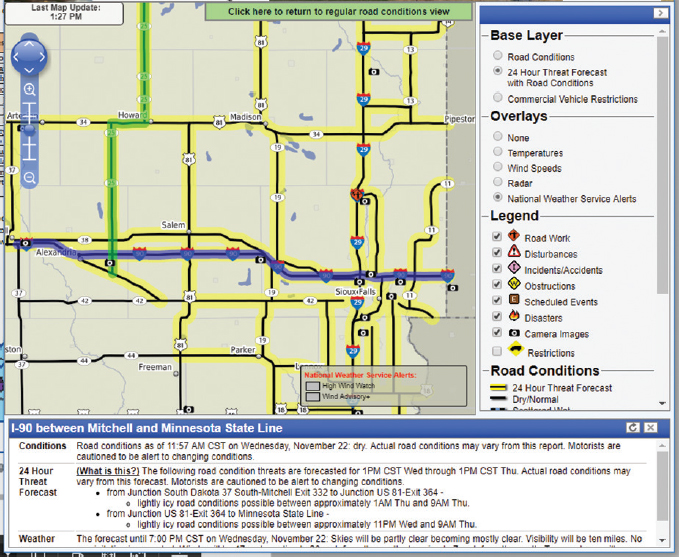
Weather-Responsive Traffic Management
Accuracy of field information was substantially improved along with the effectiveness and efficiency of reporting road conditions.
(Benefits: reduced delay, increased reporting, and improved safety).
The Investment
The FHWA Road Weather Management Program (RWMP) partnered with the South Dakota DOT to develop and implement a Weather Responsive Traffic Management (WRTM) strategy that involves traveler information dissemination during weather events. Part of the project focused on providing motorists new road condition information and 24-hour road condition forecasts to the public through their traveler information systems.
The Return
The study improved and expanded road weather information provided to travelers. Based on an internet survey of travelers in South Dakota, 80 to 87 percent of the respondents found the information "quite" or "very" useful. This was evidenced by additional responses on how they used the information:
- 60 percent changed the timing of their travel.
- 53 percent changed the routing of their travel.
- 76 percent felt more prepared for their upcoming travel.
Source: SafeTravel USA
For More Information:
http://www.itsbenefits.its.dot.gov/ITS/benecost.nsf/SummID/B2016-01109?OpenDocument&Query=Home
Reversible/Flex Lanes – Utah DOT
Intelligent Transportation Systems
Congestion management tool for AM and PM peak period travel time reductions.
(Benefits: reduced delay and emission toxins, saved money).
The Investment
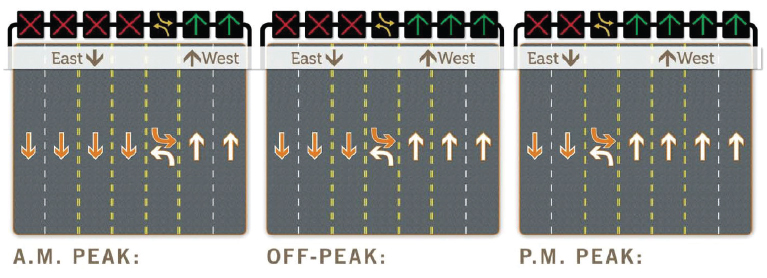
In 2012, the Utah Department of Transportation (UDOT) installed its first flex lane project on 5400 South in Taylorsville, Utah. Flex lanes (also called reversible lanes) are a congestion management tool used to accommodate heavy traffic by changing the direction of one or more lanes during peak hours. This strategy is most effective when there is traffic congestion in one direction during peak travel times.
The section of 5400 South carries about 40,000 vehicles per day. By switching the direction of traffic of one of the lanes during peak hours, UDOT saw improvements in traffic flow. The flex lane project allowed four eastbound lanes, a left turn lane, and two westbound lanes during the morning rush hour. During the evening peak, four westbound lanes, a left turn lane, and two eastbound lanes are provided. During all other times, there are three lanes in each direction.
The Return
The before and after study of the flex lanes indicates an overall benefit. During the AM and PM peak periods in the peak directions, travel times were reduced by 45 seconds and 50 seconds, respectively. Using the travel time savings, researchers estimated that the flex lanes could save users a total of $792,000 per year and reduce emission toxins by 1.24 tons per year.
For More Information:
Utah Department of Transportation
http://digitallibrary.utah.gov/awweb/awarchive?type=file&item=31414
SMART SCALE – Virginia
Responsible Funding
Funding prioritization based on an objective, outcome-based process.
(Benefits: accountability, transparency, improved stability).
The Investment
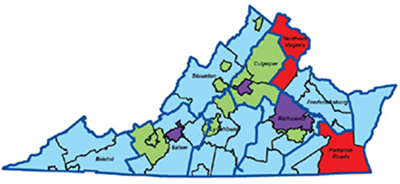
Virginia's SMART SCALE is about picking the right transportation projects for funding and ensuring the best use of limited tax dollars. Once it has been determined that a project meets an identified need, the project is evaluated and scored. SMART SCALE utilizes evaluation measures in six factor areas, detailed in the table below. Four area category weighting typologies were established based on the region. The weighting category regions are shown on the map.
The Return
Once projects are scored and prioritized, the Commonwealth Transportation Board (CTB) has the best information possible to select the right projects for funding. Selected projects and details on those projects are accessible on a SMART SCALE dashboard website.
| Factor Area |
Measure |
Cat. A |
Cat. B |
Cat. C |
Cat. D |
| Safety |
Number of Fatal and Injury Crashes (50%) |
5% |
20% |
25% |
30% |
| Rate of Fatal and Injury Crashes (50%) |
| Congestion Mitigation |
Person Throughput (50%) |
45% |
15% |
15% |
10% |
| Person Hours of Delay (50%) |
| Accessibility |
Access to Jobs (60%) |
15% |
25% |
25% |
15% |
| Access to Jobs for Disadvantaged Persons (20%) |
| Access to Multimodal Choices (20%) |
| Environmental Quality |
Air Quality and Environmental Effect (50%) |
10% |
10% |
10% |
10% |
| Impact to Natural and Cultural Resources (50%) |
| Economic Development |
Project Support for Economic Development (60%) |
5% |
20% |
25% |
35% |
| Intermodal Access and Efficiency (20%) |
| Travel Time Reliability (20%) |
| Land Use |
Transportation-Efficient Land Use (100%) |
20% |
10% |
- |
- |
For More Information:
http://www.vasmartscale.org/default.asp
Performance Management and Operations
MAP-21 PM3
FHWA finalized six interrelated performance rulemakings to implement the transportation performance management framework established by the Moving Ahead for Progress in the 21st Century Act and the Fixing America's Surface Transportation Act.
Collectively, the rules address challenges facing the U.S. transportation system. The rules establish national performance measures; DOTs and MPOs establish targets for applicable measures. New and existing plans will document the strategies and investments used to achieve the targets; progress toward the targets will be reported through new and existing mechanisms. Measures related to Urban Congestion include System Reliability, Freight Reliability, and Traffic Congestion (under the Congestion and Air Quality Improvement Program (CMAQ).
Reliability: Level of Travel Time Reliability is defined as the ratio of the longer travel times (80th percentile) to a normal travel time (50th percentile), using data from FHWA's NPMRDS or equivalent. The measures are the percent of person-miles traveled on the relevant portion of the NHS that are reliable. Person-miles take into account the users of the NHS. Data to reflect the users can include bus, auto, and truck occupancy levels.

Freight Reliability: Freight movement will be assessed by the Truck Travel Time Reliability (TTTR) Index. Reporting is divided into five periods: morning peak, midday, and afternoon peak Mondays through Fridays; weekends (6 a.m.–8 p.m.); and overnights for all days. The TTTR ratio will be generated by dividing the 95th percentile time by the normal time (50th percentile) for each segment. The TTTR Index will be generated by multiplying each segment's largest ratio of the five periods by its length, then dividing the sum of all length-weighted segments by the total length of Interstate.
CMAQ Traffic Congestion: Traffic congestion will be measured by the annual hours of Peak Hour Excessive Delay per capita on the NHS. The threshold for excessive delay will be based on the travel time at 20 mph or 60 percent of the posted speed limit travel time, whichever is greater, and will be measured in 15-minute intervals. The total excessive delay metric will be weighted by vehicle volumes and occupancy.
For more information:
https://www.fhwa.dot.gov/tpm/rule.cfm
Contact Information
For more information on this report, contact Rich Taylor (Rich.Taylor@dot.gov).
Visit the Operations Performance Measurement Program Urban Congestion Reports Web page for quarterly congestion trend updates:
ops.fhwa.dot.gov/perf_measurement/ucr/index.htm.