Recurring Traffic Bottlenecks: A Primer
Focus on Low-Cost Operational Improvements (Fourth Edition)
Chapter 2. Understanding Bottlenecks
What Exactly is a "Traffic Bottleneck?"
"A localized section of highway that experiences reduced speeds and inherent delays due to a recurring operational influence or a nonrecurring impacting event."
The definition above is the Federal Highway Administration (FHWA) Localized Bottleneck Reduction (LBR) program definition, but numerous agencies and academia have developed their own definitions. Some involve terms, like "less than free flow speeds." Others involve academic equations like "Volume-to-Capacity (V/C) >1" or something called the "congestion index," which is a mathematical proportion involving the percent of time less than a certain metric (like half the posted speed) versus what would be the free flow speed. Regardless of the derivation, it doesn't take too much explanation for a layperson to understand terms like "clogged," "delayed," "gridlock," or "stop-and-go." It's all congestion when one is in bumper-to-bumper traffic, and it may be recurring (the focus of this program) or nonrecurring.
Webster's Dictionary defines a "bottleneck" as: 1) a narrow or obstructed portion of a highway or pipeline; or 2) a hindrance to production or progress. Certainly the elemental characteristics of traffic bottlenecks exist in these descriptions. However, a road does not necessarily have to "narrow" for a traffic bottleneck to exist (e.g., bottlenecks caused by a weave condition, sun glare, or a vertical climb). Bottlenecks have a myriad of causes. The most egregious ones tend to be freeway-to-freeway interchanges, but we all know that smaller, lesser chokepoints are frustrating too. Bottlenecks can be areas where traffic is merging, diverging, or weaving—or where other physical restrictions exist like narrow lanes, lack of shoulders, steep grades, and sharp curves. Figure 1 describes some of the most common types of localized bottlenecks and gives a sense of the range of causes behind these frustrating chokepoints.
The focus of this Primer is on recurring congestion.
Recurring Congestion—When too many vehicles compete along all segments of a facility, "congestion" will inevitably result. This is often an overarching problem and is termed "systemic" congestion. But when determinant, subordinate segments of that facility (e.g., ramps, lane drops, merges, etc.) are routinely overtaxed (e.g., during peak hours) but otherwise revert to nominal levels the rest of the day, then "operationally recurring bottlenecks" within the facility are said to exist during those peak hours. When the over-demand clears (recedes from the back), the congestion clears.
Nonrecurring Congestion—Nonrecurring congestion means event-based disruptions, including crashes, stalled vehicles, weather events, special events, and work zones. Nonrecurring congestion is temporary in nature, and can affect just about any part of the highway system, unlike physical bottlenecks which are due to localized issues and occur at fixed locations.
Congestion has been characterized as being either recurring or nonrecurring for many years. However, it is more useful to attribute congestion to the specific sources: physical capacity, traffic variability, special events, incidents, inclement weather, work zones, and inefficient traffic control. Understanding how each of these seven sources contribute to total congestion and unreliable travel is key to crafting effective mitigation strategies. In high traffic volume urban areas, bottlenecks can contribute a large share of total congestion—in many locations they activate just about every weekday. Conversely, in lower volume rural areas, just about any congestion that appears is due to disruptive events such as incidents, weather, and work zones.
Figure 1. Chart. Common locations for localized bottlenecks.
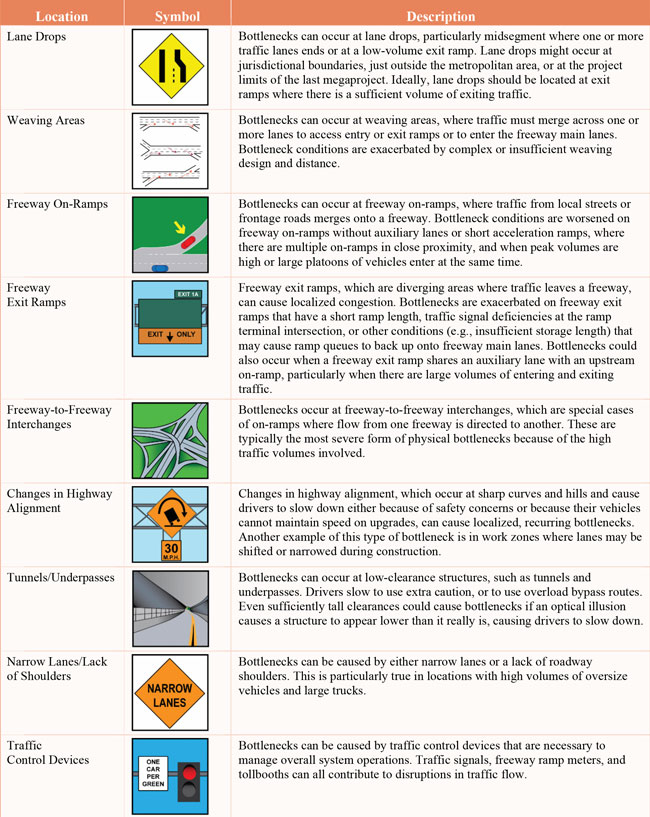
(Source: Federal Highway Administration.)
Working within the Right-of-Way to Fix Bottlenecks:
Maryland's I‑270 Upgrade Project
Faced with severe congestion in the I‑270 corridor in suburban Washington, D.C., the Maryland State Highway Agency (SHA) was under pressure to alleviate it. But the corridor already was extensively built, with four to five general purpose lanes in each direction coupled with high occupancy vehicle (HOV) lanes and development encroaching on the edge of the right-of-way. The solution: work within the right-of-way to the fullest extent using a combination of low-cost bottleneck treatments and advanced traffic technology. SHA's plan identifies specific bottleneck areas in the corridor, which occur mostly around local interchanges as well as the system interchange at the Capital Beltway (I‑495). To address these bottlenecks, several design treatments are being used including adding auxiliary lanes between on- and off-ramps and converting the shoulder to an HOV lane. Ramp meters will also be installed throughout the corridor and they will be operating "adaptively"—meaning algorithms will determine the most efficient timing based on conditions throughout the system, not at a single ramp location.
Figure 2. Infographic. Overview of Maryland's I‑270 Upgrade Project.
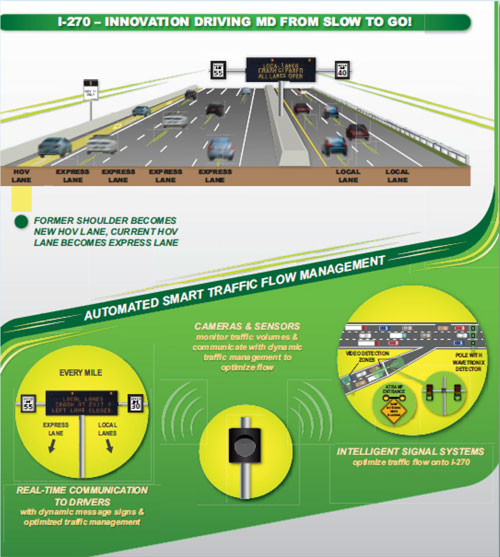
(Source: Maryland State Highway Administration.)
How Are Bottlenecks Monitored and Measured?
Two academic measures of congestion provide an important way to monitor and measure bottlenecks—"Travel Time Index" (TTI) and "Planning Time Index" (PTI). TTI is a measure of the buffer time (i.e., the additional time) that one should plan for a trip taken during peak periods.
Technically speaking, TTI is the ratio of the actual travel time divided by the travel time under free flow conditions. A TTI of 1.2 means that motorists, on average, are taking 20 percent longer for "that" trip than they would under free flow conditions.
PTI is measure travel time reliability. It is the total time one should plan for a trip taken during peak periods to ensure on-time arrival 95I percent of the time. PTI tells us how travel times for the same trip vary from day to day (i.e., against the worst day) because of disruptions like recurring congestion, incidents, bad weather, and work zones. A PTI of 2.20 means that for a 30 minute trip with "no" traffic, one should plan on 66 minutes during one's commute in order to arrive on time or better 95 percent of the time. If today it only takes you 59 minutes, you've come out ahead!
The quarterly FHWA Urban Congestion Reports employ these measures to gauge drivers' on-road experience across the country. The fact that a trip takes longer under congested conditions is not a startling concept, but the purpose of these reports are to present an objective, data-driven comparison of how congestion is increasing, or in some cases receding, due to a constantly changing menu of causes and/or mitigation techniques. Performance and trend data like those presented in the Urban Congestion Reports will be a prerequisite as the highway transportation community moves towards adopting a performance management approach to selecting and funding projects. What is performance management? In a nutshell, it is monitoring the performance of the highway system in a variety of "goal areas," evaluating projects to see what has been successful—or not—and using that knowledge to plan for future improvements.
Methods for measuring bottlenecks, in turn, allows for the identification of priority bottlenecks to address with LBR strategies. A tabulation of the top 10 bottlenecks, compiled by INRIX in the National Traffic Scorecard 2016 Annual Report, is shown in Table 1. Their analysis uses raw data which comes from their historical traffic data warehouse along with discrete Global Positioning System (GPS) enabled probe vehicle reports from vehicles traveling the nation's roads—including taxis, airport shuttles, service delivery vans, long-haul trucks, and consumer vehicles. FHWA's publication, Traffic Bottlenecks: Identification and Solutions, explored both advanced methods for analyzing bottlenecks and innovative bottleneck treatments (see Figure 3). Many sections of this primer refer to this study.
Table 1. The 10 worst physical bottlenecks in the United States.
| 2016 Rank |
Area |
Road/Direction |
Segment/Interchange |
Worst Peak Period |
Worst Peak Average Speed (mph) |
Total Hours of Delay |
| 1 |
New York, NY |
I‑95 Westbound |
From Exit 6A (I‑278) to Exit 2 (Trans-Manhattan Expressway) |
PM |
15.3 |
86 |
| 2 |
Chicago, IL |
I‑90 / I‑94 Northbound |
Exit 53A (I‑55) to Exit 34B |
AM |
20.2 |
85 |
| 3 |
New York, NY |
I‑95 Eastbound |
Exit 70A (I‑80) to Exit 7A (I‑695) |
AM |
30.2 |
76 |
| 4 |
Boston, MA |
I‑93 Northbound |
Exit 5A/MA-24 to Exit 16 (Southampton Street) |
AM |
27.1 |
72 |
| 5 |
Los Angeles, CA |
I‑10 Eastbound |
Exit 3A (I‑405) to Exit 12 (I‑110) |
PM |
27.0 |
66 |
| 6 |
Austin, TX |
I‑35 Southbound |
Airport Boulevard to East Slaughter Lane |
PM |
23.4 |
63 |
| 7 |
New York, NY |
5th Avenue Southbound |
120th Street to 40th Street |
PM |
6.8 |
61 |
| 8 |
New York, NY |
NJ-495 Eastbound |
I‑95 Junction to 12th Avenue (through Lincoln Tunnel) |
AM |
13.4 |
60 |
| 9 |
Philadelphia, PA |
I‑76 Southbound |
Exit 332/West Conshohocken to Exit 343/Spring Garden Street |
PM |
35.0 |
58 |
| 10 |
Chicago, IL |
1-90/I‑94 Southbound |
Exit 34B to Exit 50B/West Ohio Drive |
AM |
28.5 |
57 |
(Source: INRIX National Traffic Scorecard 2016.)
Understanding Merging at Recurring Bottlenecks
Since this primer focuses on localized, recurring bottlenecks (i.e., distinct areas of recurring congestion due to decision points such as on- and off-ramps, merge areas, weave areas, lane drops, tollbooth areas, and traffic areas; or design constraints such as curves, climbs, underpasses, and narrow or nonexistent shoulders), it is important to discuss the number one driving behavior that causes congestion to build at these areas—namely, merging and weaving. Are you a "profiteering" lane merger, who seeks only your own personal gain, or are you an "altruistic" driver who yields to others for the benefit of all? Are you an "early merger" (who merges upstream of the point of confluence) or "late merger" (who merges at the last possible moment)? Are you "left-brain" or "right-brain"; Republican or Democrat; paper or plastic? In the end, there is no right or wrong, legally speaking. When and how one merges is more a study in human behavior, and less a study in efficiency. While you can rest assured that much research has focused on merging and weaving, the problem remains, as you will see in the next section, that humans cannot deduce instruction to merge as well as computer traffic models would purport to smooth it for us!
Figure 3. Photo. Cover of Federal Highway Administration's Traffic Bottlenecks: Identification and Solutions report.
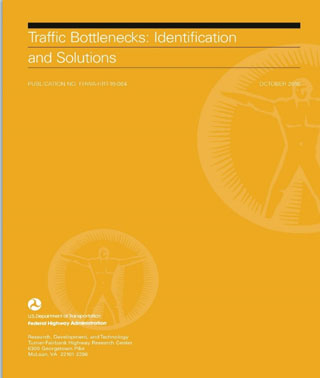
(Source: Federal Highway Administration.)
The Difference in Merging for Recurring and Nonrecurring Conditions
Merging maneuvers at recurring bottlenecks are essentially "cat herding" with implicit rules (often local in culture or habit) at best. Typically, not much guidance is given—everyone is on their own. In recurring situations, there is often only static signing (lane merge symbol, lane drop symbol, exit ahead sign, etc.) to inform the motorist that a situation is forthcoming. However, in a nonrecurring event like a crash or road construction, there is more likely to be advance warning and instruction in the form of orange cones, signs, flagmen, or police. One might argue "What's the difference? I'm in bumper-to-bumper traffic regardless!" The key difference is the greater potential in nonrecurring conditions for herding those cats.
Controlling the chaos of lane merging is fundamental to advanced traffic operations strategies, be it by signing, metering, or facility design. In nonrecurring situations the "dynamic lane merge" (DLM) is increasingly used where a crash or work zone has "stolen" a lane. The DLM essentially is a proactive assembly of variable message signs that turn on when traffic sensors upstream detect a sufficiently slow-speed "trigger" and then turn off when free flow speeds return. It works best in side-by-side merging at slow speeds but it can also benefit the slightly higher-speed approaches to backups. The signs operate in a proactive manner to alert and encourage motorists to "Merge Here" or "Begin to Merge" to minimize motorists coming to a full stop, thereby bringing all traffic behind them to stop as well, and it encourages motorists to keep moving through, and past, the "nozzle" that releases the merge. The DLM system is a step up from static signs that tend to lack relevance over time. Elsewise, at highway on-ramps, ramp metering has long been used to control the rate of merges and, ideally, prevent the breakdown of traffic flow on the mainline. Regardless, it remains difficult to control lane merging at bottlenecks. Ultimately, the most successful merges (in terms of least delay and/or moving the most vehicles through the nozzle) involve cooperation from all motorists (i.e., take your turn) and not the inefficient hunt-and-peck of human nature trying to game the system to one's own benefit. The following sections in this chapter give an overview of the evolving principles and approaches that agencies use to help herd those cats.
Merge Principles
How can we increase the efficiency of merging prior to the discharge point? In two words—be orderly. Not surprisingly, safety improves too. It is repeatedly shown that traffic is inherently safer when all vehicles are traveling at or near the same speed. Think of an orderly progression on a crowded escalator. Everyone is safely cocooned because they are going the same speed. Now imagine the bumping and chaos that would occur if/when impatient folks push past others. To help facilitate orderly merging, traffic experts have espoused two key merge principles, detailed below: 1) "go slow to go fast"; and 2) keep sufficient gaps.
Principle #1: "Go Slow to Go Fast"
"Go slow to go fast" is a seemingly paradoxical idea that, if we slow down the rate of our "mixing," we can get past a constriction faster. A well-known example (actually the winning entry in a 2006 contest to demonstrate the meaning of "throughput maximization") is the "rice experiment." In the first case, dry rice is poured all at once into a funnel. In the second case, the same amount is poured slowly. Repeated trials generally conclude about a one-third time savings to empty the funnel via the second method. And, it should be noted, there is a tipping point as one graduates from a v-e-r-y slow pour, to a medium pace, and so on. What lesson does the rice experiment teach us about traffic? The densely packed rice (or traffic) in the first trial creates friction in the literal sense and the practical sense, respectively. The denser the traffic, the smaller the safety cushion around each driver, and the more cautious (i.e., slower) each driver becomes. In the real world there exist some examples of validation of this principle. At intersections the slowing or stopping of some traffic (e.g., traffic signals, roundabouts, yields, and vehicle detection) benefits the aggregate flow, and is far better than the free-for-all converse. In the bottleneck and corridor genres, we have ramp metering and speed harmonization, respectively, providing examples on freeways.
Principle #2: Keep Sufficient Gaps, or, Defeating the "Phantom" Traffic Jam
Keeping sufficient (or ideally, the largest possible) gaps leads to uniform and free(er) traffic flow. Sufficient gaps (or "buffers" as they are also known) allow drivers to make small adjustments (e.g., braking, accelerating, or drifting) without creating a "ripple" effect where adjacent and following vehicles react by slowing. We don't have to tell you that the worst condition is the slow, bumper-to-bumper crawl wherein the smallest buffers are self-defeating. With only feet between cars, drivers are hesitant to (and effectively can't) get up to running speed until the car in front has moved a sufficient distance away. The same concept occurs when one is waiting at a traffic signal; the entire line doesn't surge ahead as one, rather, you must wait until the car in front of you (and the car in front of him) has moved sufficiently far away.
"Phantom" traffic jams on highways can occur seemingly out of nowhere. Why is it that even with moderate traffic, the speed ahead suddenly drops, with no apparent cause? A famous study asked drivers on a closed circular track to maintain an equal speed and two-car length spacing. This would seem to be an easy test for speed-regulated trams or even today's autonomous, driverless cars. Heck, we've even seen motorcycle daredevils in the circus spin inside closed domes without hitting each other, so how hard can it be? Turns out, very hard! Successive trials repeatedly failed as one-by-one, drivers would either intentionally or inadvertently speed up due to impatience, or slow down due to perceived biases on how fast the car in front of them was going. It only takes one driver breaking the chain to cause the car-following to brake, and that in turn causes the inevitable reverberation and rippling down the line, eventually leading to full stop-and-go. Then, because humans' reaction times vary, occasional larger gaps appear, only to have cars "chase" but then slow again so as not to overtake (i.e., hit) the car in front. This sinusoidal self-perpetuating "wave" pulses up and down a crowded traffic stream, eventually clearing only when gaps become so great again (or the volume thins) for everyone to mute the forward and rear buffers.
Gap maintenance (and thus, lane reliability) is achieved on-purpose in high occupancy vehicle (HOV) lanes or high occupancy toll (HOT) lanes—by selective admittance in the former, and by dynamically shifting the price every few minutes in the latter. The target benefit is to allow qualifying vehicles the guarantee of a free flow trip, versus the hit-or-miss prospect in the adjacent general purpose (GP) lanes. Both cases have the added (and intended) benefit of removing vehicles and or person-trips from the GP lanes too; so all traffic streams win when these practices are employed. Absent out-and-out violators who can muck up the system, agencies can tweak the lane mandates to keep the systems running at optimum levels. How does this apply to localized bottlenecks? Theoretically, the same "gapping" principles would hold true in backups; to wit, leaving progressively larger gaps would allow for progressively better progression. The point is that in congested situations the constant brake-tapping in bumper-to-bumper traffic works to self-perpetuate the problem. The ripple effects are short, abrupt, and inefficient. The obvious problem with the "keep sufficient gaps" principle, however, is that human nature simply won't allow for the patience and orderliness to make this work. The second that I create a sufficient gap between me and the car ahead, some "profiteering" lane jumper will fill it. Which is a nice segue into the next sections—the debate over early versus late merging and the growing popularity of the "zipper merge."
Which Is Best? "Early" or "Late" Merging?
Can a better recurring merge be developed? Merging takes place at-speed or "at-crawl." The former is most often associated with free flow on-ramp maneuvers, while the latter is most often associated with bumper-to-bumper congestion. In either condition the motorist has the additional choice to merge "early" (upstream) or "late" (at point of confluence). This creates a matrix of four possible merge conditions; 1) at-speed "early"; 2) at-speed "late"; 3) at-crawl "early"; and 4) at- crawl "late." To further complicate things, guidance concerning where, when, and how best to merge can vary from modest-to-no forewarnings in recurring conditions to fully deployed Traffic Control Plans (TCP) in nonrecurring conditions. Given that this primer is focused on the recurring bottleneck genre, the purpose of this section was to research if early or late merging was best for these non-controlled situations; i.e., when no active TCP exists.
Anecdotal evidence from many local traffic blogs and Internet searches finds strong sentiment from both camps as to why they think their method of merging is best. In the minds of many, early merging is the status quo, as merging early, well in advance of a lane closure, is seen as more courteous than zooming past a line of cars in order to merge late, immediately before a lane ends. However, proponents of late merging—now commonly called the "zipper merge"—have recently grown in number, with several State Departments of Transportation (DOT) endorsing the zipper merge at bottlenecks or work zones via videos, web pages, and roadside signs. The basic argument in favor of the zipper merge is that this maneuver allows drivers to occupy the full capacity of all available lanes, rather than forcing all drivers to queue up while the lane that is ending sits empty and unused beside them. In this way, the zipper merge both creates more capacity at the bottleneck and enforces order since drivers know exactly where to merge—immediately before the lane ends. It also sets up as a fairer method (e.g., "take turns"), but as we all have witnessed, not everyone plays by the ‘rules!' On the other hand, opponents of the zipper merge highlight that the zipper merge is not suitable or safe in all situations—specifically, in "early merge" higher-speed conditions, where the later zipper merge leaves less room for error.
Since speed differential in adjacent lanes is a recognized safety threat in nominal roadway operation, it follows that it is a danger in merging circumstances too. A car in the dropped lane suddenly slowing to a crawl or fully stopping next to a free-flowing lane is every bit as dangerous as that same car speeding up to force-fit into a lane of stop-and-go traffic. "Early merge" seems favored by the traffic engineering community when mainline speeds are nearest to free-flow. The car in the dropped lane should keep up speed and safely blend into generally larger gaps of the moving lane. "Late merge," (e.g., zippering) is generally seen as preferred when both lanes (mainline and dropped lane) are at stop-and-go and gaps are practically non-existent. Proponents opine that all available capacity of the closed lane can be filled up to the point of merge; it also seems to offer an "every other car" alternate fairness at the nozzle point. But these are not hard and fast guidelines or rules. Many States' drivers' manuals simply say "merge when it is safe" and leave it at that. Per our research, zippering, specifically, was not found to be a legislated precept on par with, say, seat belt laws or distracted driving laws. However, the fact that some State DOTs favor zippering to the point of promoting it (but only in stop-and-go work zones or similar) would seem reason enough to at least recognize it as a "practice" if not a mandate. Further detail on zipper merge research and applications is provided below.
The Zipper Merge—Research and Applications
Recently several State DOTs have begun promoting and enacting the zipper merge in specific circumstances—in particular, highway work zones. Often, these States have produced informational web pages or videos as part of their public outreach and education efforts for zipper merge applications. For instance, the Minnesota DOT, the Kansas DOT, and the Nebraska DOT all have zipper merge web pages with informational videos.
Other State DOTs have partnered with universities to conduct studies on the potential benefits of the zipper merge. Specifically, the North Carolina DOT has partnered with the North Carolina State Institute for Transportation Research and Education (ITRE) to study whether zippering can ease congestion, and has explored the implementation of a zipper merge sign. Likewise, the Virginia Transportation Research Council (the Virginia DOT and the University of Virginia, in cooperation with the FHWA) conducted a similar study in 2004 and the University of Nebraska published a 1999 study that is often cited which compares the Nebraska DOTs' traditional approach to merging to the zipper/late merge. (Pesti et al., Traffic Flow Characteristics of the Late Merge Work Zone Control Strategy, Transportation Research Record 1657, Paper No. 99-0925, 1999.)
While there is no definitive guidance for applying the zipper merge, these studies do offer insights into the potential benefits and applications of the zipper merge. The authors of the Virginia Transportation Research Council study concluded that the late/zipper merge should be considered for "3-to-1 lane closure configurations"—although not until a sound methodology for deployment has been tested in the field. The North Carolina DOT/ITRE study is not yet finalized, but researchers there have highlighted anecdotal findings such as a zipper merge site in Michigan where the congestion area was reduced from six miles to three miles.
Principles Put into Practice: Variable Speed Limits and Speed Harmonization
Variable speed limits (mostly applied in work zones; i.e., nonrecurring conditions) and the European concept of "speed harmonization" both intend to "harmonize" traffic by regulating speeds. In the latter case, a series of overhead gantries gradually adjust speeds through congested highway segments in order to flatten the sinusoidal effect of traffic speeds bouncing between open sections and interchanges. Speed harmonization is typically applied as the open highway approaches the denser central business district. A great expense is incurred by the cost of the overhead—spanned gantries, the necessary detectors, the interconnectivity, the operational overhead, and the sheer number of gantries required along the multi-kilometer corridor. Speed harmonization, however shows that "go slow" as a merging principle can be translated into an operational strategy to move more traffic through a congested highway segment. Several applications of speed harmonization exist throughout the United States. For example, the Minnesota DOT has deployed a variable speed limit system on I‑35W in Minneapolis in conjunction with a "priced dynamic shoulder lane" (PDSL).
Figure 4 shows a schematic of how the Minnesota DOT system operates. The features of this comprehensive system include:
- During off-peak hours the lanes are not tolled and are open to general traffic with the exception of northbound lanes from 42nd Street to downtown.
- Two-plus carpools, transit, and motorcycles travel toll free.
- The lanes are dynamically priced based on demand.
- PDSL operates as a priced lane during peak periods to maximize capacity on existing roadways.
- Electronic signs alert drivers whether the PDSL is open or closed.
- Variable speed limits are set in the adjacent non-tolled lanes.
Is Murphy Right? Does the Other Lane "Always Move Faster"?
How many times have you observed that "the other lane is moving faster" only to get into that lane and then watch your original lane move past you? Actually, you are at the whim of "observation selection bias" which essentially opines that one will selectively conclude a result on the basis of a distortion of data; in this case, your distorted sampling of only the cars that are moving, and less so the ones that aren't. So, does cutting in line help you?
Imagine two lanes of cars. The left lane (L) is the continuous lane and the right lane (R) is dropping. You are 6th in line in R lane. If everyone stays put and "zippers" then the zipper order is L, R, L, R, etc. Your neighbor to your left is 11th and you will be 12th to merge. If, however, you "early merge" and cut in front of him into the L line, then you will now be 11th to merge, the person behind you (formerly 14th) moves up to 12th, and your neighbor drops to 13th. You win. Your neighbor loses. But the guy behind you benefits most.
Now consider the same scenario except the zipper order is R, L, R, L, etc. In the orderly scenario you would be 11th and your neighbor is 12th. If you cut in front of him, the guy behind you moves up to 11, you are now 12th, and your neighbor is now 14th. Your neighbor really loses (drops two slots) and the guy behind you (formerly 13) really wins; he gains two spots—again.
Congratulations! In both scenarios you have definitely improved the slot for the guy behind you! You may or may not have improved your slot. And in either case, you made your neighbor mad! And in the end, all the jockeying you have done may have been canceled by someone ahead of you. So maybe it's better to leave Murphy's Law to "anything that can go wrong will" and let zippering be the fair and simple solution to traffic backups.
Figure 4. Simulation graphics. Typical Section of MN I‑35W Northbound Priced Dynamic Shoulder Lane (PDSL).
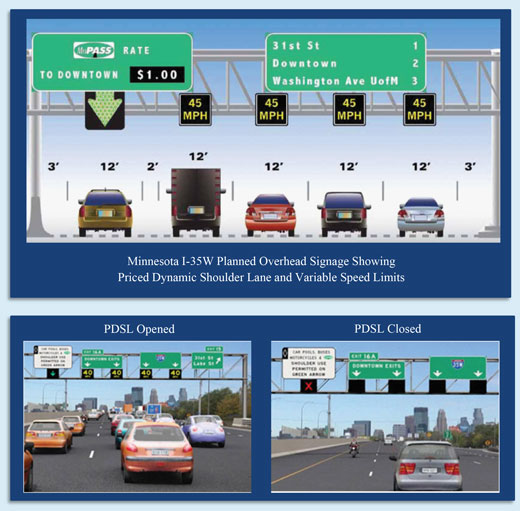
(Source: Minnesota Department of Transportation, Simulated Photos.)
You may need the Adobe® Reader® to view the PDFs on this page.