Maryland State Highway Administration Pilot of the Data Business Plan Guide for State and Local Departments of Transportation: Data Business Plan
Chapter 3. Data Definitions, Assessment, and Improvement Strategies
This section defines the data considered in the Data Business Plan (DBP); describes the results of a data assessment to identify issues related to the collection, management, governance, and use of mobility data at Maryland Department of Transportation (MDOT) State Highway Administration (SHA); and summarizes MDOT SHA's capability maturity level for each data type according to its use for planning or operations functions.
Data Definitions
The following section defines the mobility data in the context of the DBP. All data elements and measures can be reported for freight or automobile, freeway or arterial and are used for either planning and/or operations purposes. There is a "real time" versus "archived" aspect to the data. Note that all data pertains to demand of transportation services rather than supply.
Tier 1
Traffic Volume—Represents number of vehicles travelling on a certain facility of the transportation network. It represents the quantity dimension of mobility. It is expressed as number of vehicles during a certain timeframe. Performance indicators include Vehicle Miles Traveled (VMT) and Annual Average Daily Traffic (AADT). The measures may be expressed in terms of hourly, daily, peak period, weekly, monthly, annually, etc. They can be reported at a facility, network, or area wide level. The source is generally a combination of permanent and portable traffic count devices.
Traffic Speed—Represents the speed of travel on a facility or network. Can be expressed as average miles per hour and can easily be converted to travel time if the distance of travel is known. The source can be travel time runs or probe data such as provided by Inrix or HERE.
Tier 2
Origin/Destination—Generally referred to as flow data, characterizes the movement of people or goods within a transportation network, and is represented as the number of vehicles or people traversing from one zone to another. Traditionally, the collection method was by extensive surveys; however, newer technologies such as Bluetooth and probe data are starting to provide alternate sources.
Accessibility—Defined as the ease in engaging in activities or an ability to reach a desired destination, activities, good and services. Commonly used measures include time, distance, or cost to reach a destination; modal choices/alternatives; connectivity; and number of transfers. For the purposes of this effort, accessibility is defined as the number of jobs accessible through a particular mode (e.g., transit or highway) within a particular timeframe (e.g., 30 minutes). Sources usually include household travel surveys.
Truck Freight—Refers to the movement of goods using ground transportation. This includes tonnage, commodity flow, VMT, speed, and truck parking.
Work Zone—Includes lane closure and movement of vehicles through a work zone. It can be used in conjunction with volume and speed.
Signal Timing—Includes the following components:
- Inventory—Number and location of signals, system type, controller type, etc.
- Warehouse data—Timing at certain times and dates.
- Base timing plan—Queue, signal phase and timing.
Tier 3
Connected and Automated Vehicle—Includes data coming from connected and/or automated vehicles and the FHWA Research Data Exchange (RDE).
Data Assessment
MDOT SHA has access to multiple data sources and is interested in various mobility data initiatives. However, it has yet to articulate an overarching direction of where it wants to go with respect to mobility data management and governance. At the moment, data governance efforts are ad hoc, and the agency does not have a governance framework.
This section provides an assessment of MDOT SHA's current mobility data efforts. The discussion is organized by data type, ending with a list of items that are relevant to multiple data types. For each of the data elements, the following is described:
- Overview—Description of data/measures and current efforts underway.
- Assessment—Results of a data and gap assessment to identify issues related to the collection, management, governance, and use of mobility data in Maryland.
- Desired State—Discussion of desired status of data in the future, including coverage, timeliness, accessibility, and quality.
- Improvement/Action Strategies—Strategies that can be implemented to address challenges and reach a desired end state.
Traffic Volume
Overview
- Volume is collected at different levels, with higher-functional class roads having 1‑hour cycles and lower-functional class roads having 6-year cycles.
- All volume data is geospatially referenced.
- Maryland SHA is currently working with the Coordinated Highways Action Response Team (CHART) to obtain volume from their devices.
Assessment
- Volume data collection and management are at a fairly mature stage at Maryland SHA and satisfies existing business needs.
Desired State
- Desire to better optimize processes of data collection and processing.
Improvement/Action Strategies
- Receive and implement stakeholders' recommendations on how to optimize volume processes.
Traffic Speed
Overview
- Through the Vehicle Probe Project, Maryland SHA has access to Inrix, HERE, and TomTom probe speed data.
- Spot speed is also collected at Highway Performance Monitoring System (HPMS) sites.
- There are locations with Bluetooth readers.
- Agency also uses the National Performance Management Research Data Set (NPMRDS).
- CHART detectors have the potential to give speed, but they need to be set up and validated to do so.
Assessment
- While probe speed data has been successfully used to develop freeway mobility performance measures, it is still not reliable enough for arterials.
Desired State
- Desire to have lane differentiation for freeways (e.g., high-occupancy vehicle versus general purpose lanes).
- Desire to have probe data broken down by vehicle type. Even with NPMRDS, it categorizes various types of commercial vehicles under the passenger vehicle category.
- Desire to have a tool that generates time-space diagrams for arterials. The probe data is still not good for mobility reporting.
- CHART detectors have the potential to provide speed, but they need to be set up and validated to do so.
- Desire to have a tool that generates time-space diagrams.
Improvement/Action Strategies
- Explore the development of a task for vendors or consultants to generate speeds from probe speed data by vehicle type.
- Work with vendors to improve quality of arterial probe data for mobility reporting.
- Work with vendors to have lane differentiation of probe speed data.
- Determine if there is a need to have speed data from CHART detectors and, if so, when and how to set them up.
- Determine when and how to develop a tool that generates time-space diagrams.
Origin/Destination
Overview
- MDOT SHA is currently participating in a household travel survey—this will be a source of data.
- They have procured Inrix origin/destination (O/D) data (4-month sample with waypoints).
- They are exploring the use of StreetLight data.
- They are exploring to see if they can use Inrix or NPMRDS for O/D.
- The District of Columbia MPO has standards for household travel surveys based on its several decades' worth of experience.
- Maryland SHA has been exploring the new Inrix O/D data.
- Currently, O/D information is obtained from the statewide model, which is link based. The model looks at base versus build cases, and existing versus future scenarios.
- The statewide model produces two types of outputs—bandwidth and O/D zone (for AM/PM trips).
- The statewide model is being compared to StreetLight data.
- O/D data overlaps multiple and diverse data focus areas.
Assessment
- MDOT SHA is exploring Inrix vehicle probe data and still has to validate it.
- Oversize/overweight data is obtained through MDOT SHA's Permit System. It is sample data only but of good quality.
- The statewide model is validated based on survey data. It is useful for planning efforts but still needs more accuracy to be used for operations.
- American Transportation Research Institute (ATRI) Trip table and HERE O/D data are still in an initial exploratory phase.
Desired State
- Anticipating utilizing trip-based metrics—e.g., what does a long-distance trip look like?
- Goal for Inrix O/D data—Within three years, MDOT SHA staff expects processes to be in place for an entire year, all trips in and out of Maryland, and collecting raw data.
- Cross-validate the various data sources. Potentially use truck trip tables from ATRI for modeling.
- For StreetLight/Inrix data—Expects to review reports comparing broader traffic flows to support planning/operations, percentage of trucks, etc.
- The development of a Geographic Information System (GIS) layer to tie the data into the linear referencing system.
- Analyze the impact of an accident at O/D level. Currently, MDOT SHA can analyze the impact of accidents on travel time.
- Conflation issues with Traffic Message Channels (TMC)—It would be nice to have data from Inrix waypoint snapped to Inrix High Definition (XD) roadway segments.
Improvement/Action Strategies
- Discuss how to potentially get O/D of commodities.
- Collaborate with vendors to obtain necessary data for trip-based metrics.
- Join with vendors to obtain more granular O/D data.
- Work with Inrix to obtain O/D data for all trips in and out of Maryland for an entire year.
- Develop correlation between truck O/D and HPMS data.
- Determine how to analyze the impact of accidents for O/D.
- Have a smaller group convene to determine how to use new O/D data sources to decide on Transportation Systems Management and Operations (TSMO)/advanced traffic management strategies.
Accessibility
Overview
- Maryland is part of the University of Minnesota's pooled fund study to conduct accessibility measures.
- There is an accessibility analysis being conducted by ATRI.
Assessment
- Auto:
- Accessibility data for auto serves existing needs from a planning perspective.
- Freight:
- The ATRI data was purchased and used for one specific project, and they do not obtain freight data regularly. From a business planning perspective, obtaining freight data for performance measure development is a goal.
- Transit:
- They have a lot of headway and boarding information. It is a mature system, but SHA has not used the data.
- Pedestrian:
- Americans with Disability Act (ADA)/sidewalk shapefile layer.
- Tracks which side of the road the sidewalk is on, ADA compliance, etc.
- Does not have the capability to provide route(s) with complete sidewalk access.
- Log of pedestrian push button activation at traffic signals. Can be used to determine delay to pedestrians (assuming pedestrians push buttons).
- Bike:
- Multiple bike GIS layers exist, but SHA does not track where bikes travel.
- STRAVA application—currently, the sample data is not reliable, and it is also isolated.
- Potentially explore the Map My Ride application.
- Data governance:
- From a planning perspective, data governance is well set.
- Accessibility metrics are currently done on an ad hoc basis for a specific project(s) and does not have a formal structure.
- It would be helpful to develop accessibility in a map format.
- Would make sense to have a contact point at other agencies.
- Multimodal accessibility:
- Combine some of the individual accessibilities discussed above.
- Consider shared use mobility, bike share, etc.
Desired State
- Develop dashboard type measures with heat maps and other means to visualize accessibility.
- Maryland Department of Planning has existing accessibility data, which can be used to validate some models.
- Conduct an inventory check.
- Develop/estimate how fast users can reach major employers such as the National Institutes of Health, etc.
- Identify external points of contact regarding accessibility.
- Opportunity for private sector using granular O/D data for accessibility.
- Desire to account for multi-modal trips (e.g., walk, transit, walk).
Improvement/Action Strategies
- University of Maryland should make a recommendation on how to use O/D data for accessibility.
- Develop standards/structure to conduct accessibility metrics for projects.
- Develop/estimate how fast users can reach major employers such as the National Institutes of Health, etc.
- Develop dashboard to visualize accessibility.
- Discuss how to account for multi-modal trips.
- Address regional accessibility by engaging other agencies.
Truck Freight
Overview
- SHA started an ESRI Freight Storymap that would ensure freight data is available in the future. The short term goal is to release the tool in six to nine months. Tabs of the story page include infrastructure, asset management (pavement and bridges), inventory, and mobility/accessibility. The mobility tab will include congestion levels and travel time reliability (Planning Time Index and Travel Time Index). The story page is intended to capture high-level freight.
- Freight Initiative: SHA is coordinating with BMC and other agencies to document the different types of freight data available in the State. The long-term goal is to develop an application that makes the data available. However, many of these datasets are uploaded outside of SHA, with each having its own governance activities.
- The Regional Integrated Transportation Information System (RITIS) offers weigh-in-motion data, and there is an application called Maryland 1 (a real-time GIS page for truck drivers to gauge crashes and congestion).
- A lot of data is owned by other organizations outside of SHA.
- Need truck parking data.
- Most of the data available is ATRI data, which is used to calibrate/validate models.
- SHA is having a discussion on addressing needs for data.
Assessment
- Truck data:
- Using road tubes and automated traffic recorder stations, collect truck data for the 13 FHWA type classifications.
- Use of non-intrusive devices—a lot more work needs to be done; issues with length-based identification.
- Vehicle classification still needs improvement in accuracy.
- Virtual weigh-in-motion—aggressive program, accessible through RITIS, but SHA is not leveraging this data.
- Speed data:
- Obtained from NPMRDS, Vehicle Probe Project Suite.
- Vehicle Probe Project Suite processes missing data.
- Currently, there is no freight data for non-National Highway System (NHS) roadways.
- Maryland Freight Data Finder:
- Visual representation of State freight plan using ArcGIS.
- Displays other modes and assets (like bridges, signals, etc.)
- Being developed in phases and estimated completion in 2018.
- The DBP can help get the word out on this.
- State Freight Plan:
- Will be working on this in 2017.
- Have supply information but cannot keep up with demand.
Desired State
- Make definitions clear (e.g., class eight and above are buses classified as freight?).
- SHA should procure freight data on a regular basis for freight performance measures reporting.
- Collaborate with seven MPOs and the State Freight Advisory Committee (although they have not met in over a year).
- Need a business process to keep freight data robust.
- Would like to see O/D of commodities.
- Identify additional legal truck parking (illegal truck parking is a major issue).
- Would like to have truck O/D.
- Need improvement for truck parking data. SHA already provides a web-based tool for trucks to find emergency parking. They do annual counts of truck parking (since 2012 as part of MAP 21).
- Desire to know "what's in the truck." SHA is doing an online survey with trucking associations this year to determine what is being transported within Maryland (long-haul trips).
- Need to develop data governance for freight data.
Improvement/Action Strategies
- Look at four months of data to see if it is adequate (University of Maryland is already looking into this).
- Develop data collection standards.
- Explore ways to provide volume and speed for freight routes.
- Discuss how to improve commodity flow data.
- Discuss data needs to produce freight performance measures on a regular basis.
- Pursue if Inrix can provide truck probe data or percentage of trucks.
- Develop better system for vehicle classification.
- Develop tool to identify additional legal truck parking.
- Discuss how to improve truck parking data.
- Discuss how to better know "what's in the truck".
- Develop data governance for freight data.
- Clarify definitions of what counts as freight and what doesn't (e.g., buses).
- Develop a business process to keep freight data robust.
Work Zone
Overview
- Lane closure permitting is housed in CHART Emergency Operations Reporting System database. This data is used for informing people about permitting.
- Office of Traffic and Safety look at performance in real time.
- There is a Work Zone Dashboard that uses data from RITIS. One could get speed and user delay cost and average delay from the Dashboard. The Dashboard was intended to help construction area engineers better manage work zones, although it may need to be promoted so more people know about it and use it. Real time data is used to better determine when to close lanes. There is an archiving section of the Dashboard that could be used to plan for future programs (may not be fully utilized—consider as an action item).
- The Operations Office sees value in having more data for works zones to better plan for lane closures. Currently, there are policies that suggest closing lanes at a certain time of the day. However, actual data within work zones may indicate that closing at different times may be more desirable.
- Work zone management is part of TSMO activities.
- CHART has governance for their own use for work zone performance as well as other types of operational data.
- There is a task force looking at work zone metrics and costs—there is a data feed to leverage Lane Control System in CHART.
- SHA uses probe speed data for work zone analysis.
- SHA has a dashboard with work zone data. The dashboard is real time only, and the data is not archived.
- The NHS is almost covered in the Arterial Work Zone Program.
Assessment
- There is not a Work Zone Planning Program to analyze the impact on corridors.
- Work zone data initiatives have been part of the operations realm and, as such, practices are moderately robust. For planning, however, the existing initiatives need to be improved.
Desired State
- Would be good to develop targets for user delay in work zones. SHA would need to incorporate this in contracts at the beginning.
- Would like a work zone program to bring all the data together.
- Want to analyze the impact of work zones as part of SHRP 2 program—want to do real time archive of work zone performance.
- Archiving data from the Work Zone Dashboard would be beneficial.
- Potentially stage work zones one after another to minimize impacts.
- Lane closure permitting is not directly linked to construction projects. However, there is a program in CHART where alternate routes are recommended. Would be good to have a standard layer.
- Need to establish governance for planning use of CHART's operational data.
Improvement/Action Strategies
- Develop work zone performance measures.
- Archive impacts of work zones from the Dashboard.
- Start to assess impacts (modeling impacts of effects and impacts—before and after).
- Need to establish governance for planning use of CHART's operational data.
- For work-zone performance data, determine a way to include what network system each signal belongs to.
- Develop data collection standards.
- Archive work zone data for the Work Zone Dashboard.
- Develop a standard layer of alternate routes linked to construction projects.
- Archive work zone data for performance measures.
- Develop a work zone plan to stage work zones one after another to minimize impacts.
- Develop a process to analyze the impact of work zones (potentially as part of the SHRP 2 program).
- Develop a streamlined system to bring all work zone data together.
- Establish a work zone program to bring all the data together.
Signal Timing
Overview
- Upgraded signals will have the capability to deliver volume data, video, etc.
- A key activity of the TSMO plan is to develop an arterial and freeway master plan.
- The Traffic Operations Division maintains a Google layer for signals.
Assessment
- Currently using Econolite equipment. It is industry standard but will be a limiting factor.
- Asset data layer not connected to field data.
- Library of Synchro models for signal systems. No link between the system models and intersections.
- Approximately 2,500 signals.
- Research being conducted.
- Integrate signal systems with Centracs.
- Deploy a test site using Naztec adaptive signal controllers; potentially install other systems.
- Would like Bluetooth travel time, percent arrival on green, and signal phasing and timing statewide.
- Each signal has a unique identifier, so there is potential to combine with GIS layers (e.g., using latitude/longitude).
- There is a GIS layer for signals, but the origin is not known, and it may not be updated.
Desired State
- More coordination between Signal and GIS offices.
- Mapping the signal database with signal data.
- Desire to tie Centracs data into other systems.
- Desire to archive traffic signal data for performance measures.
- Need to develop a plan to use and implement fiber infrastructure.
- Need to include what system a signal belongs to and allow for modification.
Improvement/Action Strategies
- Set up meeting with relevant stakeholders to better coordinate Signal and GIS offices.
- Map signal database with signal data.
- Use archived traffic signal data to develop various performance measures such as percent arrival on green.
- Develop a fiber infrastructure plan.
- Signal phasing and timing should be part of Connected and Automated Vehicles (CAV) initiative in the future.
- Include signals in Intelligent Transportation System (ITS) Asset Management inventory.
- Develop a plan to use and implement fiber infrastructure for signals.
- Develop data collection standards.
- Orient research efforts to get statewide signal phasing and timing.
- Talk to Econolite about how to tie Centracs into other systems.
- Discuss how to best combine signal timing data with GIS.
Connected and Automated Vehicles
Overview
- MDOT has been trying to investigate how to plan for connected and automated vehicles. Most of the discussion centers on safety.
- The University of Maryland's Center for Advanced Transportation Technology (CATT) Lab is working with connected/automated vehicle stakeholders, including auto makers, to develop new datasets out of those technologies.
Assessment
- Connected/automated vehicle data is still in a developing stage, and SHA has been proactive in identifying this as a future data source.
Desired State
- Desire to develop a framework to identify and deal with connected/automated vehicles, not only for safety but also mobility and asset conditions.
Improvement/Action Strategies
- Discuss the development of a framework to develop and manage connected/automated vehicle data for safety, mobility, and asset conditions.
General Items
- There is too much mobility data with varying degrees of granularity. There needs to be a process to better synchronize it.
- Mobility data may not have all quality checks needed. With the Mobility Dashboard, there is a need to better understand the data quality of each source (perhaps through a disclaimer in the metadata), and a need to raise awareness of this resource.
- Desire for all data outputs to have a spatial component.
- Linear referencing systems used are not consistent. Desire to have a common linear referencing system for all datasets.
- Need consistent data standards, governance, and metadata.
- Desire for data collection and management to be more automated.
- Desire to conduct a data inventory and inventory check.
- Desire to have cross validation checks for all data types.
- Develop system of cross-validation of all data sources.
- Desire to have governance for planning use of CHART's operational data.
Assessment of Capability
An assessment of MDOT SHA's capabilities for collecting, managing, governing, and using mobility data was conducted using a capability maturity model. A maturity model helps agencies assess their current capabilities with respect to data management and governance and identify next steps in achieving the goals and objectives of the DBP.
There are three distinct levels of capability:
- Level 1—Initial/Under Development. Activities and relationships are largely ad hoc, informal, and champion driven, substantially outside the mainstream of other activities. Alternatively, the capability is under development, but there is limited internal accountability and uneven alignment with other organizational activities.
- Level 2—Defined/Managed. Technical and business processes are implemented and managed, partnerships are aligned, and training is taking place.
- Level 3—Optimized. Data management and governance is a full, sustainable program priority, with continuous improvement, top-level management support, and formal partnerships in place.
The assessment of capability is based on the workshops and a self-assessment exercise with MDOT SHA staff and addresses each of the data types that define mobility data for this DBP. The results of the assessment will help prioritize data systems for enhancements or replacements to support mobility planning, operations, and performance measure activities.
Figure 1 shows the current level of maturity for each data type according to its use for planning or operations functions.
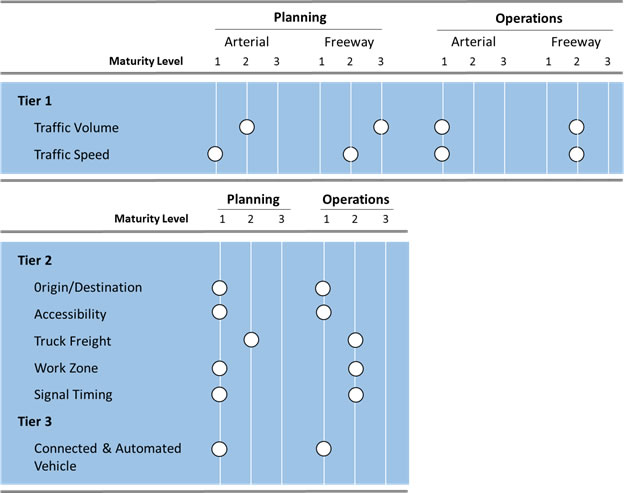
Figure 1. Charts. Assessment of capability.
(Source: Cambridge Systematics, Inc.)
|