2017 Road Weather Management Performance Measures Update
Appendix A. State Department of Transportation Survey Summary
The following pages show the State department of transportation (DOT) survey questions and summary.
Q4. What are your agency's sources of weather and road weather information? (Check all that apply.)
Associated PM: Number of State DOTs that subscribe to road weather products and services.
Table 4. State department of transportation survey question 4 and associated responses.
| Answer Options |
Response Percent |
Response Count |
| Fixed Agency Sensors (road weather information system) |
95.0% |
38 |
| Mobile Agency Sensors |
55.0% |
22 |
| Private Weather Service Providers |
72.5% |
29 |
| Agency Field Personnel |
75.0% |
30 |
| Public / Social Media |
47.5% |
19 |
| Federal Aviation Administration Products (automated surface observing system/automated weather observing system) |
25.0% |
10 |
| National Weather Service Products |
95.0% |
38 |
| National Oceanic and Atmospheric Administration Meteorological Assimilation and Data Ingest System |
17.5% |
7 |
| U.S. Geological Survey Earthquake Alerts |
10.0% |
4 |
| Not Sure / Unknown |
0.0% |
0 |
| Other |
5.0% |
2 |
| Answered Question |
 |
40 |
| Skipped Question |
|
0 |
ASOS = Automated Surface Observing System. AWOS = Automated Weather Observation System. FAA = Federal Aviation Administration. NOAA = National Oceanic and Atmospheric Administration. RWIS = Road Weather Information System. USGS = United States Geological Survey.
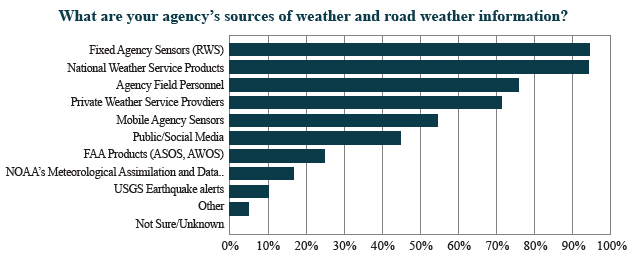 Figure 24. Chart. Responses from State department of transportation survey question 4.
Other responses to Question 4 included:
- Weather Senty DTN.
- Traffic Operations CCTV cameras.
Q5. Does your agency collect real-time field data from maintenance vehicles?
Associated PM: Number of State DOTs collecting mobile observations of road weather data from appropriate vehicle fleets.
Table 5. State department of transportation survey question 5 and associated responses.
| Answer Options |
Response Percent |
Response Count |
| Yes |
57.5% |
23 |
| No |
42.5% |
17 |
| Not Sure / Unknown |
0.0% |
0 |
| Answered Question |
|
40 |
| Skipped Question |
|
0 |
Q5.1. If you answered "Yes" to question #5, which of the following data are collected from maintenance vehicles, and from what percentage of the applicable fleets?
Associated PM: Number of State DOTs collecting mobile observations of road weather data from appropriate vehicle fleets.
Table 6. State department of transportation survey question 5.1 and associated responses.
| Answer Options |
100% |
At least 50% but less than 100% |
At least 25% but less than 50% |
Less than 25% |
Not Collected |
Not Sure/ Unknown |
Total |
% Collecting Mobile Observations |
| Plow Status and Material Usage |
5 |
8 |
3 |
4 |
2 |
1 |
23 |
87.0% |
| Atmospheric weather data (air temperature, relative humidity, etc.) |
2 |
7 |
4 |
7 |
3 |
0 |
23 |
87.0% |
| Road weather conditions data (pavement temperature, etc.) |
3 |
7 |
4 |
7 |
2 |
0 |
23 |
91.3% |
| Answered Question |
|
|
|
|
|
|
23 |
|
| Skipped Question |
|
|
|
|
|
|
0 |
|
Q6. Has your agency developed applications or tools that use real-time mobile data from vehicle fleets?
Associated PM: Number of/percentage of responding agencies using mobile data-based applications in road weather management.
Table 7. State Department of transportation survey question 6 and associated responses.
| Answer Options |
Percentage |
| Yes |
32.5% |
| No |
20.0% |
| Considering, but Not Yet Developed |
47.5% |
| Not Sure / Unknown |
0.0% |
| Answered Question |
40 |
| Skipped Question |
0 |
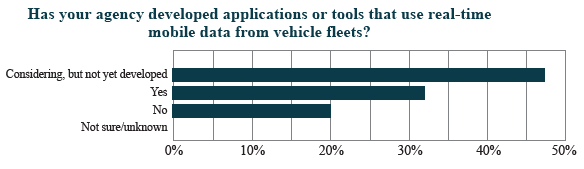 Figure 25. Chart. Responses from State department of transportation survey question 6.
Q7. Has your agency developed applications or tools that leverage infrastructure-to-vehicle (I2V) or vehicle-to-infrastructure (V2I) connectivity?
Associated PM: Number of/percentage of responding agencies using mobile data-based applications in road weather management.
Table 8. State department of transportation survey question 7 and associated responses.
| Answer Options |
Percentage |
| Yes |
17.5% |
| No |
37.5% |
| Considering, but Not Yet Developed |
42.5% |
| Not Sure / Unknown |
2.5% |
| Answered Question |
40 |
| Skipped Question |
0 |
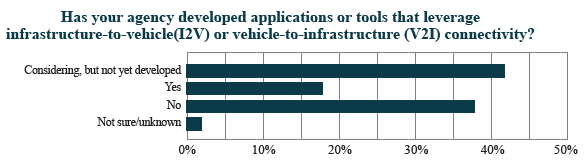 Figure 26. Chart. Responses from State department of transportation survey question 7.
Q8. Approximately how many environmental sensor stations (ESS) does your State agency operate statewide?
Associated PM: Number of State DOTs reporting the use of ESS in operations and maintenance activities.
Table 9. State department of transportation survey question 8 and associated responses.
| Total number |
2424 |
| Answered Question |
40 |
| Skipped Question |
0 |
Q9. Describe how you use your ESS data. (Check all that apply).
Associated PM: Number of State DOTs reporting the use of ESS in operations and maintenance activities.
Table 10. State department of transportation survey question 9 and associated responses.
| Answer Options |
Percentage |
| Provide Current Conditions to Traveler Information Systems |
70.0% |
| Input for Segment-Level Forecasts |
50.0% |
| Support Traffic Management and Maintenance Decision-Making (e.g., Maintenance Decision Support System) |
72.5% |
| Do Not Use Environmental Sensor System Data |
7.5% |
| Not Sure / Unknown |
5.0% |
| Other |
7.5% |
| Answered Question |
40 |
| Skipped Question |
0 |
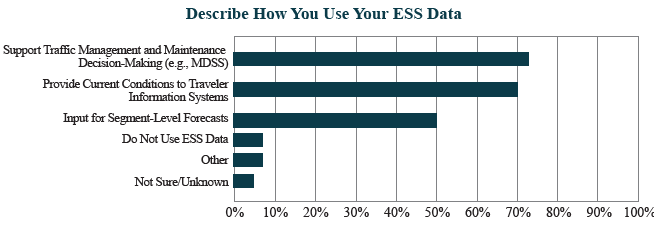 Figure 27. Chart. Responses from State department of transportation survey question 9.
Other responses to Question 9 included:
- Operation of variable speed limit systems.
- Provide current conditions to maintenance personnel.
- Performance monitoring/research.
Q10. Describe the level of deployment in your agency of the following road weather information strategies.
Associated PM: Number of States disseminating weather advisory and other road weather information to travelers.
Table 11. State department of transportation survey question 10 and associated responses.
| Answer Options |
Deployed Statewide (or in all applicable locations) |
Limited or Partial Deployment |
Not Yet Deployed |
Not Sure/ Unknown |
Total |
| Atmospheric Weather Information on Dynamic Message Signs |
42.1% |
21.1% |
36.8% |
0.0% |
100.0% |
| Road Condition Information on Dynamic Message Signs |
50.0% |
35.0% |
12.5% |
2.5% |
100.0% |
| Road Condition Information on Highway Advisory Radio |
27.0% |
27.0% |
32.4% |
13.5% |
100.0% |
| Road Condition Information on Agency-Hosted Social Media (Twitter, Facebook, etc.) or Mobile Applications |
60.5% |
26.3% |
13.2% |
0.0% |
100.0% |
| Road Condition Information on Agency-Hosted Websites or 511 Phone Systems |
77.5% |
15.0% |
7.5% |
0.0% |
100.0% |
| Answered Question |
|
|
|
|
40 |
| Skipped Question |
|
|
|
|
0 |
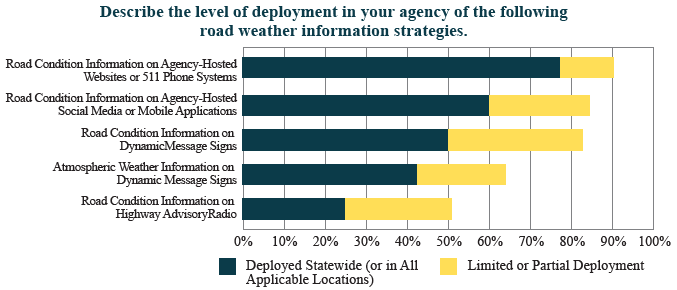 Figure 28. Chart. Responses from State department of transportation survey question 10.
Q11. Describe the level of deployment in your agency of the following traffic management strategies that respond to weather conditions.
Associated PM: Number of agencies using control and treatment strategies during weather events.
Table 12. State department of transportation survey question 11 and associated responses.
| Answer Options |
Deployed Statewide (or in all applicable locations) |
Limited or Partial Deployment |
Not Yet Deployed |
Not Sure/ Unknown |
| Ramp Meters |
18.4% |
13.2% |
60.5% |
7.9% |
| Traffic Signal Timing |
13.2% |
13.2% |
63.2% |
10.5% |
| Variable Speed Limits |
10.8% |
24.3% |
62.2% |
2.7% |
| Intelligent Transportation Systems (ITS) for Temporary Vehicle Restrictions (e.g., High Profile Vehicles in High Winds) |
7.7% |
35.9% |
48.7% |
7.7% |
| ITS for Lane / Road Closure and Traffic Diversions |
28.2% |
23.1% |
43.6% |
5.1% |
| Traffic Incident Management |
38.5% |
46.2% |
10.3% |
5.1% |
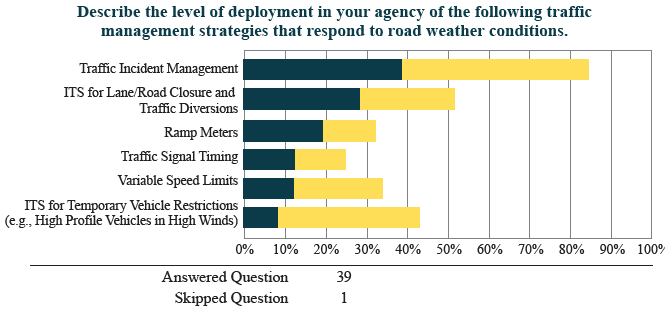 ITS = intelligent transportation systems.
Figure 29. Chart. Responses from State department of transportation survey question 11.
ITS = intelligent transportation systems.
Figure 29. Chart. Responses from State department of transportation survey question 11.
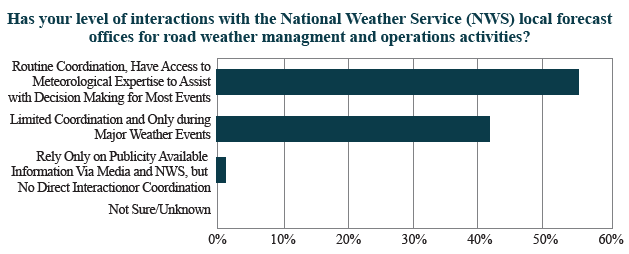
Q12. Describe your level of interactions with the National Weather Service (NWS) local forecast offices for road weather management and operations activities.
Associated PM: Number of agencies that coordinate with their local forecast offices for road weather management operations.
Table 13. State department of transportation survey question 12 and associated responses.
| Answer Options |
Percentage |
| Rely Only on Publicity Available Information via Media and National Weather Service, but No Direct Interaction or Coordination |
2.5% |
| Limited Coordination and Only During Major Weather Events |
42.5% |
| Routine Coordination. Have Access to Meteorological Expertise to Assist with Decision Making for Most Events |
55.0% |
| Not Sure / Unknown |
0.0% |
| Answered Question |
40 |
| Skipped Question |
0 |
 ITS = intelligent transportation systems.
Figure 30. Chart. Responses from State department of transportation survey question 12.
ITS = intelligent transportation systems.
Figure 30. Chart. Responses from State department of transportation survey question 12.
Q13. Does your agency use a winter maintenance decision support system
(MDSS) for snow and ice control? A winter MDSS includes software that provides strategic and tactical weather forecasts, supports treatment decision making and provides summary reports of weather event performance.
Associated PM: Number of agencies adopting MDSS technologies and methods.
Table 14. State department of transportation survey question 13 and associated responses.
| Answer Options |
Percentage |
| Yes - Use a maintenance decision support system (MDSS) Statewide |
20.0% |
| Yes - Use an MDSS, but Not Statewide |
15.0% |
| No - Need an MDSS, but Currently Do Not Have a System |
22.5% |
| No - Do Not Need an MDSS |
35.0% |
| Not Sure / Unknown |
7.5% |
| Answered Question |
40 |
| Skipped Question |
0 |
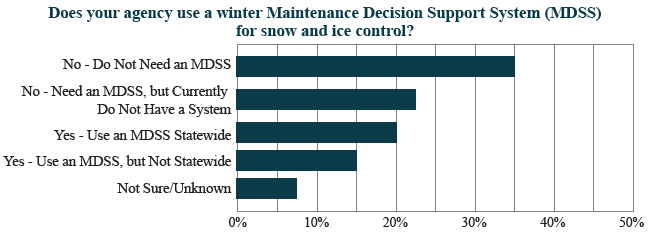 Figure 31. Chart. Responses from State department of transportation survey question 13.
Q13.1. If you need an MDSS, but currently do not have a system, please provide the reason(s) for the lack of implementation.
Responses to Question 13.1 included:
- Hesitancy in the upper management to indulge in MDSS but would support some program to take all of our winter related data and make it easier to review for our maintenance crews to make decisions on operational decisions.
- Currently working under ED4 for an institutionalized RWMS to include MDSS.
- Cost, lack of funding, and lack of sufficient support infrastructure.
- Currently investigating the development and implementation of a maintenance management system in which MDSS will be a component.
- Withdrew from an MDSS group after information provided was suspect due to the fact our snow is much different than the Midwest and MDSS called for much more use of deicers than we felt were needed. (California.)
- Due to the lack of input from vehicles, a system of this magnitude would largely go unused at this point, relative to the summary reports for event performance. Currently utilize tactical and strategic weather reports, provided by an outside vendor, to support operational decision making before and during an event. Once we can support a vehicle based information system, to include the monitoring of plowing and spreading, we would, in all likelihood, employ an MDSS.
- We currently have our protocol with regard to winter maintenance operations and are looking into it.
- Winter weather events have limited impacts and don't happen very often.
Q14. Does your agency use other decision support tools (besides a winter MDSS) for road weather management. If so, how are they used? (Check all that apply)
Associated PM: Number of agencies reporting use of appropriate analysis tools to factor weather impacts and strategies.
Table 15. State department of transportation survey question 14 and associated responses.
| Answer Options |
Percentage |
| None |
10.0% |
| Providing Traveler Information |
72.5% |
| Coordination with Other Jurisdictions / Agencies |
52.5% |
| Supporting Non-Winter Maintenance Activities (e.g., Maintenance Scheduling, Construction Coordination) |
42.5% |
| Traffic Control and Management (e.g., Speed Limit Determination, Signal Timing Plans, Ramp Metering Rates) |
20.0% |
| Setting Seasonal Load Restrictions |
12.5% |
| Not Sure / Unknown |
7.5% |
| Other |
7.5% |
| Answered Question |
40 |
| Skipped Question |
0 |
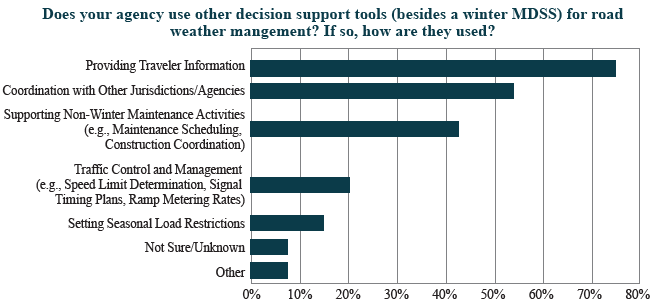 Figure 32. Chart. Responses from State department of transportation survey question 14.
Other responses to Question 14 included:
- RWIS, contracted weather service, storm monitors.
- Use of PikAlert in near future.
- Emergency Management software for all transportation related weather events (hurricanes, severe weather, etc.).
Q15. What types of traffic analysis and simulation tools does your agency use for planning and evaluating road weather management strategies? (Check all that apply)
Associated PM: Number of agencies reporting use of appropriate analysis tools to factor weath- er impacts and strategies.
Table 16. State department of transportation survey question 15 and associated responses.
| Answer Options |
Percentage |
| None |
30.0% |
| Sketch-Planning Analysis Tools |
7.5% |
| Travel Demand Analysis Tools |
2.5% |
| Macroscopic Simulation Models |
0.0% |
| Mesoscopic Simulation Models |
0.0% |
| Microscopic Simulation Models |
0.0% |
| Deterministic Analysis Tools (Highway Capacity Manual-Based) |
0.0% |
| Traffic Signal Optimization Tools |
2.5% |
| Not Sure / Unknown |
65.0% |
| Other |
0.0% |
| Answered Question |
40 |
| Skipped Question |
0 |
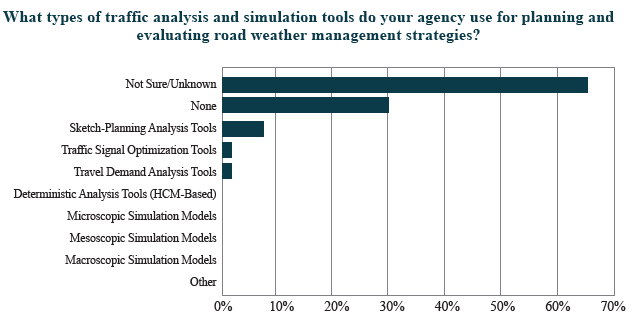 Figure 33. Chart. Responses from State department of transportation survey question 15.
Q16. Road weather management supports sustainable transportation systems. Which statements below pertain to your agency regarding the role of road weather management in sustainable transportation? (Check all that apply.)
Associated PM: Number of public agencies meeting "INVEST" and/or sustainability criteria related to road weather management.
Table 17. State department of transportation survey question 16 and associated responses.
| Answer Options |
Response Percentage |
| Have a Dedicated Road Weather Management Program |
33% |
| Have Defined Sustainability Goals for Road Weather Management that are Monitored Regularly |
33% |
| Have a Documented Materials Management Plan |
51% |
| Own and Operate a Road Weather Information System |
74% |
| Have a Documented Standard of Practice or Standard Operating Procedure (SOP) for Snow and Ice Control |
79% |
| None of These Statements are Supported |
3% |
| Not Sure / Unknown |
8% |
| Answered Question |
39 |
| Skipped Question |
1 |
Figure 34. Chart. Responses from State department of transportation survey question 16.
Q17. Has your agency participated in extreme weather or climate change adaptation practices? (Check all that apply.)
Associated PM: Number of agencies conducting vulnerability/risk assessment or developing/ implementing resiliency plans, for their road weather management infrastructure and processes to respond to climate change and extreme weather; Number of agencies participating in State DOT climate adaptation activities sponsored by the FHWA and its partners.
Table 18. State department of transportation survey question 17 and associated responses.
| Answer Options |
Percentage |
| Answer Options |
Percentage |
| Conducted a Vulnerability / Risk Assessment for Road Weather Management Infrastructure |
18% |
| Developed / Implemented Process for Responding to Extreme Weather |
50% |
| Developed / Implemented Resiliency Plans for Road Weather Management Infrastructure |
18% |
| Participated in State DOT Resilience Adaptation Planning Activities |
21% |
| Agency Has Not Participated in Development of Adaptation Practices |
16% |
| Not Sure / Unknown |
37% |
| Answered Question |
38 |
| Skipped Question |
2 |
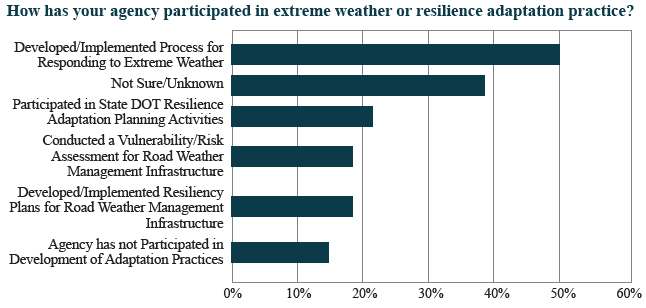 Figure 35. Chart. Responses from State department of transportation survey question 17.
Q18. Does your agency collect and report road weather performance measures? (This may include dashboards, winter maintenance reports, seasonal summaries, etc.)
Associated PM: Number of agencies that collect and report road weather related performance measures to the public (i.e. winter severity index, mobility index, etc.).
Table 19. State department of transportation survey question 18 and associated responses.
| Answer Options |
Percentage |
| Yes |
56% |
| No |
33% |
| Not Sure/Unknown |
10% |
| Answered Question |
39 |
| Skipped Question |
1 |
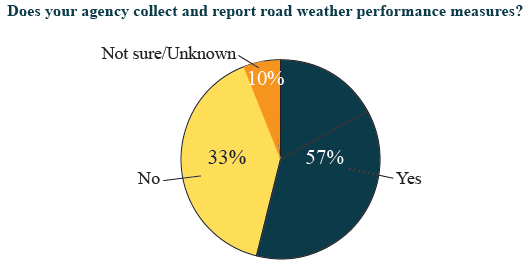 Figure 36. Chart. Responses from State department of transportation survey question 18.
Q18.1. Please provide a description, reference, and/or link to your agency's road weather performance measures.
Several internal reports and programs. Public-facing versions here:
- Several internal reports and programs. Public-facing versions here:
- We are starting to utilize the RWIS data and the level of grip after the storm to establish performance measures. We have begun collecting data and evaluating this winter.
- An internal report is run to evaluate the recovery time of expected travel speeds following the conclusion of a winter weather event. It combines RWIS and traffic speed data synthesis that are used to evaluate our performance and measure our ability to achieve success under one of our Critical Success Factors.
- Percentage of time grip is safe when there is a surface layer at below 32 degrees.
- Percentage of time RWIS sites are on line (goal is 95%).
- Index quantifying response to winter storms.
- We report lag/lead metrics for LOS grading statewide, on I-25 through Denver Metro, and on I-70 from Golden to Dotsero. These grades are reported out every two months to executive management.
- They are published internally only.
- We measure snow and ice clearance times by County.
- We have a tracker that measures the time it takes from the last of the precipitation to reach the performance objectives of winter operations http://www.modot.org.
- http://www.dot.state.mn.us/measures/index.html.
- We have just recently added sensors to use the Idaho performance measurement system, but haven't implemented the system operationally.
- Dashboard, winter maint reports, and seasonal summaries.
- Dashboard and Precise GPS monitoring.
- http://www.state.nj.us/transportation/about/winter/expenditures.shtm.
- Not published at this time, plans to be published in near future.
- The UDOT Snow and Ice Performance Measure was built in-house using strictly data from RWIS sites. This measure uses a storm severity index. The winter severity index can be calculated.
- Congestion & Mobility Performance Report (http://www.michigan.gov/mdot/0,4616,7-151-9622_11045_25024_75677---,00.html)
- Custom Reports:
- Time to restore pavement to normal flow after winter precip.
- Salt usage by lane mile per inch of snow.
- Winter Operations Performance (Equipment, materials, road conditions).
- Internal documents – Winter Event Tracing form. Just began using and experimenting this past winter.
- We are working on several segments utilizing recovery speed data from ATR's. This will be expanded to other areas in the future using ATR's, radar sensors, and possibly third party data in the future.
Q19. Does your agency use a "winter severity index" to compare performance
across events or across years?
Associated PM: Reduction in number of tons of salt or chemical usage in the US normalized by winter severity index.
Table 20. State department of transportation survey question 19 and associated responses.
| Answer Options |
Percentage |
| Yes |
41% |
| No |
56% |
| Not Sure/Unknown |
3% |
| Answered Question |
39 |
| Skipped Question |
1 |
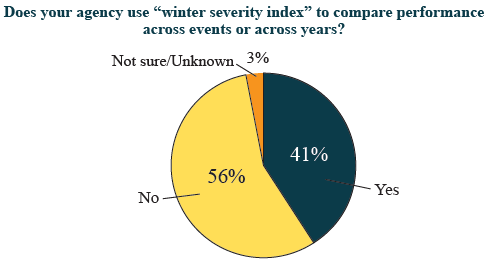 Figure 37. Chart. Responses from State department of transportation survey question 19.
Q20. Does your agency have a process for evaluating the return on investment or net benefits of road weather management investments?
Associated PM: Number of agencies that have a process for evaluating the return on investment or net benefit of their road weather management investments.
Table 21. State department of transportation survey question 20 and associated responses.
| Answer Options |
Percentage |
| Yes |
23% |
| No |
56% |
| Not Sure/Unknown |
21% |
| Answered Question |
39 |
| Skipped Question |
1 |
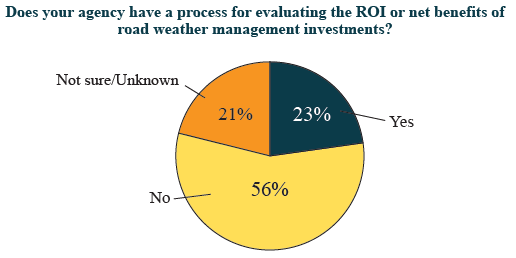 Figure 38. Chart. Responses from State department of transportation survey question 20.
Q21. Would you be willing to participate in the next update of this survey?
Table 22. State department of transportation survey question 20 and associated responses.
| Answer Options |
Percentage |
| Yes |
92% |
| No |
5% |
| Not Sure/Unknown |
3% |
| Answered Question |
39 |
| Skipped Question |
1 |
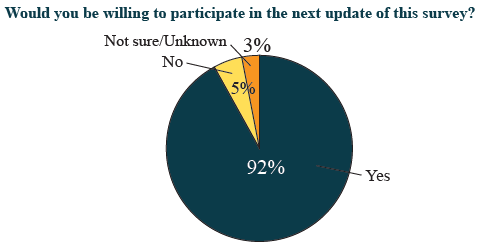 Figure 39. Chart. Responses from State department of transportation survey question 21.