Planning for Transportation Systems Management and Operations within Subareas – A Desk ReferenceCHAPTER 5. TOOLBOX FOR EFFECTIVE TRANSPORTATION SYSTEMS MANAGEMENT AND OPERATIONS PLANNINGThere are a variety of tools that can support transportation systems management and operations (TSMO) planning within subareas, and many of them have already been discussed prior to this chapter, including analytical tools and simulation models, the regional intelligent transportation system (ITS) architecture, and archived operations data. (Note: The word "tools" is used in this chapter in the broadest sense—anything that can be used to support and enhance TSMO planning on a subarea.) This chapter offers readers a "toolbox" of analysis instruments and planning techniques that can be applied when planning for TSMO within subareas. For several of the tools described, there is at least one additional Federal Highway Administration (FHWA) guide that can give readers a much greater understanding of how the tool may be applied. This chapter begins with two planning techniques and then moves into quick reference sheet-style descriptions of common types of analysis tools. Following the quick reference sheets are overviews of several specific applications that planners and operators can use to address analysis needs directly while planning for TSMO within subareas. SCENARIO PLANNING FOR TRANSPORTATION SYSTEMS MANAGEMENT AND OPERATIONS WITHIN SUBAREASScenario planning is an important enhancement to planning for TSMO within a subarea. It can be used to incorporate the consideration of factors that are difficult to predict, such as evolving technology, climate change, shifting traveler behavior, financial uncertainty, failing infrastructure, natural and man-made events, and other unknowns into planning and programming decisions. Scenario planning supports the exploration and consideration of different future conditions in a subarea. Scenario planning is an approach to strategic planning that uses alternate narratives of plausible futures (or future states) to play out decisions in an effort to make more informed choices and create plans for the future. It engages participants in considering the "what ifs" of tomorrow and whether those are desirable or undesirable outcomes. The simple task of imagining a different future can help to challenge the status quo and encourage creative thinking, which ultimately can lead to the development of more thoughtful and resilient plans. Scenarios are developed to enable participants to test out possible decisions, analyze their impacts given the conditions in each scenario, and come to agreement on a preferred course of action. Scenario planning follows many of the same planning activities as described in Chapter 3, beginning with scoping the effort, examining current conditions and trends, and then identifying goals and objectives. In scenario planning, the leaders and stakeholders would then develop multiple scenarios or descriptions of possible futures, identify the strategies needed to realize each of the scenarios, and then analyze the impacts of each scenario against reaching their objectives. The scenario planning approach to TSMO is shown in Figure 20. Generally, there are three types of scenario planning that reflect the different conditions and purposes for which scenario planning may be used. For example, scenario planning for TSMO within a subarea may be used to identify the most effective package of TSMO strategies given an expected change in conditions on the subarea (trend-based type). Alternatively, scenario planning may be used to build consensus on operations objectives by examining multiple desired future conditions and the strategies needed to support those conditions (normative type). Finally, scenario planning can be used to examine different scenarios in response to uncontrollable or unknown future conditions (e.g., to better understand the impacts of global trade changes, extreme weather, etc.). The purpose of this is to guide stakeholders in identifying policies, plans, and strategies that can work best under all extreme conditions (exploratory type). Additional information on how to use scenario planning to advance TSMO can be found in FHWA's Advancing Transportation Systems Management and Operations Through Scenario Planning.87 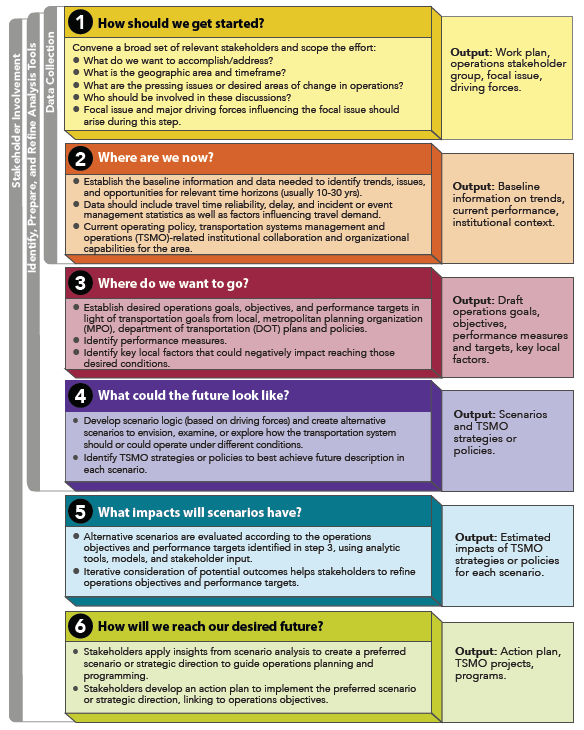 Figure 20. Diagram. Phases of scenario planning for transportation systems management and operations.88 USE OF ARCHIVED OPERATIONS DATAArchived operations data is a critical tool in an objectives-driven, performance-based planning approach to TSMO within subareas. Archived operations data is information that is collected and stored in support of day-to-day efforts to monitor and manage the transportation system. Archived operations data can include traffic, transit, bike, pedestrian, construction, and weather information that is usually collected in real time by ITS infrastructure, such as in-pavement inductive loop detectors, radar detectors, remote traffic microwave sensors, Bluetooth, and EZPass or other unique identification tag readers. It also includes incident or event information entered into electronic logs by transportation or public safety personnel. Transportation planners at the State, metropolitan, and local level are finding that, with archived operations data, they are able to do more, be more accurate, and solve more problems than ever before—relying less on assumptions and modeled data and making more effective, less costly decisions. There are several advantages to having archived operations data available, including:
The following are examples of significant uses for archived operations data in planning for TSMO within subareas:
FHWA has produced a desk reference (Use of Archived Operations Data in Planning) on applying archived operations data to planning aimed toward TSMO planners and their planning partners. This desk reference raises planners' awareness of the opportunities afforded through archived operations data and provides guidance on how to take advantage of that data to expand and improve planning practices89 It also identifies new and innovative applications for this data in planning. The desk reference is intended to help planners and their operations data partners overcome the barriers to obtaining and using data. ANALYSIS TOOLS AVAILABLE FOR TRANSPORTATION SYSTEMS MANAGEMENT AND OPERATIONS PLANNING WITHIN SUBAREASBelow are the quick reference sheets for several types of analysis tools that can be applied for TSMO planning within subareas. The types of analysis tools covered are travel demand models, sketch planning tools, analytic/deterministic tools, simulation tools, and dynamic traffic assignment (DTA) methods. Travel Demand Models
Sketch Planning Tools
Analytical/Deterministic Tools
Simulation Tools
Dynamic Traffic Assignment
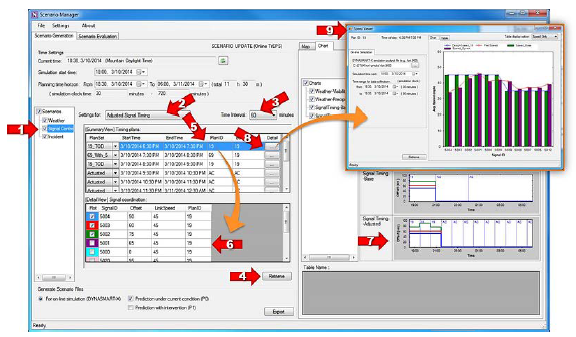
WEATHER-RESPONSIVE TRAFFIC MANAGEMENT STRATEGIES AND TOOLSApplication to Planning for Transportation Systems Management and Operations within SubareasInclement weather is known to have disruptive impacts on traffic operations and system performance and may temporarily alter travel demand. Neglecting these impacts and changes may lead to decreased performance of the transportation system. Through FHWA's Road Weather Management Program, predictive weather-responsive traffic system management decision support capabilities have been developed and tested, including the weather-sensitive Traffic Estimation and Prediction System (TrEPS).90 Within the TrEPS model is DYNASMART-X, a real-time system that continuously interacts with loop detectors, roadside sensors, and vehicle probes to provide real-time estimates of traffic conditions, network flow patterns, and routing information. TrEPS allows weather-responsive traffic management (WRTM) applications to be used in network modeling and simulation tools and demonstrates the potential of WRTM in evaluating and developing strategies for urban areas and subareas as part of the routine functions of planning and operating agencies. In addition, FHWA is trying to improve integrated modeling for road condition prediction (e.g., better integration with weather forecasts/other traffic events, and improved interfacing with existing systems and TMC databases) by enhancing TrEPS functions.91 Samples of UseFHWA used the TrEPS model, calibrated for the Salt Lake City region, to implement and evaluate weather-responsive traffic signal timing in the Riverdale corridor in Ogden, Utah. The goal was to optimize signal timing in a subarea to reduce the impacts of inclement weather events and to prevent or alleviate congestion. Real-time simulation of the traffic network forms the basis of the prediction capability. It fuses historical data with sensor information, and uses a description of how traffic behaves in networks to predict future conditions and develop control measures accordingly. The estimated state of the network and predicted future states are given in terms of flows, travel times, and other time-varying performance characteristics on the various components of the network. These are used in the on-line generation and real-time evaluation of coordinated signal timing along main arterials, for diversion paths, and for weather-related interventions. When estimating and predicting traffic, TrEPS uses weather data, which allows traffic signal control intervention to be selected in a systematic and continuous process. Signal control intervention is linked to the TrEPS-predicted conditions, including weather conditions and traffic demand observed via roadway and signal sensors. The signal control interventions are linked to the TrEPS-predicted conditions that reflect weather conditions and traffic demand. Real-time traffic data feeds used as the basis for traffic estimation and prediction are obtained directly from sensors that are driving the vehicle-actuated operation of the signals. An important enabler is a scenario manager that allows relatively easy and timely selection of coordination plans given the predicted states, effectively communicated to the system operator. It is an essential link between traffic estimation and prediction and the traffic signal control decisions. Figure 21 illustrates the overall architecture of the decision support system. The system supports the TMC signal systems operator's decision making in deploying alternative signal timing plans during a weather event by integrating three components—TrEPS, Scenario Manager, and Scenario Library—into the TMC's signal operations. The Scenario Manager is a scenario generation and management tool that serves as an interface between the TrEPS real-time simulation engine and a human decision maker. It facilitates the process of developing and preparing input scenarios for the TrEPS model and the exchange of information between TrEPS and TMC operators. Deploying a particular signal plan involves setting a large number of control parameters for individual traffic signals. From a practical point of view, it often is not feasible for TMC operators to create a new plan whenever parameter adjustments are needed. Therefore, TMC operators commonly maintain a manageable number of pre-defined "canned" action sets (i.e., a Scenario Library), each of which defines all the parameters and coordination settings associated with each timing plan, and simply switch between these existing plans during traffic signal operation. The Scenario Library approach is introduced to aid this type of operation (see Figure 22).92 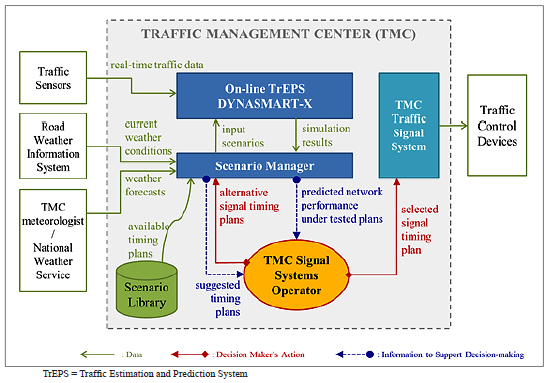 Figure 21. Diagram. Framework of the Traffic Estimation and Prediction System-based decision support framework for weather-responsive traffic signal operations.93 AdvantagesThe potential advantages of TrEPS include:
ChallengesWhile considerable progress has been accomplished to date on the successful deployment of weather responsive TrEPS, there remain several challenges with using the tool:
TOOL FOR OPERATIONS BENEFIT COST ANALYSISThe Tool for Operations Benefit Cost Analysis (TOPS-BC) offers a means to determine whether investment in a given TSMO strategy is justifiable in comparison to investment in a traditional capital infrastructure project. The tool was created by FHWA as a sketch-planning benefit-cost analysis tool to support preliminary screening and initial prioritization of TSMO strategies. The TOPS-BC tool has four key functions:
As a sketch-planning tool, TOPS-BC allows users to quickly understand typical benefits for a range of TSMO strategies and then estimate the benefit-cost ratios for each of those TSMO strategies. The tool also provides a suggested list of analysis tools whose use depends on user selected criteria, such as the level of confidence required, which TSMO strategies are being investigated, key measures of effectiveness, and a few other filters. The TOPS B-C tool is built on a Microsoft Excel platform and can be downloaded from FHWA's Planning for Operations website at: https://ops.fhwa.dot.gov/plan4ops/topsbctool/index.htm. TOPS-BC is a companion resource to FHWA's Operations Benefit/Cost Desk Reference. Application to Planning for Transportation Systems Management and Operations within SubareasTOPS B-C is a useful tool for analyzing TSMO strategies identified in subarea planning. The strategies included in TOPS B-C are commonly applied in subareas. Table 4 lists those TSMO strategies included in the TOPS-BC tool and indicates whether typical impacts or benefits are provided for the strategy, as well as the availability of more detailed calculation tools for costs and benefits.
TSMO = transportation systems management and operations.
Samples of UseAs noted above, the tool exists as a Microsoft Excel spreadsheet with several tabs and color coded cells that clearly identify where the user needs to provide information but also allows the user to modify the spreadsheet as needed. TOPS-BC calculates an annualized cost for each strategy that incorporates the useful life of the equipment, the replacement cost, and the annual operations and maintenance cost. The net present value of implementing the strategy also is provided, and while default values for the discount rate and time horizon are provided, the user can change those values. The cost components for each TSMO strategy are broken down into two categories: the one-time costs to create the backbone structure for the strategy (e.g., software and system integration), and the incremental cost of each additional installation (e.g., additional loops, weather stations, and dynamic message signs). Default costs are included in the spreadsheet for all of the cost components. The user simply needs to enter the number of infrastructure deployments and the number of incremental deployments. The annual benefits calculated by TOPS-BC focus on travel time savings for both recurring and non-recurring congestion, energy/fuel savings, and savings due to reduced crashes. A tab marked "Parameters" includes all of the assumptions used to calculate the benefits, such as:
If local information is known, in particular the percentage of trucks on the facility and crash rates on the facility by severity, those can be modified to provide a more accurate assessment of benefits. However, if local factors are not known, the default values make the tool ready to use for an approximation of the benefit for the desired TSMO countermeasure. As with the cost component, each strategy has its own tab to calculate benefits. Again, color-coded cells are used to help the user identify where input is required. A basic benefit analysis requires minimal input from the users. For example, to calculate the benefits for dynamic message signs, the user is required to provide three pieces of information:
There are additional categories where default values are provided, or the user can override those values when location-specific information is known. For example, the ramp meter benefits assessment assumes a freeway free flow speed of 55 miles per hour and a ramp free flow speed of 35 miles per hour. Both of those values can be overridden if local data are known. In addition to the benefit tabs for each strategy, the tool contains a generic link-based analysis tab that can be used to enter benefits related to a TSMO strategy not specifically identified. The TOPS-BC tool also includes a summary tab that allows the user to select some or all of the strategies for a total benefit-cost summary. AdvantagesThe following are advantages of the TOPS B-C tool:
Challenges from TrainingThe right-of-way acquisition is an important component that is not captured in the cost-estimating tool.95 87 Federal Highway Administration, Advancing Transportation Systems Management and Operations Through Scenario Planning, FHWA-16-016 (Washington, DC: 2016). Available at: https://ops.fhwa.dot.gov/publications/fhwahop16016/index.htm. [ Return to note 87. ] 88 Federal Highway Administration, Use of Archived Operations Data in Planning, FHWA-HOP-16-017 (Washington, DC: 2016). Available Summer 2016 at: https://ops.fhwa.dot.gov/publications/fhwahop16016/index.htm. [ Return to note 88. ] 89 Federal Highway Administration, Use of Archived Operations Data in Planning, FHWA-HOP-16-017 (Washington, DC: 2016). Available Summer 2016 at: https://ops.fhwa.dot.gov/publications/fhwahop16016/index.htm [ Return to note 89. ] 90 Federal Highway Administration, Implementation of a Weather Responsive Traffic Estimation and Prediction System (TrEPS) for Signal Timing at Utah DOT, FHWA-JPO-14-140 (Washington, DC: July 2014). Available at: http://ntl.bts.gov/lib/52000/52600/52623/FHWA-JPO-14-140_v2.pdf. [ Return to note 90. ] 91 Federal Highway Administration, Integrated Modeling for Road Condition Prediction Concept of Operations, Unpublished Project Document, November 25, 2015. [ Return to note 91. ] 92 Federal Highway Administration, Implementation of a Weather Responsive Traffic Estimation and Prediction System (TrEPS) for Signal Timing at Utah DOT, FHWA-JPO-14-140 (Washington, DC: July 2014). Available at: http://ntl.bts.gov/lib/52000/52600/52623/FHWA-JPO-14-140_v2.pdf [ Return to note 92. ] 93 Ibid. [ Return to note 93. ] 94 Federal Highway Administration, Implementation of a Weather Responsive Traffic Estimation and Prediction System (TrEPS) for Signal Timing at Utah DOT, FHWA-JPO-14-140 (Washington, DC: July 2014). Available at: http://ntl.bts.gov/lib/52000/52600/52623/FHWAJPO-14-140_v2.pdf. [ Return to note 94. ] 95 For more information and access to the TOPS BC tool, refer to FHWA's TOPS- BC web page at: https://ops.fhwa.dot.gov/plan4ops/topsbctool/index.htm. [ Return to note 95. ] | ||||||||||||||||||||||||||||||||||||||||||||||||||||||||||||||||||||||||||||||||||||||||||||||||||||||||||||||||||||||||||||||||||||||||||||||||||||||||||||||
|
United States Department of Transportation - Federal Highway Administration |
||