Scoping and Conducting Data-Driven 21st Century Transportation System Analyses
Module 4. Conducting and Documenting Transportation Analyses
Following the data preparation guidelines presented in Module 3, Module 4 provides guidance on how to conduct and document a transportation analysis project. Figure 35 describes the contents of this Analysis Module 4, including developing the Analysis Plan containing the experimental design for the analysis, calibrating and validating the analysis tools, conducting sensitivity analysis, and producing and presenting the analysis results.
Figure 35. Diagram. Projects execution and documentation within the 21st Century analytic project scoping process.

(Source: Federal Highway Administration.)
The Analysis Plan
The analysis plan is closely related to the scoping plan; it includes planning for the analysis work and then iterative updates to assumptions, scope, and agreements as the project moves forward. The analysis plan is more detailed than a scoping plan and must be adapted as the strengths and limitations of the data and tools organized for the analysis become better understood. The analysis plan can also help maintain a clear and mutual understanding among stakeholders of expectations and assumptions and can help identify potential flaws or technical issues in the project's expected operation.
The analysis plan confirms the analysis approach and methodology, as well as project objectives, the study area conditions, performance measures, the strategies being implemented, and the tools and data to be used in the analysis. The analysis plan needs to be sufficiently detailed to provide practical guidance on the actual conduct of analysis, yet it should also retain some flexibility to adapt to project contingencies as they are encountered.
Contents
Improving specificity on the contents of a scoping plan, an analysis plan would typically include the following interrelated components—the presentation order of these components may vary depending on project characteristics:
- Project definition. This component includes problem statement and project goals and objectives, existing operational conditions, problem diagnosis, affected stakeholders and project partners, analysis time horizon, analysis periods, study area and geographic scope for the analysis, and modes and facilities affected.
- Geographic and temporal scope. The spatial extent of the study area include intersections, highways, and other facilities to be analyzed. The study area must cover beyond the end of the full spatial extent of queues and congestion in the baseline and future years of analysis. The project analysis time period, (AM/PM/midday peak hour and/or peak period, off-peak period, etc.) must cover the beginning and end of full temporal extent of queues and congestion in the baseline and future years of analysis.
- Selecting the appropriate analysis tool. Analysis tool selection is based on an assessment of several key factors, including the geographic and temporal scope of the analysis, travel modes, proposed mitigation strategies, performance measures, scenarios and operational conditions of interest for the analysis, data to become available, and cost-effectiveness for the analysis tool(s) to be used in the analysis. If partners want to model pricing strategies, it is important to select a tool that can accommodate this. The analysis team may need to consider integrating the analysis capabilities from multiple tools to achieve the necessary capabilities.
- Performance measures to be used in the analysis. Performance measures should provide an understanding of travel conditions in the study area, including both localized and system-wide metrics and recurrent and non-recurrent congestion and impacts. These measures should be able to map back to the needs and issues the analyst is trying to solve (identified in Module 1). Analysis tools need to be selected based on how they address required performance measures. Key performance measures include mobility (travel time, delay and throughput), reliability of travel time, transportation safety, emissions and fuel consumption, and costs to deploy, operate, and maintain the transportation improvements and replace equipment as they reach the end of their useful life.
- Analysis data requirements. These requirements for developing and calibrating a transportation analysis tool generally include the following types of data: roadway geometry, traffic control, travel demand and volume, performance (such as queue locations, queue lengths, travel times, and speeds); and vehicle characteristics, such as vehicle classifications or vehicle mix. Typical data challenges include comprehensiveness, reliability, and accuracy.
- Analysis tool calibration criteria and expectations. Guidance on the overall tool calibration process is presented in Volume III of the Traffic Analysis Tools suite. The suite update allows projects to be analyzed under different operational conditions with a better expected statistical fit than a "typical day" trying to represent a reliability space. These operational conditions include different incidents, work zones, weather events, and special events.
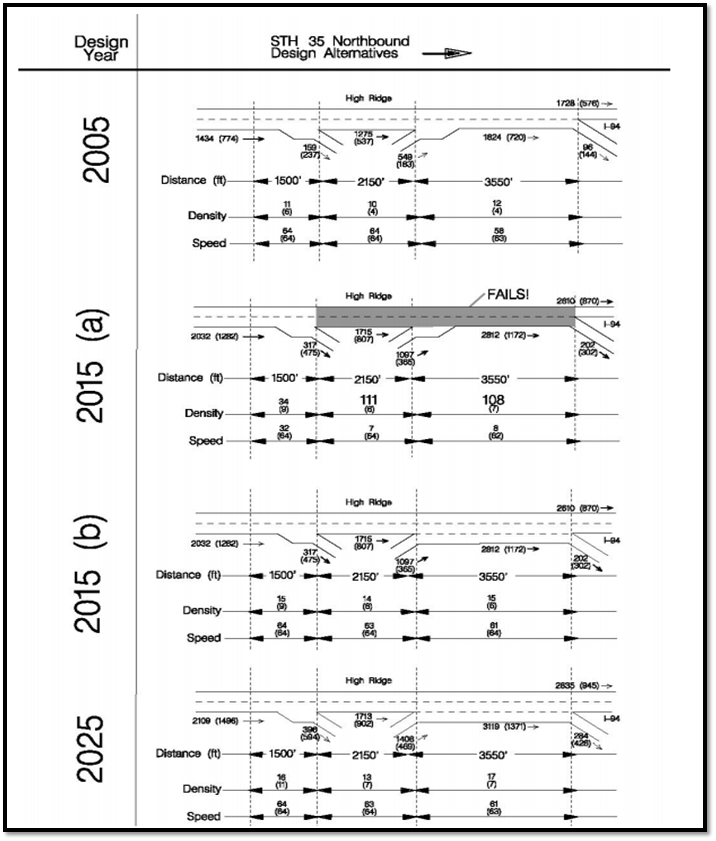
- Alternatives to be studied, including analysis scenarios and transportation mitigation strategies. Analysis scenarios should be developed for the range of operational conditions of greatest interest to the site in light of its analysis objectives. Based on the frequency and severity of conditions linked with elevated congestion levels, "operational clusters" can be defined and used in the analysis. Transportation mitigation strategies typically include geometric and operational alternatives to be analyzed and compared to the baselines. On the following page, Figure 36 shows a comparison of two alternatives using schematic drawings that represent different geometric configurations for the alternatives.
- Expected cost, schedule and responsibilities for the analysis. This section of the Analysis Plan specifies the responsibilities of different parties involved in the analysis (analysis team, project management team, client, partners, and stakeholders), presents a schedule with specific milestones for completion of analysis activities, and provides a cost estimate associated with different analysis tasks.
Some transportation agencies have developed formalized procedures on how to document analytical procedures; this documentation is sometimes referred to as the Methods and Assumptions document, which typically requires stakeholder concurrence before proceeding with the analysis. This document keeps track of all assumptions made as the analysis progresses. In the Methods and Assumptions document, the analyst keeps track of all of the decisions they made dealing with uncertainty, poor data quality, and other factors that may influence the analysis downstream. The outline for the Analysis Plan presented here is consistent with the contents of the Methods and Assumptions document.
Figure 36. Chart. Sample comparison of project alternatives using schematic drawing.
(Source: Minnesota Department of Transportation/Federal Highway Administration Traffic Analysis Toolbox Volume IV.)
Iterative Development Process
Just as the scoping plan (described in Module 2) was developed in an iterative fashion, the analysis plan requires adaptation and revision over the course of the effort. Adaptations can be related to insights gained from analyzing the underlying data, construction and testing of the analytical tools, and preliminary results obtained from the project. In some cases, initial estimates of potential impact can be examined to see if differences in system performance hypothesized among scenarios are realized when the analysis is conducted.
Stakeholder Involvement and Review
Stakeholders who participated in the development of candidate project concepts and scoping activity should also be engaged in the development and iterative adaptation of the analysis plan. All issues regarding the nature of system performance and the alternatives to be tested (described in Module 2) are still in play. The analysis plan is the document that keeps track of stakeholder insights and concerns, how they are addressed, and the impact on the overall analysis.
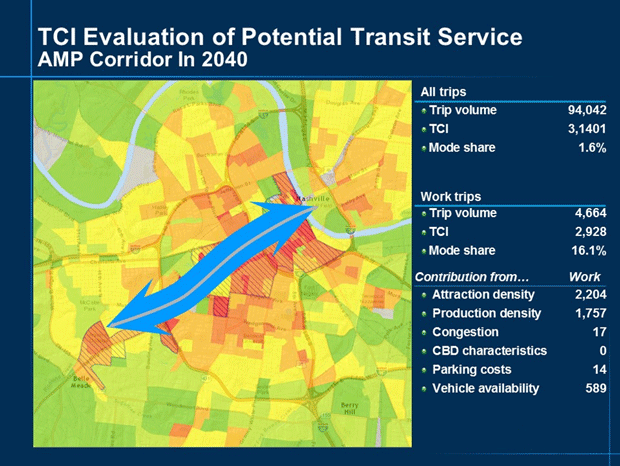
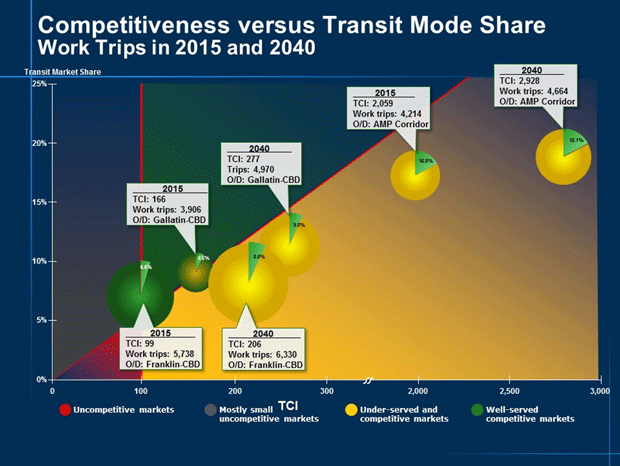
Most critically, the analysis plan should document the harmonization of conflicting or antithetical objectives and constraints as they relate to different performance measures. Overall, the analyst should strive to strike a balance between multiple performance measures to tell a potentially complex story about system performance and localized impacts—optimized in different ways for different operational conditions. As examples of this balancing process, Figure 37 and Figure 38 present evaluations of the performance of different market segments against their expected transit market share.
Figure 37. Snapshot. Evaluation of potential transit service.
(Source: Federal Highway Administration.)
Figure 38. Snapshot. Summary comparison of transit competitiveness.
(Source: Federal Highway Administration.)
Re-Examination of Problem Identification and Diagnosis
The identified problem, hypotheses, and underlying diagnostics should be checked again before proceeding with detailed development of the analysis plan; time may have passed since the project was initially conceived. The analyst should reexamine the diagnostics performed when the project was initially created (see Module 1) and the assumptions about the project scope (see Module 2.)
Experimental Design for Analysis of Different Operational Conditions
Scenarios should be developed for the range of operational conditions of greatest interest to the site in light of its analysis objectives. For example, while traffic incidents are the single largest cause of non-recurrent congestion, stakeholders are encouraged to investigate and understand other influences, including special events, weather, fluctuations in demand, and work zones. This initial analysis also includes developing a preliminary understanding of both supply side (infrastructure/capacity) and demand-side influences on the study area across all modes (including underlying causes of demand, such as directionality or day of week), with a goal of identifying potential issues (where demand exceeds supply to an extent believed to interfere with study area performance) and opportunities (underutilized capacity/supply that could potentially help absorb demand).
Practitioners should compile data on the frequency and severity of conditions linked with elevated congestion levels to create the foundation for identifying "operational clusters" that characterize the operational conditions found in the study area and can later be used to organize the analysis. Comparisons or distributions of various sources of delay should be assembled and evaluated to identify the relative frequency of events/conditions related to congestion; this is often referred to as "reliability space." From this assessment, practitioners should critically assess the potential impact of various scenarios. Scenarios identified as having a low frequency of occurrence or likelihood and low expected impact should be assigned a low priority, since the impact of their inclusion—which should be weighted by their low likelihood of occurrence in the analysis—likely provide much less impact on the final analysis outcomes than scenarios with greater frequency of occurrence or higher expected impact. This problem diagnosis may reveal needs previously unknown to the practitioners, help to weed out inconsequential scenarios, and greatly assist in targeting resources to provide the greatest expected value from the analysis.
The data analysis required in this step includes identifying the frequency and likely impact of the scenario. Those scenarios recording the greatest frequency and the greatest impacts should be given the highest analysis priority. Scenarios with a low likelihood but major impact (e.g., major snowstorms) or scenarios with a frequent occurrence but limited impact (e.g., minor incidents occurring on otherwise normal days) should be provided slightly less priority. Scenarios with low frequency and low impacts should be considered for deletion from consideration.
Experimental and Control Cases (with and without)
Once the analysis scenarios have been identified, the analyst develops improvement strategies and determines under which analysis scenarios the strategies will be activated. It is critical to understand when (under what conditions) the strategies will be applied and how their application may vary under different conditions. To better understand what factors influence congestion and the frequency in which these factors occur, the analysis team and the stakeholders need to identify the combinations of travel demand, incidents, special events, and weather events that affect the study area operations. A transportation improvement project is likely concerned with nonrecurring congestion on a level equal to or greater than typical recurring congestion levels. Therefore, it is critical that the analysis team recognize the non-typical factors that affect nonrecurring congestion.
The analysis team explores preliminary analysis hypotheses and assumptions and identifies possible opportunities and constraints associated with the application of improvement strategies identified under specific operational conditions. Freeway managers may be interested in opportunities to divert drivers from the freeway to arterials as an incident management strategy. They engage local arterial managers to understand whether the local jurisdiction can accommodate this diversion and activate these strategies to accommodate the desired performance in a sufficiently timely manner. Discussions also take place about the potential to avoid problems—such as changing signal timing or Dynamic Message Signs (DMS) to avoid queues that may lead to collisions at critical locations. If there are contributing circumstances that can be avoided that lead to greater non-recurrent congestion, the team must devise strategies to minimize these circumstances. They also seek to understand and address any concerns or constraints the local jurisdiction may have: Is the technology in place to accommodate the needed signal timing? Can the timing strategies be activated in a timely fashion to make the strategy feasible?
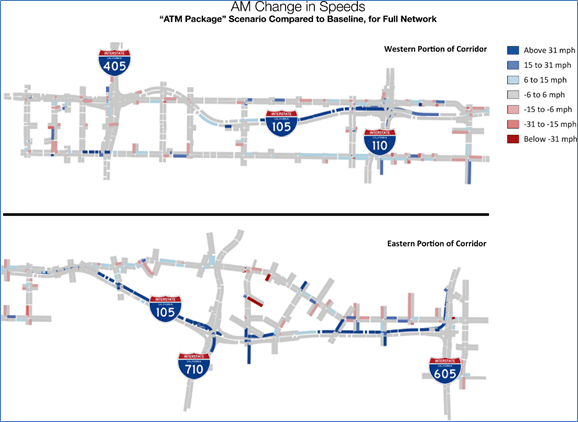
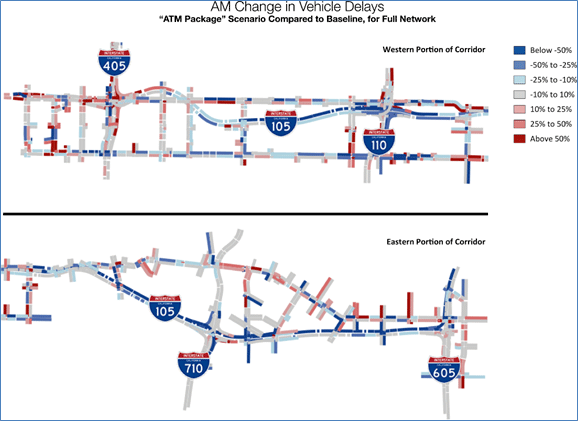
Likewise, if local agencies are interested in exploring opportunities to divert freeway or arterial traffic to transit, they will engage in collaborative dialogue with the regional transit managers to understand possibilities for creating available transit capacity, including parking facilities, to accommodate the possible influx of demand under certain scenarios. Figure 39 and Figure 40 present example comparisons of expected changes in speeds and delays, respectively, in a transportation network that contains both freeway and arterial segments; such comparisons help stakeholders visually assess expected improvements and reductions in service in different parts of the network.
Figure 39. Map. Change in speeds comparison.
(Source: Federal Highway Administration.)
Figure 40. Map. Comparison of change in delays.
(Source: Federal Highway Administration.)
The identification and refinement of improvement strategies is not typically a linear process. Initial identification takes place in close concert with the concept of operations and design phases—formulating likely strategies and combinations of strategies, then mapping the strategies to the existing conditions output generated in the previous stage. As the analysis continues and the initial results are reviewed and shared with the design team, some modifications or new alternatives may be proposed as some initial alternatives are found to be impractical or result in unforeseen negative impacts. The design team must also have a good understanding of the latency of implementation for the proposed strategies. For example, activating and implementing "flush" signal timing plans requires time to implement in the field because of operational or technological constraints. The design team must be aware of these constraints and communicate these limitations to the analysis team so they can be properly represented in the analysis.
As these discussions progress and more quantitative data becomes known, stakeholders update and refine assumptions and hypotheses, bringing further clarity and detail to the hypotheses and assumptions associated with the operational conditions and strategies to be analyzed. The analysis team must identify which parts of the envisioned strategies they may want to make dynamic—strategies that could be manipulated in response to changing operational conditions, such as ramp metering, High-Occupancy Vehicle (HOV) 2+ vs 3+, pricing strategies, or traveler behavior such as mode choice. This exercise results in the definition of experimental cases (potential improvement strategies or "with" improvements) that are analyzed and then compared to the control case (baseline, or do-nothing, or "without" improvements). Figure 41 shows a representation of a dynamic mitigation strategy; illustrations such as this help stakeholders visualize the implementation of the strategy, enabling them to make better-educated decisions about how this strategy should be implemented.
Figure 41. Snapshot. Illustration of an alternative.

(Source: Federal Highway Administration.)
Lastly, in any analysis there is uncertainty associated with various system components that may not have been defined in a robust way. The analyst has little control over "unknowables", but techniques used to minimize or bound uncertainty typically involve sensitivity or risk analysis implemented by varying analysis parameters and assumptions using probabilistic distributions of these parameters based on "back-casting" methods. Expectations on traveler responses to congestion can be bound by ranges of traveler behaviors observed in previous studies; if the analysis estimates that 4-6 percent of travelers will divert to another route in response to congestion, it is advisable to compare this diversion against previously observed traveler behavior in the same area. These methods result in a probabilistic representation of impacts that represent a statistical likelihood that a project will have a certain expected impact. In any case, as long as analytical assumptions and parameters do not vary across different alternatives the analysis can produce fairly valid conclusions on the relative effectiveness of different alternatives on, say, improved mobility.
Analysis Methodology
A systematic process is required to develop a successful base transportation analysis tool. The process should include clear documentation of the analysis tool structure, assumptions, and calibration criteria. Documenting and following the process ensures that the actual development of the analysis tool is done in orderly way, thereby minimizing coding errors and mistakes. The base analysis tool development process can be broken down into the following areas:
- Network (nodes, links, and link connectors).
- Lane geometry (number of lanes, length of turn lanes, etc.).
- Traffic control information.
- Travel demand.
- Entering volumes.
- Turning percentages.
- Origin-Destination (O-D) information.
- Modes being considered in the analysis and any specialized transit links.
- Improvement strategies being considered and their likely impacts.
- Likely diversion routes within the study area.
- Location of major multimodal transfer locations.
- Jurisdictional boundaries and the need to segment out the performance measures according to these boundaries.
- Special Generators—known locations that create or attract large amounts of trips on regular or irregular schedules (e.g., factories with shift workers, schools, stadiums).
- Error checking for all of the above.
Once the initial baseline network development is complete, the next step is to develop and deploy the trip demand data. Depending on the results of this process, it may be necessary to return to the network development process to adjust parameters within the network.
It is important that quality control is performed at this stage of the process. Because of the detail involved in specifying network and traffic signal parameters, it is fairly easy to miss some of the critical details. A separate team (internal or external) should be assigned to conduct a quality control exercise of the baseline analysis tools developed in this step.
The next step in the analysis setup process is determining travel demand for the baseline period. This process includes identifying study area travel demand and disaggregating this demand into more discrete time-period trip tables. The primary tasks involved in determining travel demand for the baseline year are identified below:
- Develop trip tables for detailed subareas. Origin-destination trip tables are established for the subarea model. This requires the aggregating and disaggregating zones into the identified traffic analysis zone structure.
- Develop time-of-day distribution. Peak-period trip tables are disaggregated into more discrete time slices. Archived data from automated traffic surveillance monitors is useful in this step to identify the average proportion of travel in the network at any given time.
- Conduct origin-destination matrix estimation. This estimation is used to develop a balanced trip table for study area.
In order for the analysis tool to correctly represent not only the traffic volume but the patterns of movement, some type of origin and destination information is required. Using O-D matrices is particularly helpful in complex networks, especially when parallel facilities are included in the network. If the project purpose involves evaluating operational strategies and determining alternate paths based on congestion, then O-D matrices make the use of the model more efficient, especially when analyzing alternate geometric configurations in future networks. Once the O-Ds are established, it becomes easier to test design alternatives and other more complex strategies.
There are multiple methods for developing O-D inputs into transportation analysis models. This is largely dependent on the software, which may have no, partial, or full O-D inputs. Depending on the size, complexity, available data, and software platform selected for the analysis, the O-D estimation technique may include one or a combination of traffic counts, surveys (license plate or roadside), and travel demand models.
A future baseline model (or future no-build alternative) is an essential part of the analysis process. It is the basis for comparison between alternatives but in a future time horizon as required by analysis needs. For the purposes of transportation analysis, a common methodology for developing future demand forecasts is to take into account regional growth due to land use, demographics, and socioeconomic activity. In cases where this information does not exist, it is acceptable to utilize a trend projection of travel demand.
Analysis Tool Calibration
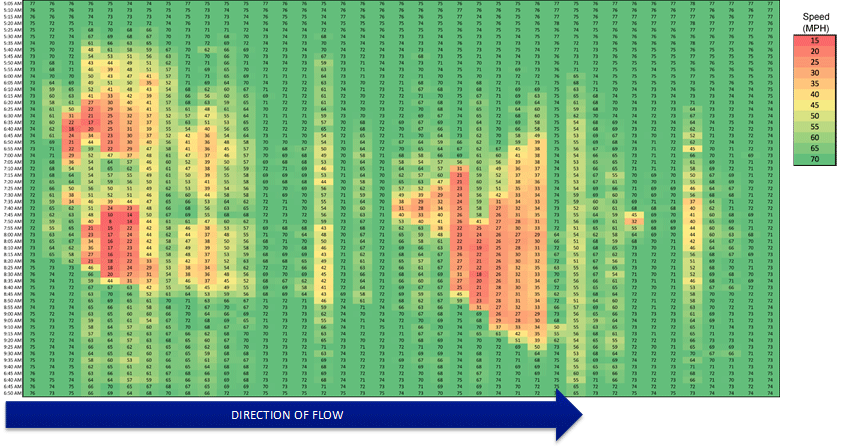
Analysis tool calibration is the process of systematically adjusting tool parameters so that the tool is able to reproduce the observed traffic conditions. The process is continued until the error between the performance measures taken from the field data and the performance measures calculated in the analysis is less than a predetermined margin of error. Once the analyst verifies that the tool does reproduce observed conditions, calibration can focus on specific performance measures, such as volumes, speeds, travel times, and bottlenecks. It is important to note that in the calibration process, there needs to be a tradeoff between the required precision and the available resources to collect data and conduct the analysis. Figure 42 presents an example of freeway speeds in space and in time for one analysis scenario—this type of diagram helps the analyst compare observed and modeled speeds in space and in time, so an assessment can be made about whether the model can adequately replicate existing conditions.
Figure 42. Heat map. Speed diagram for one analysis scenario—I-15 simulation.
(Source: Federal Highway Administration.)
The goal of calibration is to make the tool represent local, observed traffic conditions. However, since traffic may vary greatly from day to day, it is not possible for one tool to accurately represent all possible traffic conditions. Driver behavior differs by region, and it may differ significantly from normal to non-typical days. For example, poor visibility, severe weather, incidents, presence of trucks, and pavement conditions all impact driver behavior. We do not recommend using a tool developed with data from one region to represent traffic conditions in another region. Investment decisions made using a tool that has not been calibrated to local field conditions will be flawed. Guidance on the overall analysis tool calibration process is presented in Volume III of the Traffic Analysis Tools suite. The overall tool calibration process can be divided into three main steps, as described below.
- Identify the performance measures related to the analysis objectives and critical locations for the tools to be calibrated against.
- Determine the strategy for calibration, consistent with Volume III of the Traffic Analysis Tools suite.
- Conduct model calibration runs following the strategy and conduct statistical checks; when statistical analysis falls within acceptable ranges, then the model is calibrated.
The Volume III of the Traffic Analysis Tools suite update allows for the analysis of projects under different operational conditions with a better-expected statistical fit than a "typical day" trying to represent a reliability space, including operational conditions (different incidents, work zones, weather events, special events, etc.).
During the analysis process and the development of the data collection plan, the types of required field measurements are determined, including speeds, volumes, queuing, and other congestion observations at different locations in the network. Since traffic conditions fluctuate daily, it is important to obtain field data from multiple days. The multiple days of data serve as a database in which field variations are used to determine the tolerance of error in the simulated results. During model development, it is recommended that the spatial and temporal analysis limits extend beyond where and when the congestion in the field occurs. The statistical calibration should not necessarily include every link in the network, but should be focused on the critical design elements within the primary study area.
The number of locations selected for comparing the performance measures in field data against analysis outputs needs to be balanced against the quality and location of the available data, the desired level of statistical confidence, and the availability of resources. The analysis output and reporting for these statistical tests should be similar to the performance measures that will be used later in the analysis of the study area. Selecting the number of data days to be used should be based on an analysis of available data in terms of what data is available and cost-effective to collect. In an urban area where freeway sensor data are archived and readily available, more days of data can be used. In areas where there is no surveillance and where manual or temporary data collection devices are used, collecting a significant amount would be more resource-intensive.
Each transportation analysis software program has a set of user-adjustable parameters that enable the practitioner to calibrate the tool to better match specific local conditions. These parameter adjustments are necessary because no analysis tool can include all of the possible factors (both on- and off-street) that might affect capacity and transportation operations. The calibration process accounts for the impact of these "unmodeled" site-specific factors through the adjustment of the calibration parameters, which is included in the software for this specific purpose. Therefore, calibration involves selecting a few parameters for calibration and the repeated operation of the tool to identify the best values for those parameters. Calibration improves the ability of the tool to reproduce local travel conditions accurately. The key activities in calibration are listed below:
- Identify necessary calibration targets.
- Select the appropriate calibration parameter values to best match locally measured street, highway, freeway, and intersection capacities.
- Select the calibration parameter values that best reproduce current route choice patterns.
- Calibrate the overall analysis tool against overall system performance measures, such as travel time, delay, and queues.
- Document the above four activities.
The final step is to document the approach to the calibration process, including criteria and acceptance targets used, output results, any unresolved issues, and lessons learned. These items should be detailed in the calibration/validation report. A Methods and Assumptions section typically is part the analysis tool calibration documentation. In this section, the analyst keeps track of all assumptions and decisions made in the analysis dealing with uncertainty, poor data quality, and other factors that may influence the analysis downstream.
Developing and calibrating the analysis tools is often the riskiest task in the analysis; it requires the greatest investment in time and resources. The analysis team must take special care to calibrate the tool so that it replicates existing conditions (recurrent and non-recurrent traffic congestion, as well as transit system performance) as closely as possible. Errors resulting from misspecification (e.g., not gathering concurrent data) or incorrect expectations (e.g., by relying on anecdotal perceptions of corridor problems rather than archived data) can have a significant impact on project budget and timeframe. Failure to suitably invest resources in this task can result in models that are incapable of providing the correct assessment of impacts, which could require repeating this effort at significant cost. Finally, an analyst should take care not to fall into a trap of "calibrating everything"—a quixotic quest to develop models calibrated against all possible measures, all possible locations, for all possible days. Calibration should focus on a small and meaningful set of alternative-differentiating measures for locations and conditions most critical in separating the potential approaches under evaluation.
The need to calibrate and validate the developed analysis tools correctly cannot be understated. The correct calibration of the tools will influence the accuracy of the analysis outputs and animation and will ultimately determine the success of the analysis approach.
Alternatives Analysis
This activity develops alternative scenarios within the analysis tools developed and calibrated in previous tasks. These alternative scenarios are analyzed and the results documented according to guidelines provided in the analysis plan.
The analysis provides critical feedback to system designers and operators to allow them to steer their investment into the right strategies. This objective of the analysis not only includes the major investment decisions (prioritizing and selecting the right mix of strategies to deploy), it also includes the ability to assist planners and operators in devising appropriate operating parameters and concepts of operation to optimize the impacts of the selected strategies.
Analysis allows planners and operators to maximize their investments in their improvement strategies by allowing for the analysis of various "what if" scenarios to test different operational schemes, parameters, and concepts to optimize the efficiency of the proposed systems. Analysis allows for these "what if" scenarios to be tested, modified, and refined without having to resort to real-world experimentation, where any mistakes would have high costs.
The ability to analyze various conditions and test different operational parameters under these varying conditions helps operators identify deficiencies in their operational plans that would result in inefficiencies in operating the transportation system. Different modifications and refinements can be tested and compared using analysis and benefit/cost analysis to develop optimal plans to maximize the efficiency of the transportation investment. The typical alternatives analysis process involves testing different operating parameters and the refining of different scenarios through several iterations of analysis, comparison, and adjustment until the resulting operational assumptions and parameters produce the most optimal level of performance, thus maximizing the effectiveness of the transportation investment.
Successful completion of this activity results in a prioritization of potential transportation investments and a clear communication of the potential project benefits. Alternatives analysis represents the culmination of all of the previous analysis tasks; the results can be used to shape investment decisions and to secure deeper and broader support for the project among stakeholder organizations (executive agency leaders and managers, planners, operators, analysts and engineers in these organizations) and elected officials. Analysis managers are encouraged to work with communications professionals to translate technical results into accessible visual and "soundbite" messages that can be shared broadly. The following work steps comprise the alternatives analysis.
Develop Future Baseline Networks and Trip Tables for All Operational Conditions
Once the existing baseline tools have been calibrated, the analysis team can then proceed to develop the future baseline analysis tools. The analysis plan defines all the alternative scenarios that need to be analyzed in this task. Analysis tool networks and trip tables should be modified according to the analysis plan guidelines to represent the scenarios and the impact of the improvement strategies.
Conduct Analysis of Improvement Strategies for All Operational Conditions
The analysis should be conducted using the modified networks and trip tables developed in the previous step. This may include multiple tool runs for each scenario, depending on whether analysts want to conduct additional verification of results—assure results generally are within expected realms (e.g., that Vehicle-Miles Traveled [VMT] results are approximately the same as in the baseline)—and investigate counterintuitive results. All analysis tool runs should be adequately documented to ensure the application of the correct inputs and assumptions according to the analysis plan. Supporting steps for conducting this analysis include:
- Evaluate the initial operational analysis assumptions, scrutinizing the results for any underperforming or counterintuitive metrics.
- Brainstorm a number of causes for the underperformance and a potential set of "what if" adjustments that might be made to alleviate the deficiencies.
- Formulate a set of scenarios that may be evaluated in the analysis structure to assess the impacts and benefits of adjustments to the operational assumptions.
- Analyze, compare, and refine—and re-run through the analysis procedures as necessary—to identify the optimal operating parameters.
- Document the tested scenarios and results for potential future use.
- Re-conduct the refinement process in a continual feedback loop as future conditions change or encountered deficiencies are warranted.
Following these steps helps ensure that the analysis identifies the appropriate technologies and strategies to deploy and that the strategies are operated in the manner that best optimizes the transportation investment.
Assess Performance Measures
In this step, the analysts assess the results of the previous step in light of the performance measures defined in the analysis plan. Below is a summary of how the basic types of performance measures defined in the analysis plan can be calculated to gain insight into overall benefits to system performance:
- Mobility. Three primary types of measures were used in the analysis plan to quantify mobility: travel time, delay, and throughput. Travel time and delay are fairly straightforward to calculate using model outputs. Throughput is calculated by comparing travel times under the incident scenarios to those under no incident. By comparing the percentage of trips under the same threshold travel time in the with- and without-improvement scenarios, the relative influence of transportation improvements on reducing extreme travel times can be estimated.
- Reliability and Variability of Travel Time. Travel-time reliability/variability is reported in terms of changes in the Planning Index or changes in the standard deviation of travel time.
- Emissions and Fuel Consumption. Estimates can be produced by using emissions and fuel consumption rates based on factors such as facility type and vehicle mix, combined with model output, such as travel speed.
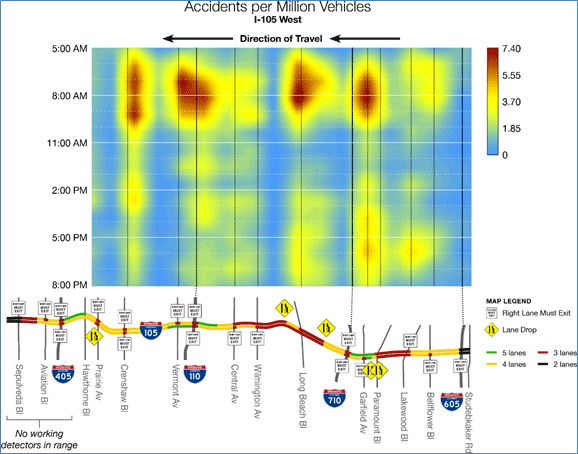
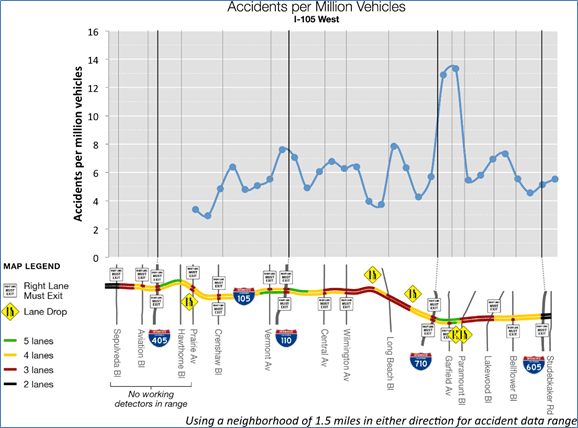
- Safety. Safety is typically measured in terms of accidents or crashes in the study area, including fatalities, injuries, and property-damage-only accidents. Currently available safety analysis and prediction methodologies are not sensitive to transportation improvement strategies. At best, available safety analysis methods rely on crude measures such as Volume-to-Capacity ratio (V/C), or empirical comparison methods, such as identifying safety benefits that result from implementing a certain type of mitigation strategy and applying the same expected improvement rate to a future implementation of the same or similar strategy. Clearly, this is an area deserving new research. Figure 43 and Figure 44 show how existing accident rates can be presented in space and in time and how this depiction can help analysts determine problematic locations and time spans when accident rates are greater than average.
- Cost Estimation. Planning-level cost estimates can be prepared based on life-cycle costs (capital, operating, and maintenance costs). These costs can be expressed in terms of the net present value of various components. Annualized costs represent the average annual expenditure expected to deploy, operate, and maintain the improvement and replace equipment as it reaches the end of its useful life.
Figure 43. Snapshot. Accident rates in space and in time.
(Source: Federal Highway Administration.)
Figure 44. Snapshot. Accident rates by location.
(Source: Federal Highway Administration.)
Conduct Benefit-Cost Evaluation for all Performance Measures
Benefits should be estimated for the improvements by monetizing the incremental change in performance measures associated with the strategies and scenarios analyzed. The incremental change in the performance measure should reflect the weighted sum of changes for all analysis scenarios. The results of this analysis should enable the analysis team to assess the optimal strategies—or combinations of strategies—that can deliver the greatest impact on the corridor's transportation objectives for the cost.
A benefit/cost analysis—a rich analytic method in its own right with its own supporting literature—should be undertaken carefully. A properly calculated benefit/cost analysis monetizes metrics that are comprehensive, mutually exclusive, and designed to render all effects to the appropriate side of the ledger as either a cost or a benefit. There are tools available that provide costs for capital, operating, and maintenance for developing benefit/cost analysis, such as "Operations Benefit/Cost Analysis TOPS-BC User's Manual: Providing Guidance to Practitioners in the Analysis of Benefits and Costs of Management and Operations Projects (June 2013)."
To estimate the benefits in annual dollar values, the annual incremental change in the various performance measures should be multiplied with an estimate of the monetary value of benefits (e.g., the value of an hour of travel time saved). Monetary values of benefits (e.g., value of time, value of accident reduction) should be consistent with those values typically applied in the region. For those performance measures with no established local value, national benefit valuations may be applied.
For the identified improvement strategies, planning-level cost estimates need to be prepared, including life-cycle costs (capital, operating, and maintenance costs). Costs, expressed in terms of an annualized cost or the net present value of various components over a given time horizon (e.g., 20 years), are defined as follows:
- Capital Costs. Include up-front costs necessary to procure and install equipment. These costs are shown as a total (one-time) expenditure and include the capital equipment costs, as well as the soft costs required for design and installation of the equipment.
- Operations and Maintenance (O&M) Costs. Include continuing costs necessary to operate and maintain the deployed equipment, including labor costs. These costs are presented as annual estimates.
- Annualized Costs. Represent the average annual expenditure expected in order to deploy, operate, and maintain the transportation improvement; and replace (or redeploy) the equipment as they reach the end of their useful life. Within this cost figure, the capital cost of the equipment is amortized over the anticipated life of each individual piece of equipment. This annualized figure is added with the reoccurring annual O&M cost to produce the annualized cost figure.
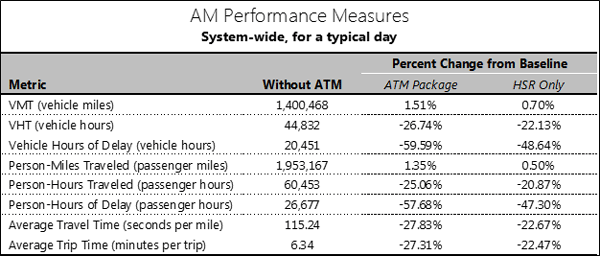
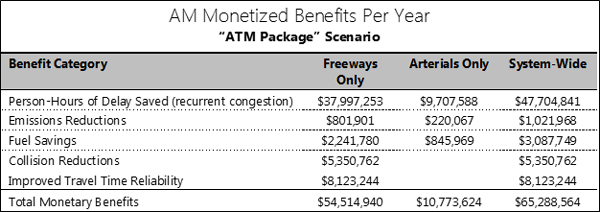
Figure 45 shows an example comparison of two alternatives across various performance measures. Figure 46 illustrates monetized expected benefits for a certain alternative across the same performance measures. The combination of these two exhibits provide the analysts with a comparison of expected improvements resulting from implementation of alternative mitigation strategies based on absolute values of the expected improvements in different performance measures, and monetization of these benefits for different parts of the transportation network.
Figure 45. Chart. Comparison of alternatives across performance measures.
(Source: Federal Highway Administration.)
Figure 46. Chart. Summary of monetary benefits across performance measures.
(Source: Federal Highway Administration.)
Document Analysis Results
Upon completion of the alternatives analysis, the results should be documented in an Analysis Report. The Analysis Report presents performance measures for all alternatives; benefit/cost analysis for each alternative; and a prioritized list of improvement strategies for each scenario. This document should build upon data described in the analysis plan, the data collection plan, and the calibration/validation report. The Analysis Report should function as a stand-alone document that fully encapsulates the process and the results of the analysis.
In creating the Analysis Report, the team should refer back to the analysis plan documentation to make sure that all anticipated analyses have been successfully performed and document any deviations from this plan. The Analysis Report should also document lessons learned through the completion of the alternatives analysis.
In assessing the analysis results, the analysts need to weigh the model outputs carefully against the expected outcomes identified in the analysis plan. Where discrepancies exist, further scrutiny is required to assess whether the unexpected outcomes are a result of discrepancies in the analysis method or whether the expected outcomes were not realistic. If the analyst determines that strange analysis results are a result of analysis discrepancies, modifications to input parameters may be considered and the alternative re-analyzed; however, it is critical that any modifications to the analysis input be carefully documented and presented in the Analysis Report.
Examples on Reporting Results of the Alternatives Analysis
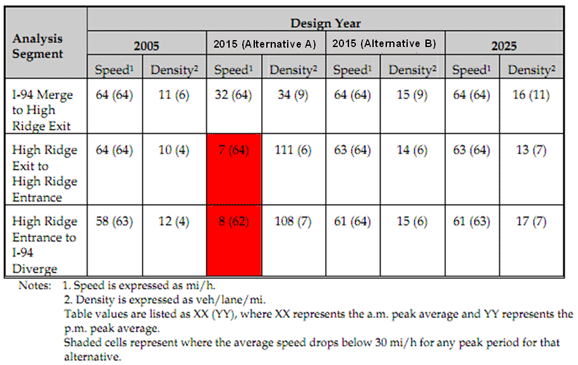
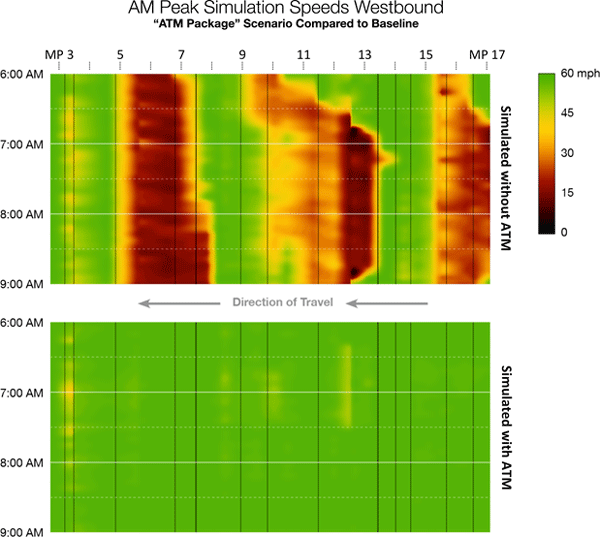
Transportation analysis tools produce many performance measures and data that help provide a quantitative assessment of alternatives. Reducing these data down to a few core tables and visualization of essential information is needed for an effective decision-making process. Figure 47 through Figure 49 are examples of reporting analysis results across different alternatives and network segments, including speeds, densities, and delays.
Figure 47. Chart. Sample measures of effectiveness summary table, Minnesota Department of Transportation/ Federal Highway Administration Traffic Analysis Toolbox Volume IV.
(Source: Federal Highway Administration.)
Figure 48. Chart. Delay Comparison between two scenarios: In vehicle-hours; I‑210 simulation.

(Source: Federal Highway Administration.)
Figure 49. Heat map. Comparison of freeway speeds between alternatives.
(Source: Federal Highway Administration.)
Data, Analysis Tools, and Model Sustainability
Given the dynamic nature of traffic congestion, it is likely that the analysis process will need to be repeated in the future—perhaps as often as every five years—in order to adjust the transportation improvement components to current conditions. The agencies in charge of the analysis must ensure the maintenance of the analysis tools, models, and datasets, greatly reducing the costs, enhancing the ease with which future analyses may be performed, and improving the effectiveness in which future investment decisions are made. The analytical capital accumulated through this continual improvement process serves (depicted as a central component of the 21st Century Analytic Project Scoping Process in Figure 2 in the Introduction of this Guide) not only to improve the analysis that is currently being conducted immediately, but also to enhance analytical capabilities for future analysis of strategies and investments.
Transportation analysis represents a significant investment by the implementing agency. The processes and tools developed for the analysis have numerous potential future applications. Therefore, the datasets and tools developed for the analysis should be carefully archived. Infrastructure must be in place to accommodate analysis tools reuse, and data dictionaries and user guides should be developed in parallel to assist in the future use of the analysis outputs. If the transportation improvements are proven to have significant benefits, there are likely to be calls to expand the study area or apply the strategies to additional areas in the region. Therefore, proper maintenance of the models, tools, and datasets will ensure that these future analyses can be performed at a greatly reduced cost and with improved ease of application.
While maintaining the analysis tools, models, and datasets may require a mindset change for some agencies unaccustomed to these activities, the investment has significant benefits. Continuous improvement may require changes to agency policies, work habits, and data processes and systems. There is a tendency to want to forego this feedback task once the major analysis tasks have been completed. However, this task is absolutely critical to improving the analysis. Therefore, the resources necessary to complete this ongoing task should be planned for in the analysis plan, and analysis managers should devote adequate effort to ensure its full and successful completion.
Lastly, it is important to document lessons learned from the scoping and analysis process to benefit and lower the risk of future scoping and analysis efforts. The lessons learned can relate to the analysis methodology, data sources, the data used to represent different operational conditions, the model's representation of the transportation network, the estimated versus actual cost of the analysis effort, difficulties encountered in the model calibration effort, and skill gaps identified that are needed to improve the effectiveness of the analysis team. Proper documentation of these lessons learned can help future analysis efforts avoid the same mistakes and more effectively conduct future transportation analyses.
To capture these lessons learned and preserve developed analytical capital (models and data), a Project Results Summary document should be assembled covering the following topics (see Table 6).
Table 6. Project results summary elements.
| Project Definition |
A concise statement of the overall system problem including cross-validation and other insights from stakeholders on the nature of the issue and potential solutions. |
| Geographic Scope |
The geographic area covered by the analytical project, including a statement of the required detail of representation within this geographical area. |
| Temporal Scope |
The times of day, days of week, seasonality, and years of operation assessed in the analytical effort. This includes an assessment of the simulation horizon. |
| Hypotheses |
The hypotheses represents the leading underlying cause of the system performance issue. |
| Results Summary |
A text description summarizing the analytical results of the effort. This section should reference the final report that details project findings. |
| Analytical Approach |
A description of the method used for evaluating the effectiveness of the mitigating strategies in resolving the system performance issue. |
| Developed Models |
The one or more tool types used in the analytical approach, and the models developed to represent the system. This section should identify where these data are archived and documented. |
| Data Resources |
A summary of data used to characterize operational conditions, represent alternatives, and model the geographic and temporal aspects of the system. This section should identify where these data are archived and documented. |
| Alternatives Modeled |
Detailed description of the alternative solutions and/or operational practices assessed within the analytical project. |
| Key Operational Conditions |
The set of travel demand, incident, and weather conditions under which a meaningful examination of alternative impacts were conducted. |
| Selected Performance Measures |
The measures of system performance used in the effort. |
| Actual and Expected Costs |
The actual and projected cost of the analytical project, including data collection. |
| Actual and Expected Schedule |
The actual and projected time to conduct the analysis, including data collection. |
| Lessons Learned |
An assessment of lessons learned regarding technical and non-technical issues. |
| Risks |
A summary of risks comprising risks in data collection, technical risks, and non-technical risks—and how they were overcome or mitigated in the effort. |