Transportation Management Plan Effectiveness Framework and Pilot
Chapter 4. Using the Framework to Synthesize Transportation Management Plan Strategy Assessments
Overview
Within an evaluation framework, two types of analyses are needed, depending on the strategies being evaluated and the metric that is used to assess effectiveness:
- Simple aggregation of evaluation results across multiple projects.
- Application of analytical models to extract strategy effectiveness results.
Different approaches are available to answer each of these two questions. To address the first question, researchers or practitioners identify one or more metrics that can be measured and which are known or expected to correlate to work zone impacts of concern (i.e., safety, mobility, customer satisfaction, and construction productivity and efficiency), and perform analyses to determine whether the implementation of a strategy affects that metric in some. In some cases, studies comparing conditions at the work zone before a strategy was implemented to those after the strategy was implemented is a common way to answer this question. The results of multiple studies can be examined, and the range of observed effects determined. When a number of similar studies reach similar conclusions, one can be fairly confident that the strategy does have some type of positive effect, even though it is not possible to predict with any degree of certainty how much of an effect there will be at any future deployment. As an example, a recent guidance document developed under the FHWA work zone safety grant program reviewed multiple studies of speed control strategies, and established a range of speed reductions that can be expected from each strategy type (see Table 5). (11) Although the studies focus on vehicle speed as the evaluation metric of interest, the underlying hypothesis is that reduced speeds result in fewer and less severe crashes.
| Speed Management Technique | Potential Average Speed Reduction |
|---|---|
| CB radio information systems | 0 to 2 mph |
| Narrowed lanes with channelizing devices | 0 to 5 mph |
| Transverse pavement markings | 0 to 5 mph |
| Portable changeable message sign with radar | 0 to 6 mph |
| Drone radar | 2 to 3 mph |
| Transverse rumble strips | 2 to 5 mph |
| Speed display trailers | 2 to 10 mph |
| Law enforcement | 5 to 10 mph |
The information presented in Table 5 represents a single type of data and metric that was evaluated (change in speeds). Not all strategies will be evaluated with identical metrics, or even with all quantitative data. Studies of strategies that target an improvement in driver awareness as a surrogate for improving safety might use vehicle operating characteristics (e.g., speeds, lane encroachments, and braking) or driver characteristics (e.g., eye-tracking, and changes in galvanic skin response measures). In those situations, it is possible to apply triangulation methods to assess whether the multiple approaches used to evaluate a particular strategy reach similar conclusions about that strategy. Triangulation methods have been successfully applied to the task of providing decision support regarding TMP strategy selection for construction activities on high-volume roadways. (12) The advantage of this approach is that it can accommodate both quantitative and qualitative results. However, this level of evaluation does not account for such things as potential marginal benefits of using multiple strategies together (such as law enforcement and speed display trailers from Table 1) or for confounding effects of using similar strategies together (i.e., using both portable changeable message signs with radar and speed display trailers in a work zone would not be expected to achieve 8 to 16 mph speed reductions). Perhaps equally important is the realization that speed reduction as a metric of effectiveness may not necessarily correlate to the real intent for applying the strategy, i.e., to reduce crash potential and severity.
The second type of evaluation approach uses complex analytical methods to directly evaluate how strategies directly influence the main work zone impact dimensions, rather than inferring how they might influence those impacts from surrogate metrics. For example, instead of examining vehicle speed reductions due to the strategies listed in Table 1 and then trying to estimate how much safety is likely to be improved, a statistical predictive model of crashes from many work zones where the different strategies have been implemented would be developed. Parameters computed for the assorted variables included in the model (exposure variables such as work zone length, duration, traffic volumes; strategy variables) and their interactions would be developed which would describe the relative contributions of each to the crashes that occur at work zones.
On the mobility impacts side, data from multiple evaluations of a TMP strategy can be used to develop predictive models of its typical effect across a range of work zone conditions and combinations with other TMP strategies, e.g. To accomplish this, data on those conditions and combinations are required from each project used in the analysis. Furthermore, a range of conditions and combinations are needed in order to assess how the effect of a strategy of interest may vary across those conditions. Although this approach as yet has not been attempted for work zone TMP strategies, an example of this approach would be the development of a model of work zone factors that affect vehicle speeds. (13)
The advantage of these approaches are a direct assessment of the actual mitigation effects of a strategy or set of strategies upon the work zone impacts of concern, as well as a more thorough understanding of the interactions between work zone features and other TMP strategies that may be implemented. Results from these types of evaluations are more useful in future TMP design efforts. Of course, the main disadvantages of these approaches are the level of technical expertise required to build and use the models, and the very large amounts of data that are needed to use them properly.
Synthesis of Past Transportation Management Plan Strategy Evaluations
There has been some, but not an extensive amount of, evaluation of some TMP strategies. A summary of those studies can be found in Appendix D. Most of these have been simpler "did the strategy have an impact" type of assessment for which a synthesis of the range of impacts and/or triangulation across different evaluation metrics is appropriate. There are a few examples where the more comprehensive analytical modeling approach has been used. In the following section, examples of both types for a finite set of TMP strategies have been synthesized.
A review of existing literature and data sources shows that many of the possible TMP strategies have yet to be evaluated in any manner. It is hoped that guidance being developed through this project will be useful to practitioners and researchers in the future for conducting strategy evaluations. Those limitations notwithstanding, the research team did identify the following strategies for which some information does exist. These evaluations are synthesized in this section. Some evaluations are of the simpler "did this have an effect?" type, whereas a few are available to illustrate the more complex modeling approach as well. The following strategies are discussed:
- Usage of work zone ITS to provide real-time traveler information.
- Effect of construction acceleration techniques to reduce project duration.
- Effectiveness of demand management – increase transit service strategy.
- Effectiveness of night work.
- Comparing different lane closure control strategy options considered for a roadway rehabilitation project.
Work Zone Intelligent Transportation System to Provide Real-Time Traveler Information
FHWA is currently encouraging the increased use of technology to improve work zone safety and mobility through the third round of the Every Day Counts (EDC-3) initiative. Efforts to develop and use work zone ITS have existed for nearly 20 years. Early efforts encountered a number of technological issues as well as skeptical perspectives of the benefits that could be achieved relative to their cost of deployment. Fortunately, technological issues have been mostly resolved over time. Enough deployments have occurred to allow an initial evaluation as to whether this strategy is effective when deployed at projects.
The provision of real-time information with these systems has focused mostly on estimating current travel times, delays, or reduced speeds and conveying that information to motorists upstream where they can make a decision to divert to another route if they so desire. Thus, diversion percentages have been a common metric examined to assess their effectiveness. Table 6 provides a summary of study results for this strategy, as well as key caveats noted in the analyses. Some of the evaluations were more robust than others, and some conclusions may be less defensible than others. However, the collective results imply that this strategy can create diversion away from the work zone when congestion is present. The evaluations imply a diversion effect of between 3 and 21 percent, with the median value reported as 10 percent. Only one of the evaluations utilized a before-after study approach across comparable operating conditions through the work zone. It was one of the evaluations that yielded a 10 percent diversion estimate, giving further credibility to that value as indicative of the typical level of effectiveness of this strategy.
| Study | Effect on Diversion | Notes |
|---|---|---|
| Effectiveness of Condition-Responsive Advisory Speed Messages in Rural Work Zones (2002). (14) | Use of an upstream exit ramp increased by 3% when messages posted | Rural interstate location. Presentation of speeds and delays. No comparable before data to know if some change in exit ramp use would have occurred if the system had not been deployed. |
| Diversion from a Rural Work Zone with Traffic-Responsive Message Signage System (2003). (15) | 10% across a key cutline | Rural interstate location. Presentation of travel time to end of work zone. Before-after analysis performed to compare equivalent operating conditions. |
| Evaluation of Effectiveness of Automated Work Zone Information Systems (2005). (16) | Up to 21% during congested times. | Rural interstate. Presentation of roadway "jammed" messages when congested. No comparable before data to know what percent might have been without the system. |
| The Benefits of Using Intelligent Transportation Systems in Work Zones. (2008). (17) | 10% | Rural interstate. Presentation of "Delay Ahead" messages. No comparable before data to know what percent might have been without the system. |
| Reconstruction of Fourteen Bridges on I-93 in Medford Using Accelerated Bridge Construction Techniques (2014). (18) | Estimated 15-20% | Urban freeway. Specific messages not documented. Diversion based on changes in mainlane volumes through project. |
| OVERALL |
Range: 3-21% Median: 10% |
Effect of Construction Acceleration Techniques to Reduce Project Duration
Another temporary traffic control TMP strategy that has received a reasonable amount of attention in recent years is the utilization of construction acceleration techniques to reduce the duration of a project or a particular project phase and its impact upon traffic. Although listed as a single strategy, many different acceleration techniques actually make up this strategy. Recent examples include:
- Use of pre-formed deck panels to accelerate bridge rehabilitation and reconstruction.
- Use of pre-formed roadway slabs to accelerate rehabilitation of concrete pavement.
- Use of slide out-slide in bridge technology to reduce duration of bridge closures.
Table 7 provides a summary of the reductions in project durations that have recently been reported utilizing these techniques. Only two of the three evaluations provided estimates of the traditional methods as a way to assess the relative benefits of this technology. Overall, the evaluations listed illustrate effective project duration reductions. The range of effectiveness is very large, illustrative of the complexities involving in construction.
| Study | Effect on Duration | Notes |
|---|---|---|
| Improvements to the 24th Street- I-29/80 Interchange in Council Bluffs. (2009). (19) | Bridge deck replacement completed in 1 season versus 2 seasons (50% reduction) | Precast bridge deck panels. Included incentives and other contractual items that may also have reduced construction time |
| Reconstruction of Fourteen Bridges on I-93 in Medford Using Accelerated Bridge Construction Techniques (2014). (18) | 14 bridges replaced in 5 months versus 48 months otherwise (89% reduction) | Precast bridge elements. Included design-build contracting to reduce overall time. Actual replacement time of all bridges was 550 hours (39 hours per bridge). |
| Alternate Project Delivery and Accelerated Bridge Construction on OR 38, Drain to Elkton (2013). (20) | Replacement of 5 bridges reduced by one year | Precast bridge components, slide-out slide in bridge replacement technology. |
| OVERALL | Range: 50-89% reduction |
Effectiveness of Demand Management – Increase Transit Service Strategy
Demand management strategies are another key component available to TMP developers and implementers. Most metropolitan areas have well-established transit service and ridesharing programs. Efforts are often made to increase utilization of these programs during construction as a way to reduce vehicular travel through and around the work zone and ultimately lower mobility impacts associated with a work zone. Table 8 provides a synthesis of one particular demand management strategy, efforts to increase transit service capacity.
Often, multiple demand management strategies are implemented together in a coordinated manner as part of a TMP to encourage reduce vehicle utilization in the corridor. As stated previously, the combined effect of these individual strategies usually requires that they be evaluated as a system, rather than as individual contributions to the overall effect. Also, effectiveness is usually measured in terms of increased ridership. As Table 8 illustrates, efforts to promote additional ridership during construction have yielded fairly small changes across the various projects examined. One of the items missing from the various data sources reviewed was an assessment of the level of transit utilization that existed in the corridor prior to the start of construction. Generally, it is difficult to get travelers out of their personal vehicles and to use transit options.
| Study | Effect on Ridership | Notes |
|---|---|---|
| The Case of Poston's Southeast Expressway (1985). (21) | 147 trips per day decrease | 160,000 vehicles per day facility |
| Traffic Management During Reconstruction of I-91 in Connecticut (1987). (21) | 330 trips per day increase | 180,000 vehicles per day facility |
| Traffic Management for Major Freeway Reconstruction: I-94 Menomee Valley Bridge, Milwaukee (1984). (21) | 1,100 trips per day increase | 125,000 vehicles per day facility |
| Go Triangle/Go Durham Transit Agency Data During the Fortify 40 Project (2015). (22) | 433 trips per day increase | 113,000 vehicles per day facility. $12 million allocated to increase bus transit service in corridor |
| OVERALL |
Range: -147 to 1,100 trips per day increase Median: 433 trips per day increase |
Effectiveness of Night Work
As traffic volumes and congestion have continued to grow nationally, the restriction of maintenance, utility, and construction activities that requires the temporary closure of a travel lane to nighttime hours have become more and more popular. Many agencies have policy restrictions to this effect in force within their jurisdictions, and take significant steps towards developing and implementing projects that can be accomplished by avoiding lane closures during daytime hours.
From a TMP perspective, the rationale for pushing lane closures to nighttime hours is simple. Traffic volumes are significantly lower at night than they are during the daytime, especially on week days. The amount by which moving to nighttime hours can avoid mobility impacts depends on traffic volumes on a facility, the number of lanes normally available for travel, the hours at night when lanes are allowed to be closed, and the number of lanes closed. In some densely-populated areas, congestion caused by a temporary lane closure cannot be avoided, even at night. However, the magnitude of congestion will be much less.
Although the mobility benefits of night work are readily apparent, the safety implications are not. Visibility is degraded while driving at night, which is especially a concern for older drivers, and the prevalence of drowsy or otherwise impaired driving tends to be higher as well. As a result, the relative risk of driving at night is higher (in terms of crash risk per mile driven) than it is during the day. However, from the perspective of the selection of night work as a TMP strategy, the question is whether the total societal costs that are incurred while working at night are greater or less than performing the same work during daytime hours. A National Cooperative Highway Research Program (NCHRP) project performed to answer that question provides an example of the more complex analyses that are required to assess the safety implications of TMP strategy choices. (23)
In that study, researchers gathered data from 92 projects in four states, representing 500 miles of roadways and over 80 years of project time. Over 17,000 crashes were included in this dataset. For each project, inspector diaries were reviewed to identify days and nights when:
- No work was occurring (the work zone was inactive).
- Work was occurring but no temporary lane closures were in place.
- Work was occurring that required a temporary lane closure.
Researchers stratified each project accordingly. Empirical-Bayesian statistical techniques were applied to estimate normal expected crash frequencies during the various time periods, and crash modification factors (CMFs) were developed for each condition for both daytime and nighttime operations. The results are summarized in Table 9. Interestingly, similar CMFs were found for both daytime and nighttime work hours when a temporary lane closure was required. Higher CMFs were found during the nighttime hours when lanes were not temporarily closed when compared to similar conditions during the day.
| Work Condition | Daytime | Nighttime |
|---|---|---|
| No work occurring | 1.127 (0.014) | 1.237 (0.029) |
| Work occurring but no temporary lane closures in place | 1.314 (0.027) | 1.577 (0.148) |
| Work occurring in temporary lane closures | 1.663 (0.073) | 1.609 (0.057) |
Utilization of these CMFs as part of TMP development requires the practitioner to have a baseline estimate of crash frequency for their project location. Depending on the relative amounts of work to be performed under the above conditions versus the amount of time the project will be in place but not active, an overall estimate of crash frequency increases can be estimated from this evaluation.
Comparing Different Lane Closure Control Strategy Options Considered For a Roadway Rehabilitation Project
The final TMP strategy evaluation is also an example of the use of advanced modeling techniques for evaluating the effectiveness of a particular TMP strategy. Specifically, the use of traffic simulation tools to assess the likely impacts of alternatives, and an assessment of how well that assessment is matching actual conditions. (24,25,26) The decision about how to maintain traffic through the work zone project is one of the earliest and most fundamental decisions that has to be made in the project design process.
The I-40/I-440 project in North Carolina was a design-build concrete pavement rehabilitation project that had to be accomplished without the benefit of widening the roadway at the same time, and having new pavement on which to place traffic while the existing pavement was replaced. Appendix E provides a summary of the project, analyses performed, and an assessment of how actual impacts have compared to the analyses. Traffic impacts were expected to occur throughout the network, although the extent and location of those impacts were not known. Thus, the use of traffic simulation analysis with dynamic traffic assignment capabilities that could capture the interactions between changes in operating conditions due to the work zones and changes in motorist trip-making decisions was a wise choice. (27)
The project analysts constructed a network model of the Raleigh-Durham region for use in a mesoscopic traffic model that provided dynamic traffic routing in response to changes in traffic conditions in the network. They performed a series of analyses and concluded that the maintenance of three lanes through the project in each section was substantially preferable to keeping only two lanes open per direction. Maintaining three lanes per direction during construction was ultimately the option selected by the department.
Following project initiation, the analysts continued monitoring traffic conditions in the corridor. Their summaries are then compared with their original estimates. In this way, the actual data serves as a validation of their conclusions reached during the impacts analysis computations. The primary measure of effectiveness that can be compared is that of travel times through the corridor along the work zone (analysts are not monitoring actual travel times on the alternative routes in the corridor). Two routes of interest were modelled during the impact analyses and are also being monitored during construction, as shown in Figure 3.
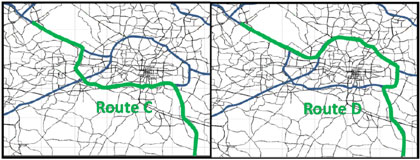
Figure 3. Map. Routes used for comparing travel times, predicted to observed.
The travel times predicted by the simulation tool were only marginally different than the baseline (pre-work zone) travel times in the corridor (see Table 10). For the most part, the magnitude of diversions predicted to occur offset the reduction in lane capacity through the project, and so the predicted travel times remained close to those existing prior to the start of construction. However, travel time data actually collected through the project on a weekday were found to be somewhat greater than was predicted or what existed prior to the start of construction. Unfortunately, information on any crashes or other incidents that may have also affected travel on this particular day were not available.
| Route, Peak Period, and Direction | Baseline (Pre-Work Zone) Travel Times, Min | Predicted Travel Times (with diversion), Min | Observed Travel Times, Min |
|---|---|---|---|
| Route C, AM Peak, Westbound | 27.5 | 29.7 | 33.6-50.2 |
| Route C, AM Peak, Eastbound | 25.9 | 26.0 | 26.8-30.3 |
| Route C, PM Peak, Westbound | 26.4 | 26.3 | 37.2-40.4 |
| Route C, PM Peak, Eastbound | 26.9 | 31.2 | 54.7-66.0 |
| Route D, AM Peak, Westbound | 30.1 | 30.0 | 39.9-48.3 |
| Route D, AM Peak, Eastbound | 29.3 | 29.5 | 29.6-36.2 |
| Route D, PM Peak, Westbound | 36.7 | 29.4 | 40.8-59.6 |
| Route D, PM Peak, Eastbound | 30.7 | 30.3 | 52.9-89.6 |
The analysts are also monitoring traffic volumes on I-40/I-440 during construction and estimating observed diversion rates. Comparisons of diversion rates estimated via simulation to those actually being observed during the first part of work (in area 3) are provided in Table 11. Based on the data collected, it appears that the analytical model predicted a greater amount of diversion to other routes than what has actually occurred at the projects. Analysts have hypothesized that a significant amount of departure time diversion is occurring in lieu of route diversion as was predicted by the model. In other words. Rather than seeking out a different route for their peak period trips, more commuters are simply adjusting when they start their trip.
| Period and Direction | Predicted Diversion | Observed Diversion |
|---|---|---|
| AM Peak Period-Westbound | 17-33% | 19% |
| PM Peak Period-Eastbound | 17-32% | 16% |
This comparison of predicted to actual condition emphasizes the importance of project and TMP monitoring and evaluation to improve understanding of the limitations of analytical tools and to determine how TMP strategy decisions actually affect safety and mobility impacts caused by work zones. To date, North Carolina Department of Transportation (NCDOT) has not made major changes to their TMP. The regional transit agency has made minor modifications to the increased transit service that was implemented, eliminating a few routes that had been initiated to provide an alternative to automobile travel through the project but which were never utilized to any meaningful degree.
Previous | Next