Transportation Management Plan Effectiveness Framework and Pilot
Appendix E. Transportation Management Plan Strategy Development and Evaluation Example: I-40/I-440 ("Fortify 40") Pavement Rehabilitation Project, Raleigh, NC
An illustration of a pre-project Transportation Management Plan (TMP) impact analyses and during-project monitoring to assess the validity of the strategy estimates is the ongoing design-build rehabilitation project being performed by the North Carolina Department of Transportation (NCDOT) on an 11.5 mile stretch of I-40/I-440 in Raleigh, NC. This section of freeway serves between 90,000 and 113,000 vehicles per day, and creates recurrent congestion in several sections within the project limits. The project includes replacement of existing concrete pavement that has deteriorated over time, extension of auxiliary lanes between some ramps, extension of a deceleration lane to better accommodate exiting traffic demands, and rehabilitation of 14 bridges within the project limits. An initial stage replaced a 3-mile section east of the interchange to serve as a better diversion route when the remaining segments are being rehabilitated. The remaining project stage 2 got underway in late 2014 and is scheduled to be completed in late 2016 or early 2017. Figure E-1 illustrates the limits of the project.
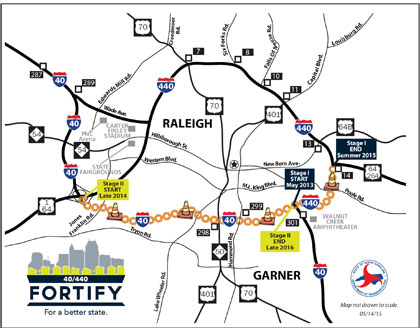
Figure E-1. Map. The Forty 40 Project Limits. (63)
Since the project is primarily a rehabilitation effort and not a widening activity, it presented a challenge in terms of how to accommodate the lane closures that would be required to break up and remove the pavement, place new concrete, and reopen the lanes to traffic. This stretch of interstate varies in cross-section from three to four lanes in each direction. The roadway does drop to two through lanes through the I-40/I-440 interchange, and does have some areas where there is an auxiliary lane between adjacent on and off ramps that essentially create a 5-lane cross section. Figure E-2 illustrates the lane geometries of this segment of roadway. (64)
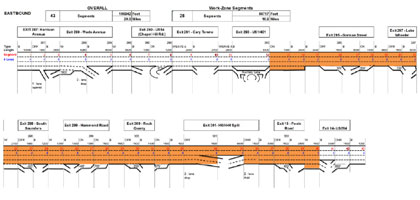
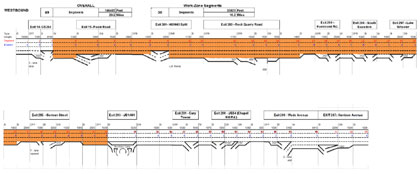
Figure E-2. Diagram. Lane geometries for the project. (64)
Researchers at the Institute for Transportation Research and Education (ITRE) at North Carolina State University were contracted to evaluate the potential traffic impacts that would arise from various lane closure strategies that were being contemplated for the project. Researchers developed a mesoscopic traffic simulation model of the Raleigh, NC roadway network in DynusT, which was extracted large from the Triangle Regional Model. The model was set up to examine both the morning and evening peak periods. Researchers examined both a no-diversion scenario and a user-equilibrium scenario for each period. A second model, DTALite, was also employed to provide additional insights into how motorist might respond to conditions arising from the different lane closure configurations being contemplated. The FREEVAL model developed by the researchers on another project was also used to evaluate traffic operations details under the no-diversion scenario.
A total of seven work zone lane closure scenarios were examined with these models:
- Westbound with 2 lanes remaining open throughout the project limits, and an offshoot of this option to increase the number of lanes open in the few weaving areas;
- Eastbound with 2 lanes remaining open throughout the project, and an offshoot with an additional lane kept open in the weave areas (note that this option would require the contractor to put one lane of traffic onto the shoulder between mile marker 301 and the I-40/I-440 interchange);
- Westbound with 2 lanes kept open where 3 lanes originally existed, and 3 lanes open where there was normally 4 or 5 lanes;
- Eastbound with 2 lanes kept open where 3 lanes originally existed, and 3 lanes open where there was normally 4 or 5 lanes (this option would also require the contractor to put one lane of traffic onto the shoulder between mile marker 301 and the I-40/I-440 interchange);
- Westbound with 3 lanes kept open throughout;
- Eastbound with 3 lanes kept open throughout (this option would also require the contractor to put one lane of traffic onto the shoulder between mile marker 301 and the I-40/I-440 interchange);
- Eastbound with a cross-over section towards one end of the project (this option would also require the contractor to put one lane of traffic onto the shoulder between mile marker 301 and the I-40/I-440 interchange).
The researchers examined the peak period "normal" conditions as well as potential incident scenarios that could arise and block additional lanes during a particular peak period. A series of travel "routes" were established to assess how the project would affect different subsets of users traveling partially or wholly through the project.
Overall, the analyses indicated that diversion rates of 33 percent for the 3-lane work zone configurations would possibly occur, and 56 percent diversion rates would occur for the 2-lane configurations. Even with these diversion rates, the models estimated that westbound travel times would increase between 8.6 and 15.1 minutes for the 2-lane configuration, and 12.7 minutes for the 3-lane configuration. Considerable variability was evident in the analysis results, as the different configurations generated different queue spillback patterns. These levels of diversion resulted in significant (up to 115 percent) estimated volume increases on several adjacent arterial streets, 44 percent increases in travel times on some of those arterials. The conclusion of the research team was that maintaining three lanes during construction was highly desirable.
Ultimately, NCDOT officials opted to go with the 3-lane open option. Traffic control plans obtained from the project indicate that lanes are being narrowed to 11 foot, and shoulders reduced down to as narrow as 2 foot depending on location within the project. Figure E-3 illustrates a typical cross-section through the project. (65)

Figure E-3. Diagram. Typical cross-section of project. (65)
From the TMP perspective, officials implemented a significant public information outreach effort as well as improvements to public transit service in the region in the hope of encouraging motorists to utilize buses and carpools during construction, for example. A project website was established to help keep the public up-to-date and encourage use of alternative travel modes during construction. Figure E-4 illustrates the website and other public information initiatives that were implemented.
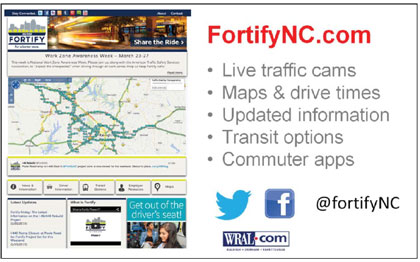
Figure E-4. Screenshot. PowerPoint Slide from a Fortify 40 Project Employer Resource. (66)
A total of $12 million was allocated to the transit improvements. The goal was to remove at least 30,000 cars from the corridor during the peak periods. According to information received from the regional transit agency, 5 bus routes were added/modified as part of the Fortify project. All new service was provided during peak hours only (M-F, 6:00-9:00am, 3:30-6:30pm):
- Additional frequency from once every 60 minutes to once every 30 minutes on existing Route ZWX (Zebulon/Wendell-Raleigh Express). Note: this was implemented Dec 2013 but eliminated Jan 2015 due to low ridership on additional trips (the 60 minute frequency was maintained and is a productive service).
- 30-minute frequency on Route JCX (Johnston County-Raleigh Express). Implemented Dec 2013.
- 30-minute frequency on Route CLX (Clayton-Raleigh Express). Implemented January 2015
- 30-minute frequency on Route CTX (South Cary-Raleigh Express). Implemented January 2015. Eliminated November 2015 due to low ridership.
- 30-minute frequency on Route 300 (Downtown Cary – downtown Raleigh). Implemented January 2015.
In addition, state employees can receive free bus passes if they work in the county where construction is occurring. The agency does not track carpools but is attempting to survey individuals who have contacted them about assistance in finding a carpool to see if they were successful or not.
Somewhat surprisingly, despite the expectation for substantial diversion in the corridor, it does not appear that many TMP strategies related to improvements of alternative routes were pursued in the corridor.
In terms of actual effectiveness of the strategies implemented, ITRE researchers have been monitoring and evaluating the impacts of construction actually occurring during the project. Two types of measures have been tracked:
- Peak period and peak hour volumes on I-40 and I-440 to estimate diversion that was occurring away from the project limits;
- Travel times approaching and passing through the project limits in both eastbound and westbound directions.
In terms of diversions away from the project, ITRE researchers are monitoring four-hour morning and evening peak period volumes at points entering the construction area from the south, east, and west. Figure E-5 illustrates the sensor locations being monitored. Although it is labeled as Area 3, the location to the east of the I-40/I-440 interchange was the first section that underwent construction starting in May 2013.

Figure E-5. Map. Volume sensor locations monitored during construction. (64)
Data are being monitored for calendar years 2013, 2014, and 2015. Overall, the data indicate diversion did occur away from the corridor over the years of construction at some locations. (67) ITRE researchers estimate that volumes decreased by 15.2 percent during Area 3 work, and by only 2.3 percent during work in Areas 1 and 2. When examined on a sensor-by-sensor basis, volumes at sensor 1 were 18.5 percent lower during work in Area 3, 10.4 percent at sensor 2, and 16.3 percent at sensor 3. In contrast, it was estimated that volumes were only 2.1 percent lower at sensor 1 during work in Areas 1 and 2, unchanged at sensor 2, and 5.3 percent lower at sensor 3. It is hypothesized that the impacts are less severe within Areas 1 and 2, and so motorists have gravitated back towards the corridor during work in these areas.
Travel times along I-40 and I-440 are also being monitored during construction and compared to baseline travel times prior to the start of construction (68). A number of route trips are being monitored to reflect the range of trips being made through the project limits. Figure E-6 and Figure E-7 depict those trips. In the morning peak period, travel times for traffic heading north and west through the project were most significantly affected in November 2015. As Figure E-8 illustrates, trips 6 and 10 experienced 13 to 18 additional minutes of travel relative to baseline conditions prior to the start of construction in Areas 1 and 2. In the evening peak period, trips westbound (particularly trip 1, trip 5, and trip 11) experienced the greatest added delays. As shown in Figure E-9, delays during the evening peak period reached 34 minutes for trip 1, 17 minutes for trip 5, and 53 minutes for trip 11.
Meanwhile, the transit agency has been monitoring bus ridership to assess whether the strategies are achieving the desired goal of reducing automobile trips. In general, the agency believes that ridership in the corridor has been trending up slightly during the project for a few of the routes, but not significantly so. As noted above, some of the additional routes have actually experienced downward trends, and were discontinued. Figure E-10 and Figure E-11 illustrate the trends in ridership observed. Overall, it does not appear that the efforts to improve transit service and achieve increased transit usage is being realized to a significant degree in the corridor, certainly not to the degree that have occurred in freeway volumes approaching and within the project limits.
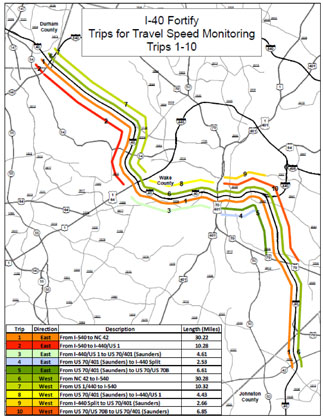
Figure E-6. Map. Route trip travel times monitored during construction in areas 1 and 2. (68)
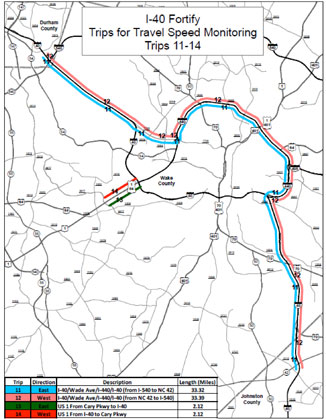
Figure E-7. Map. Route trip travel times monitored during construction in area 3. (68)
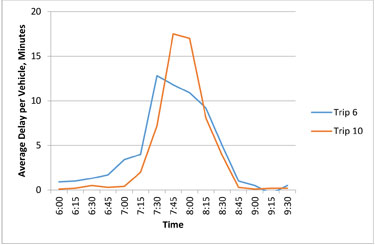
Figure E-8. Chart. Route trip delays during AM peak (adapted from 68).
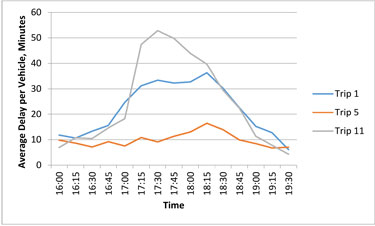
Figure E-9. Chart. Route trip delays during PM peak (adapted from 68).
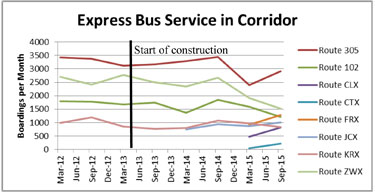
Figure E-10. Chart. Express Bus Transit Usage Trends in Corridor. (69)
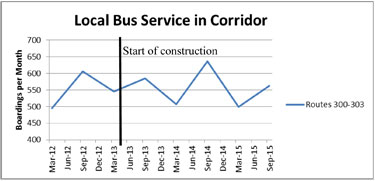
Figure E-11. Chart. Local Bus Transit Usage Trends in Corridor. (69)
U.S. Department of Transportation
Federal Highway Administration
Office of Operations (HOP)
1200 New Jersey Ave., SE
Washington, D.C. 20590
www.ops.fhwa.dot.gov
June 2016
FHWA-HOP-16-062