Use of Narrow Lanes and Narrow Shoulders on Freeways: A Primer on Experiences, Current Practice, and Implementation ConsiderationsChapter 4. Analyzing the Effects of Narrow Lane and Shoulder WidthAs previously discussed, Performance-Based Practical Design (PBPD) and Performance-Based Planning and Programming (PBPP), plus the "objectives-driven, performance-based approach" to planning for operations, are all very compatible and consistent with one another. They also contain the term "performance-based;" and one of the key activities in all three approaches is to analyze and evaluate the resulting performance of various alternatives and strategies and how well they will meet the purpose and need of the project. From the perspective of narrowing lanes and/or shoulder widths to provide additional capacity within the existing footprint of an urban freeway, the operational and safety effects are perhaps the most critical aspect of this evaluation. This chapter provides an overview of some of the tools and analysis methods that can be used to estimate these effects. Operational EffectsBy definition, adding a travel lane — whether permanently or part time (as is often the case with shoulder use) — will increase overall roadway capacity, thereby reducing recurring congestion and improving operations. However, with narrower lanes, vehicles are traveling in closer proximity to each other, increasing the likelihood of lower speeds. Evaluations of narrow lane operations from the literature — as summarized in Table A-1 in the Appendix and as described in the case studies from the previous chapter — bear this out. The Level of Service (LOS) is generally improved, but with a slight reduction in average speed. Analyzing Operational Impacts
Adding a lane by narrowing the existing
lanes and shoulders generally improves
operations and level of service, but with
a decrease in average speeds.
The PBPD approach includes the evaluation of alternative solutions and making tradeoffs and decisions based on an objective analysis of performance data. The most recent version of the Highway Capacity Manual (HCM – Reference 18) includes information that can be used to estimate the operational impacts of additional, but narrow, lanes. For example, Table 7 shows the relationship between freeway lane widths, lateral clearances, and the resulting capacity and Free Flow Speed (FFS). As shown in this Table, a reduction in lane widths to less than 12′ will result in a reduction in free-flow speed. This reduction in free-flow speed does reduce throughput of an individual lane; but the additional lane more than offsets this loss in "per lane" throughput and capacity. Adjustments should also be made to estimated FFS and lane capacity for lateral clearances if the width of the right side shoulder is reduced to accommodate an additional general purpose lane, or if the shoulder itself is used as a travel lane during parts of the day. Lateral clearance is measured from the right edge of the travel lane to the edge of the paved shoulder. As shown in Table 8, if the right-side lateral clearance is greater than or equal to 6 ft., no reduction in freeflow speed is made. The amount of free-flow speed reduction increases as the right-side lateral clearance decreases. The HCM assumes that left-side lateral clearance is greater than or equal to 2 ft. for all cases.
Adding a lane within an existing roadway footprint will typically involve both the narrowing of the travel lanes and a reduction in shoulder width (and the associated right side lateral clearance). For example, consider a scenario where a directional roadway is converted from three 12 ft. lanes and a 10 ft. right shoulder to four 10.5 ft. lanes with a 4′ shoulder as shown in Figure 13.
Per the information in Tables 7 and 8, this example narrow lane conversion will reduce the free flow speed by an estimated 7.0 mph (6.6 mph from Table 7 plus 0.4 mph from Table 8). Using the maximum service flow rates from HCM Exhibit 11-17 (recreated in Table 9 below), and assuming a 10 mph reduction in FFS from 65 to 55 MPH (somewhat larger than the 7.4 mph value from Tables 7 and 8) and a target LOS D, the per-lane capacity will be reduced 6.4 percent from 2030 pc/hr to 1900 pc/hr (as highlighted in blue). However, converting this directional roadway from three lanes to four narrower lanes increases the total estimated directional throughput from 6090 pc/hr (2,030 X three lanes) to 7600 pc/hr (1,900 X four lanes) — nearly a 25 percent increase.
It is critical to remember that when using tools such as the HCM, the baseline values and the adjustment factors — such as those shown in Tables 8 and 9 — are statistical estimates or expected values. Moreover, it is important to remember that while the HCM can give close approximations to changes in FFS, the speedflow curves have not been calibrated with real data for different (i.e., narrower) lane widths, and their true impact on driver behavior and the resulting capacity cannot be known for sure. As such, the HCM and other analytical tools should not be viewed as 100 percent accurate prognosticators of future conditions. The actual impact of narrow lanes may be expected to vary around the estimated values, dependent on a variety of factors. Decisions supported by the results of these analytical tools involve some degree of uncertainty, and engineering judgment is required as part of the overall PBPD process. Impact of Trucks on Narrow Lanes OperationsOne such area of uncertainty involves the operational impacts of trucks on narrow lanes operations. As discussed in NCFRP Report 31 – Incorporating Truck Analysis into the Highway Capacity Manual (Reference 22), most HCM chapters — including freeway — convert heavy vehicles5 to equivalent Passenger Car Equivalent (PCE) units6 (passenger cars per hour per lane) and add them to the passenger car volumes to obtain the total equivalent passenger car volume that is used in the HCM methodologies. The HCM analysis then estimates the capacity, density, speed, delay, and LOS for the equivalent passenger car stream. Truck speeds and delays are not isolated from the values predicted using the equivalent passenger car stream performance. The NCFRP Report evaluates the 2010 HCM from two perspectives: its ability to predict the specific performance of trucks, and its ability to model the effects of trucks on the traffic stream. Regarding the ability of the HCM to model the effects of trucks on the traffic stream NCFRP report states the following:
Thus, while narrow lanes are addressed in the HCM, their impact on truck operations is not addressed other than incorporating an increase in PCE's, which in turn may result in a further decrease in LOS and speeds that may not be reflected in the narrow lanes analyses. SafetyThe consideration of safety is arguably the primary issue involved in a PBPD-based analysis and subsequent decision to include narrow lanes and/or shoulders in a roadway design (and to subsequently approve a design exception). Evaluations of the safety of narrow lanes from the literature — as summarized in Table A-2 in the Appendix and as described in the case studies from the previous chapter — show mixed results; although there appears to be a general tendency for the frequency (or number) of crashes to increase with a narrowing of lanes and shoulders (although not always); while the crash rate (e.g., number of crashes per million vehicle-miles) often decreases (again, with exceptions). It may be that even with an increase in the number of crashes, the additional throughput provided by the extra lane results in an even greater increase in the denominator of vehicle-miles of travel, resulting in a decreased crash rate7 . There are undoubtedly several other factors that can impact crash frequency and rates associated with narrow lanes — such as volumes, speeds, the resulting decrease in congestion and improved traffic flow, the length of the narrow lane segment, horizontal and vertical curves, percentage of heavy vehicles in the traffic stream — which may explain the variations in results between different studies of the safety impacts of narrow lanes. Additionally, comparing studies and findings in terms of their statistical significance is difficult due to the different approaches used for statistical analysis. As was the case with the operational analyses, the designer should address the entire network and system as part of the PBPD process, making sure that implementing narrow lanes to improve throughput in one segment doesn't increase congestion in a downstream segment potentially resulting in an increased number of crashes in that segment. Analyzing Safety Impacts
When reviewing and comparing safety
studies of narrow lanes, it is important
to note which specific measures were
used in the study:
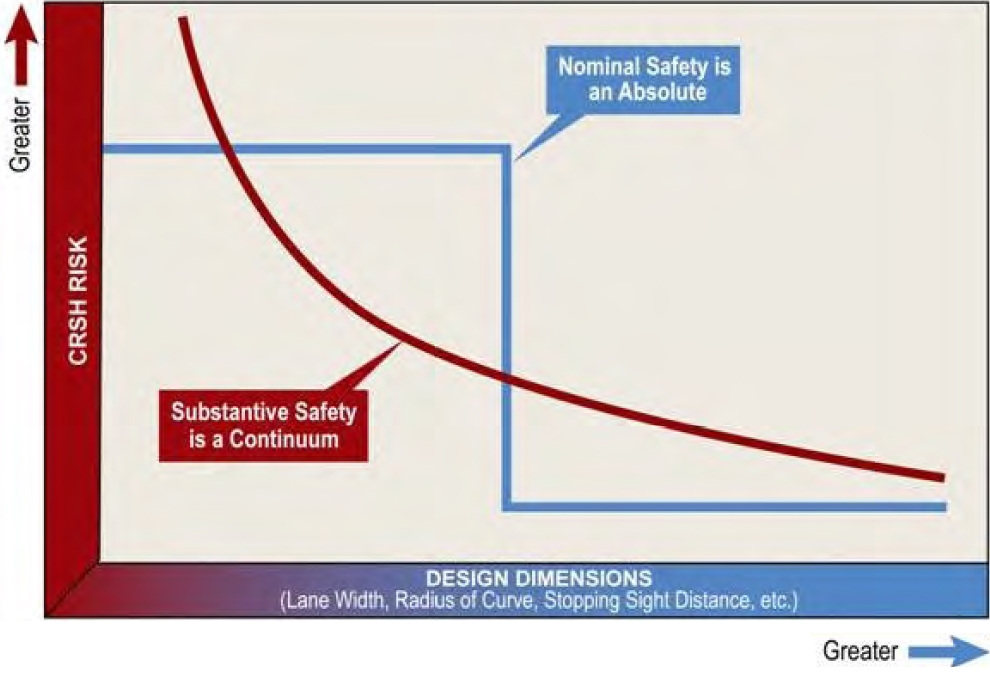
In performing a safety analysis of alternative lane and shoulder configurations and widths (as part of the PBPD process), it is important to understand the relationship of safety to design criteria and standards, along with the concepts of nominal and substantive safety as shown in Figure 14 and discussed below. Nominal SafetyThe concept of nominal safety is a consideration of whether a roadway, design alternative, or design element meets minimum design criteria. According to this concept, a highway or proposed design is considered to have nominal safety if its design features (such as lane width, shoulder width, lateral clearance, etc.) meet the minimum values or ranges. The measure of nominal safety is simply a comparison of design element dimensions to the adopted design criteria; an "either – or" scenario where a design feature either meets minimum criteria or it does not. Thus, narrowing one or more lanes of an urban freeway to less than the standard 12 ft. width (per the Green Book) would not meet the concept of nominal safety.
Substantive SafetySubstantive safety is defined as the expected, or estimated long-term average, safety performance of a roadway. The concept of substantive safety encompasses methods for estimating the following expected quantitative measures:
Understanding a location's substantive safety and making judgments about whether it meets expectations may involve formal comparisons of its crash profile with aggregate data for facilities with similar characteristics (e.g., traffic volumes, number of current and proposed lanes and widths, location (urban, rural, suburban), inclusion of TSMO strategies, and terrain); predictive methods such as those presented in the AASHTO Highway Safety Manual (HSM); or some combination. In evaluating project alternatives from a substantive safety perspective, the practitioner is interested in the future safety performance of a facility and comparing that future performance for alternative geometrics, lane and shoulder widths, operational strategies, etc. Crash history is used to identify and diagnose safety concerns on an existing facility; but it may not be the most accurate approach for estimating long-term average safety performance. The HSM argues for the value of using predictive methods in addition to crash history, to improve accuracy and precision of estimates. Highway Safety ManualThe HSM (Reference 20) complements design guidelines, such as the AASHTO Green Book, by allowing a more scientifically rigorous methodology to quantify the "safety effects" of various design choices as part of the PBPD process. The 2014 Supplement to the HSM, 1st Edition, provides a structured methodology and specialized procedures to estimate the expected average crash frequency for various freeway facilities. The HSM freeway chapters provide Safety Performance Functions (SPF) for 4- to 10-lane freeway facilities that account for several variables that need to be considered when looking at cross-section alternatives, including the following:
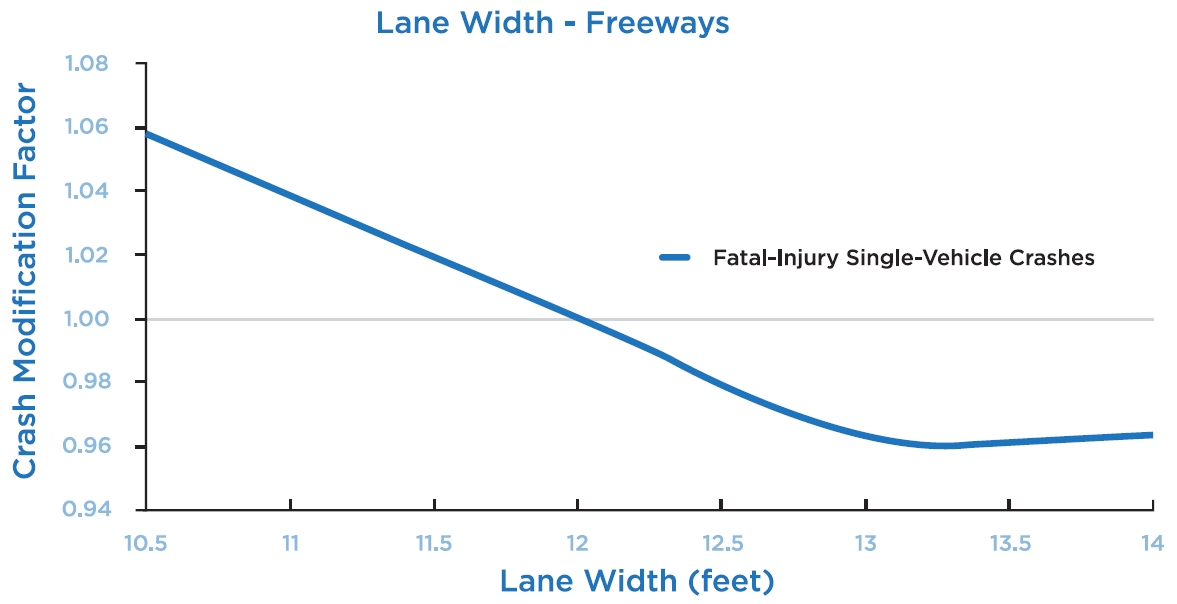
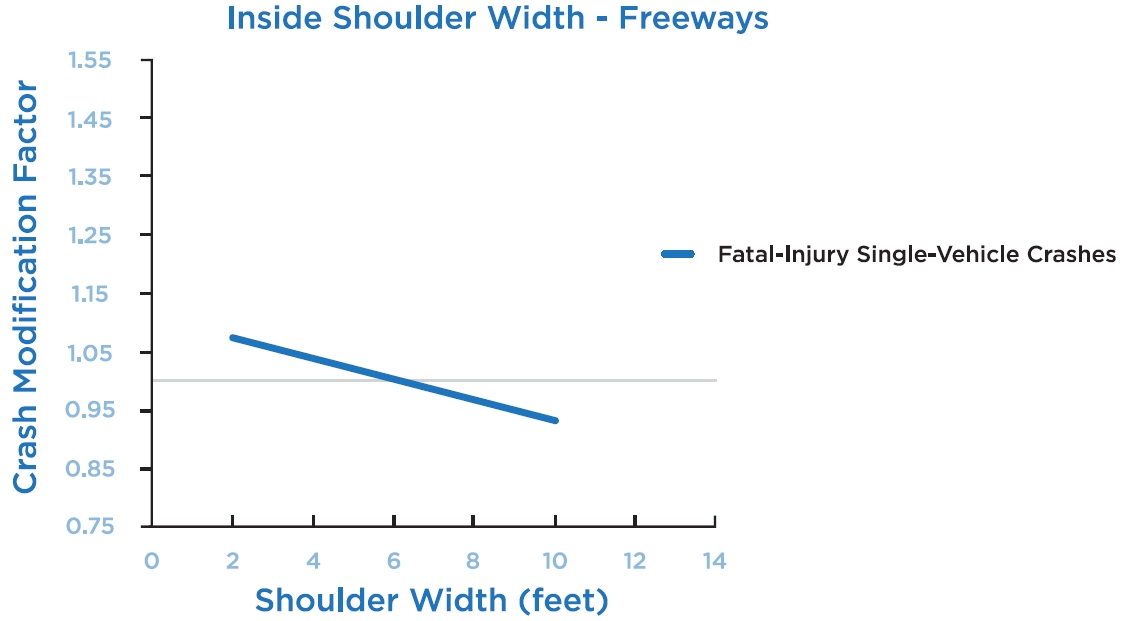
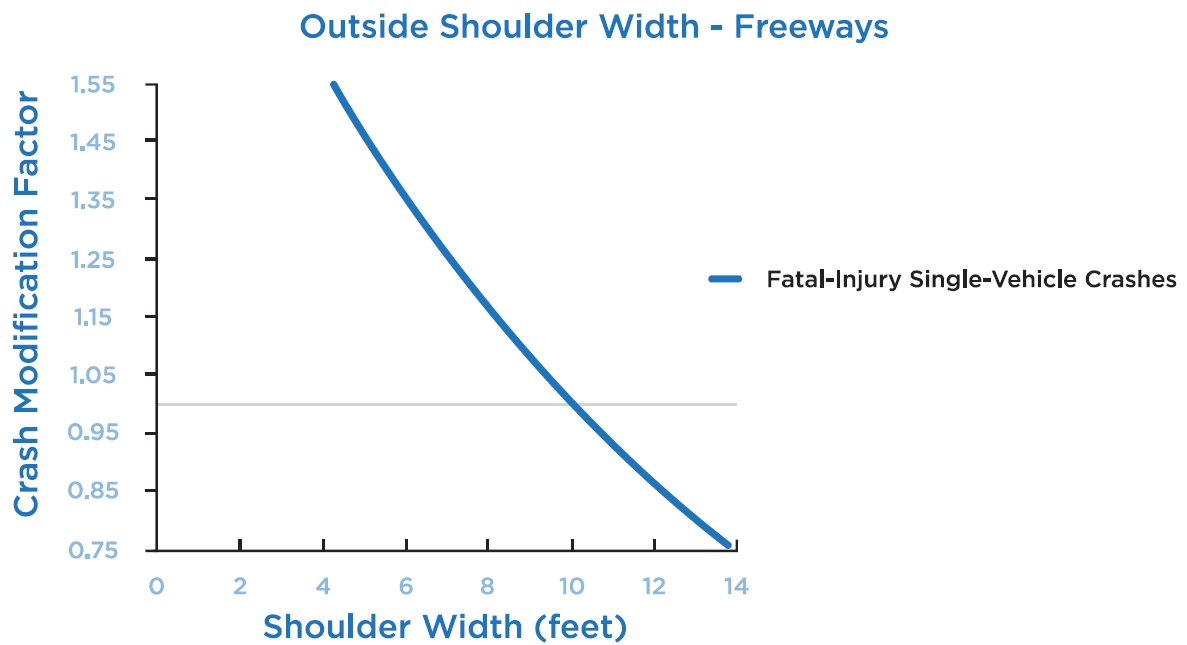
The HSM also provides Crash Modification Factors (CMS's) for various roadway treatments. These are used to estimate the expected number of crashes after implementing a given treatment. A CMF less than 1.0 — the value that corresponds to a 12-ft. lane width for freeways, a 6-ft. width for inside shoulders, and a 10-ft. width of outside shoulders — indicates that a treatment has the potential to reduce the number of crashes. Figures 15–17 show the CMF's for lane widths, inside shoulder widths, and outside shoulder widths, respectively. Looking at the CMF alone, narrowing a freeway lane to under 12 ft. and/or narrowing the outside shoulder to less than 10 ft. will result in an increase in the number of crashes (i.e., the associated CMF values are greater than 1.0.)
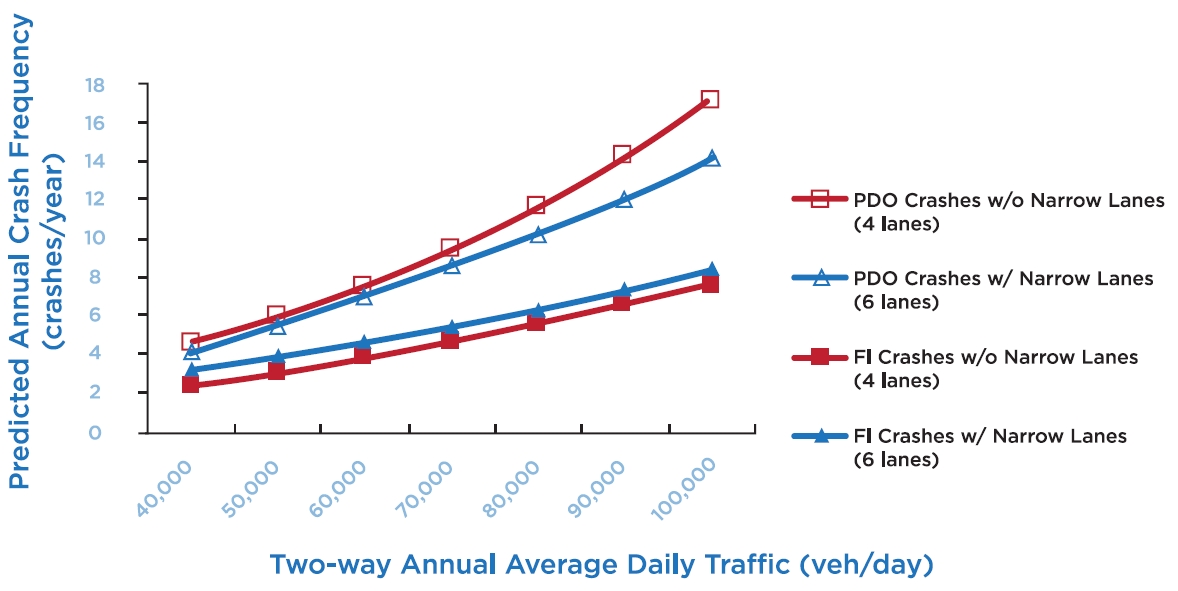
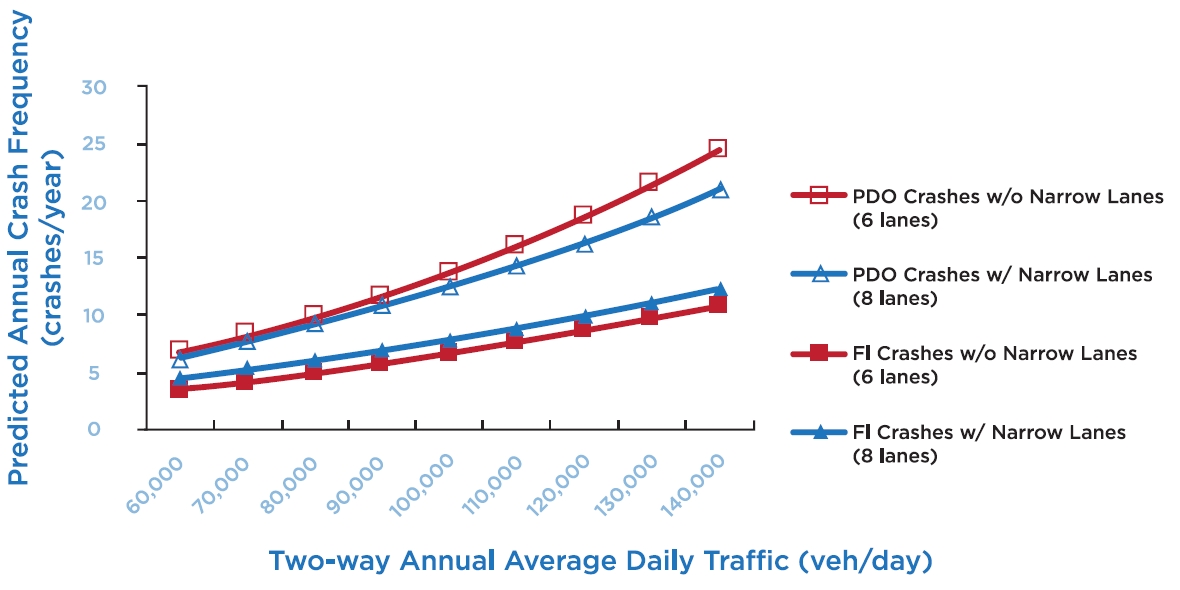
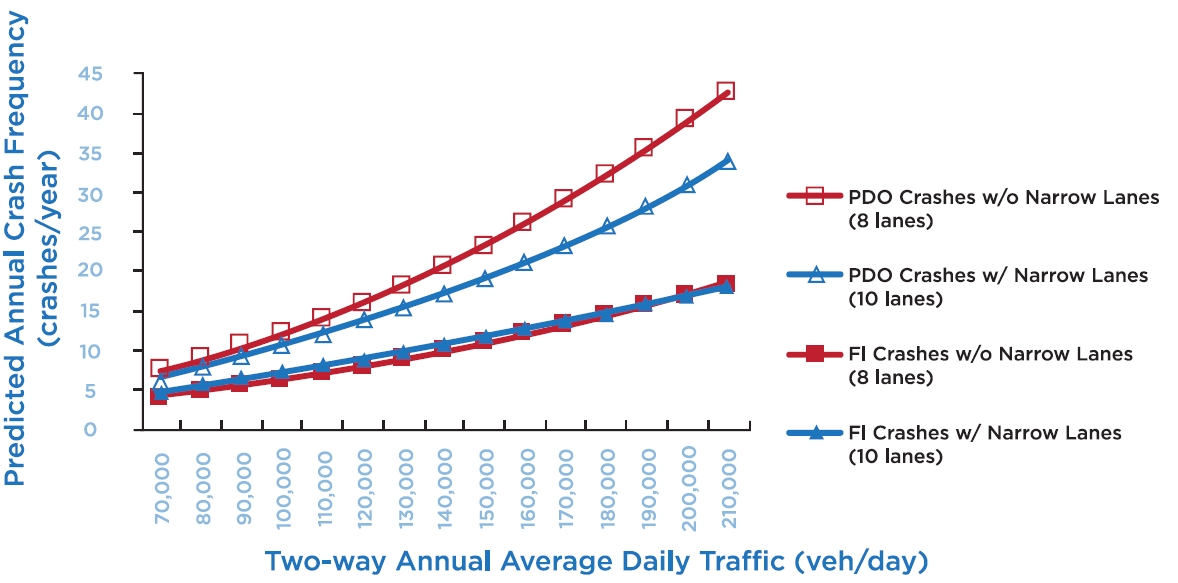
HSM Evaluation of Narrower Lanes and Narrower ShouldersThe HSM freeway crash prediction model can be used to assess the change in crash frequency and severity associated with increasing the number of freeway lanes by reducing lane and shoulder widths. The before and after alternatives listed in Table 10 were analyzed for before conditions of a 4-lane freeway, 6-lane freeway, and 8-lane freeway (bi-directional in each case) with an increase in the number of lanes (one per direction) by narrowing the current lane widths from 12 ft. to 11 ft. and narrowing the shoulders so as to add the lane within the existing roadway footprint (i.e., no widening). Figures 18, 19, and 20 illustrate the predicted frequency of Fatal and Injury (FI) Crashes and Property Damage Only Crashes (PDO) for each freeway alternative shown in the Table.
The HSM freeway crash prediction models estimate that narrowing lanes and shoulder widths to create an additional lane in each direction might have the following influence on crash frequency and severity:
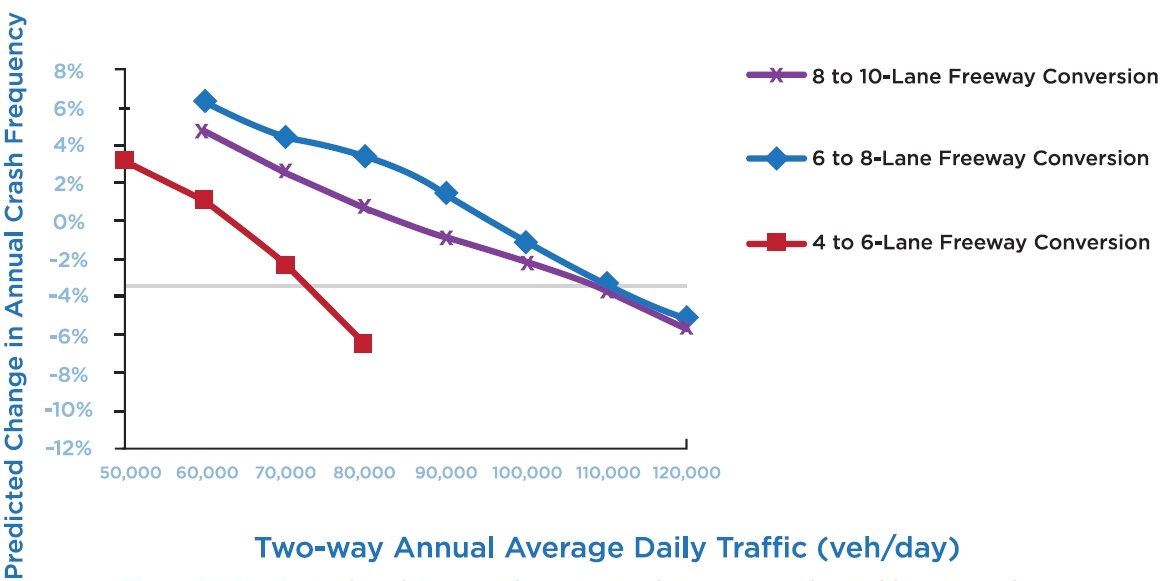
While Figures 15 and 17 indicate an increase in the number of crashes with a narrowing of travel lanes to less than 12 ft. or a narrowing of the outside shoulder to less than 10 ft., and Figures 18–20 show a slight decrease in PDO crashes (but an increase in injury crashes); there are other considerations in any safety analysis of narrow lanes — specifically, that the increase in the number of lanes (and available capacity) may also reduce congestion, which in turn may improve overall safety. Figure 21 summarizes the scenarios shown in previous Table 12 and shows the safety effects of adding a lane by narrowing the general purpose lanes to 11 feet and reducing shoulder widths. The point at which each line crosses the 0 percent mark on the y-axis indicates the AADT above which the implementation of narrow lanes and shoulders — with an increase in the number of lanes — would be expected to decrease crash frequency8 . In general, the greater the average daily traffic — and presumably the greater level of congestion during the "before" condition — the more likely that the safety benefits from reduced congestion (resulting from an additional lane) will outweigh the potential safety issues associated with narrower lanes and shoulders.
For the example identified in previous Figure 13, adding a fourth lane to a the 3-lane directional roadway (as shown in the line with "diamonds" in Figure 21 – "6 to 8 Lane Freeway Conversion"), would be predicted to result in a net reduction in the crash frequency if the two-way average annual daily traffic was greater than approximately 95,000 vehicles per day. Other considerations in performing a safety analysis of narrow lanes include:
Impact of Trucks on Narrow Lanes SafetyTrucks are wider than cars. Federal size regulations for commercial motor vehicles stipulate a maximum width of 2.6 meters (102.36 inches, or 8.53 feet), excluding mirrors and other safety devices. Thus, with a 12 foot lane, a truck driving in the center will have approximately 21 inches on either side between the truck and the adjacent lanes (not counting mirrors). If the lanes are narrowed to 11 feet, this clear distance to the adjacent lanes is reduced to 15 inches (and even less between mirrors of trucks in adjacent lanes). Thus, narrower lanes may make it more difficult for the drivers of heavy vehicles (including buses) to position their vehicle completely within their lane. A truck encroaching into an adjacent lane can cause a sideswipe crash. Moreover this is probably a greater concern on tight horizontal curves. The literature on the subject of narrow lanes, trucks, and safety is somewhat sparse (e.g., as noted above, the HSM does not address the proportion of trucks.) Some highlights from the available literature are noted below:
Based on this admittedly limited documentation, coupled with the notion discussed above that narrow lanes reduce the margin of error for a heavy vehicle operator in terms of keeping the truck in the lane, an analysis of roadway design alternatives involving narrow lanes should consider the safety impacts of trucks, particularly when the percent of trucks in the traffic flow is greater than five to ten percent. Considerations in this regard include the length of the segment and the horizontal and vertical alignments throughout the segments. Potential mitigation measures include the use of dynamic speed limits wherein the speed limits are lowered depending on the percentage of truck traffic in the flow, the horizontal and vertical curvature, and weather and visibility conditions. Consideration should also be given to keeping one or two of the lanes — including possibly a shoulder lane, assuming that the shoulder was constructed at full depth and can accommodate trucks — at 12-feet or greater, and restricting trucks to those lanes. Transportation Systems Management and Operations and SafetyImplementing TSMO strategies (refer to previous Table 5) may provide additional safety benefits beyond the changes in crash frequency predicted by the HSM tools, and should be considered as part of the PBPD activities and the associated trade-off analyses. Table 11 shows the safety benefits resulting from several TSMO applications.
Reliability
Travel Time Index
The ratio of the travel time during the peak period to the time required to make the same trip at free-flow speeds The concept of travel time reliability has been receiving significant attention of late, particularly as part of the Strategic Highway Research Program (SHRP 2). The overall goal of the SHRP 2 Reliability program is to reduce congestion through incident reduction, management, response, and mitigation, thereby significantly improving travel time reliability for many types of person and freight trips on the nation's highways. Per SHRP documentation: "travel time reliability refers to how travel time varies over time and the impacts of this variance on highway users. In other words, for repeated travel or vehicles making similar trips, there is an underlying distribution of travel time for a particular type of trip within a specific time period between two points. Individual travelers respond differently to the factors and uncertainties associated with the travel time. Considering the example in previous Figure 13 (three lanes to four narrower lanes), and assuming that this conversion covers a five-mile segment with a peak hour volume of 5500 pce (compared to the aforementioned before capacity of 6090 pce/hr at LOS D), and an average travel speed of 40 mph during the peak hour; using equations identified in Reference 2210 , the Travel Time Index (TTI) for this before condition is estimated as 1.4 (indicating that the average peak hour travel time is 6.4 minutes, nearly two minutes greater than the free flow travel time of 4.6 minutes). Following the conversion to four lanes, it is assumed that the peak hour volume increases to 6200 pce (i.e., the result of some induced demand brought about by the additional capacity — now at 7600 pce/ hr. — provided by the fourth lane), with the directional roadway now operating at a reduced FFS of 55 MPH (due to the narrower lanes) during the peak period, resulting in a travel time of 5.45 minutes over the 5-mile segment. The new average annual mean travel time for the after condition is calculated as 5.8 minutes (with a TTIm of 1.067), an improvement over the before condition. These equations and the associated reliability measures do not take into consideration the possibility of an increase in crashes, thereby causing nonrecurring congestion and increased travel times (and less reliability. Moreover, a large reduction in shoulder width— such as occurs in the example (i.e., where the shoulder is reduced from 8 ft. to 2. ft.) — may negatively impact reliability. For example, there may no longer be a safe refuge for emergency stops and broken-down vehicles outside the traveled way, nor space for drivers of errant vehicles to make steering corrections before leaving the roadway. Moreover, without a wide shoulder, response times for emergency service vehicles — which often use the shoulder to bypass slow traffic when responding to a crash scene — may increase, thereby increasing incident-related congestion and reducing reliability. Accordingly, enhanced incident management strategies (e.g., frequent service patrols), dynamic lane assignment allowing the closure of a lane upstream of a crash site, and/or emergency refuge areas should be considered when analyzing the possibility of adding a lane via narrow lane and shoulder widths.
5A heavy vehicle is defined in the HCM as "A vehicle with more than four wheels touching the pavement during normal operation." Three heavy vehicle types are defined: transit buses, recreational vehicles (RVs), and trucks. These three types are grouped in the HCM under the broader category of heavy vehicles.
| ||||||||||||||||||||||||||||||||||||||||||||||||||||||||||||||||||||||||||||||||||||||||||||||||||||||||||||||||||||||||||||||||||||||||||||||||||||||||||||||||||||
|
United States Department of Transportation - Federal Highway Administration |
||