Public Perception of Safety Messages and Public Service Announcements on Dynamic Message Signs in Rural Areas
Appendix C. Odds Ratio Graphs for Evaluation of Hypotheses
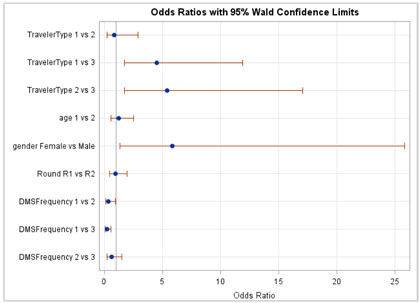
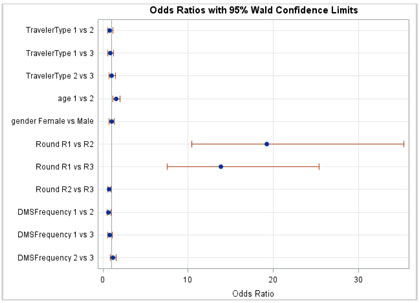
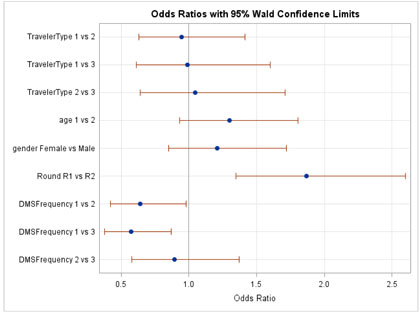
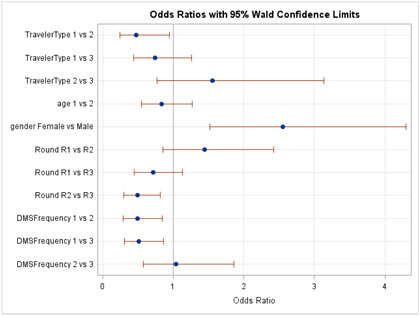
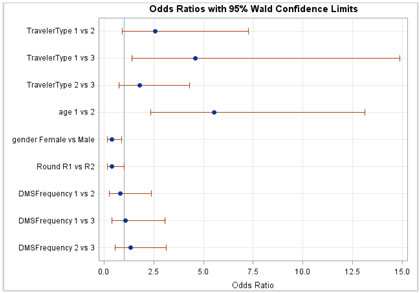
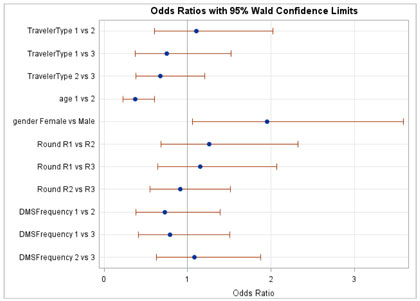
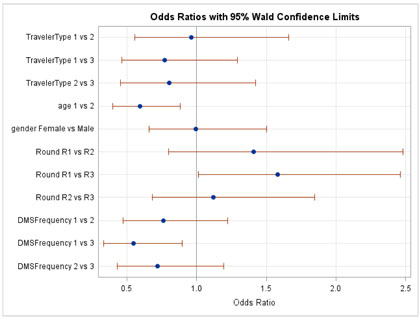
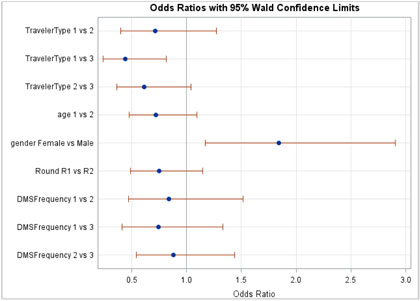
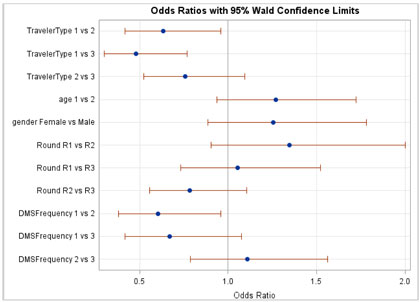
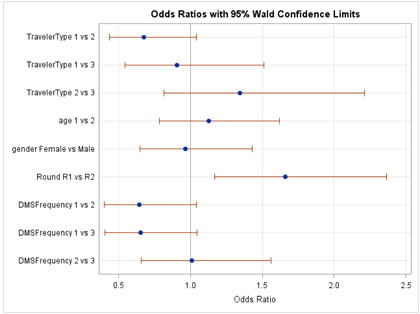
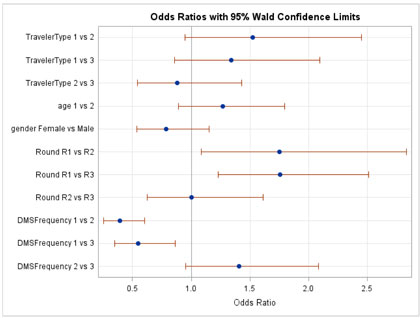
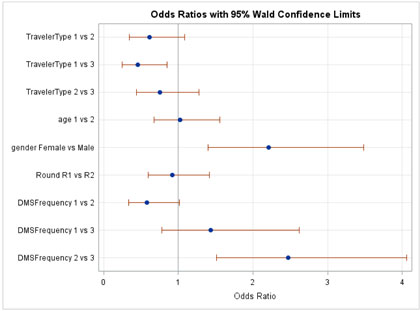
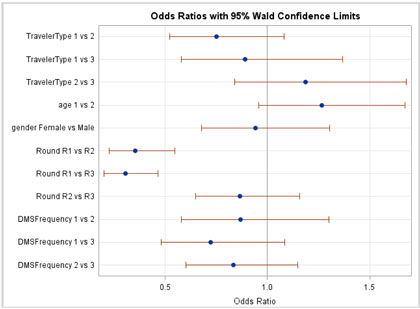
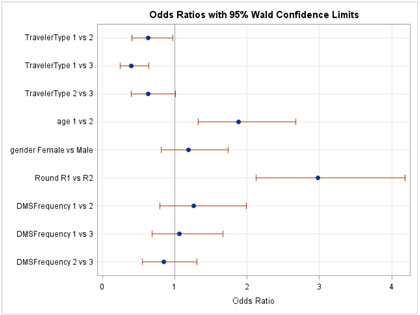
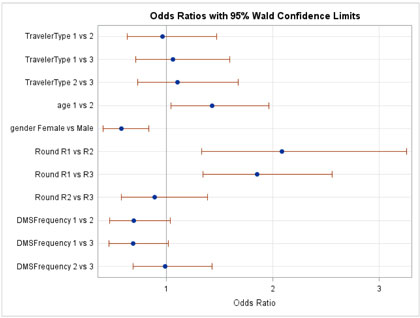
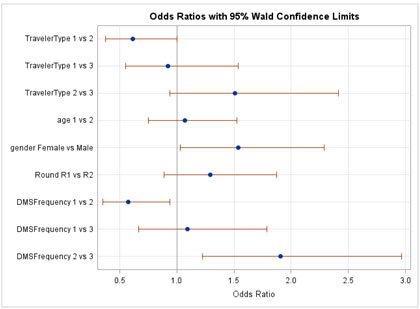
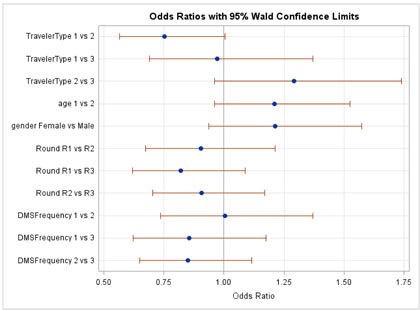
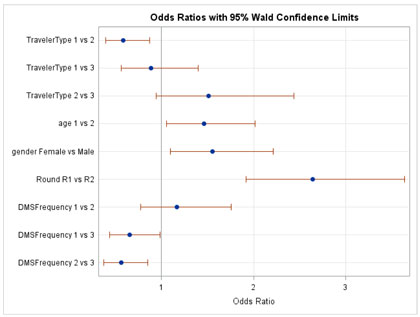
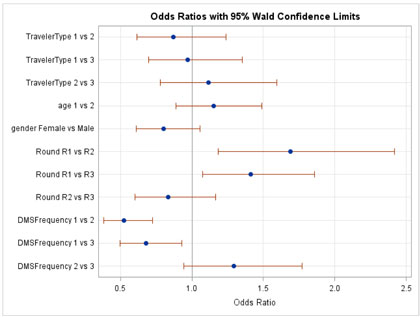
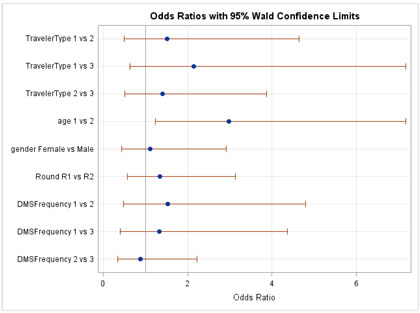
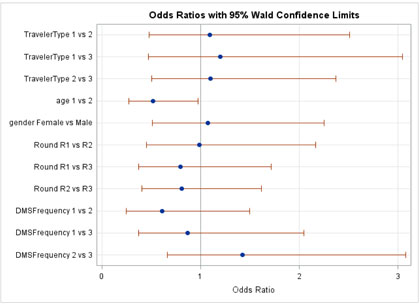
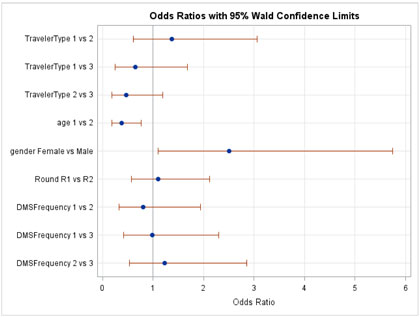
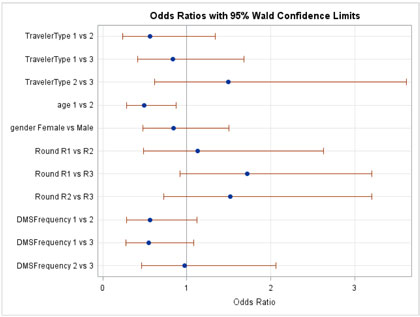
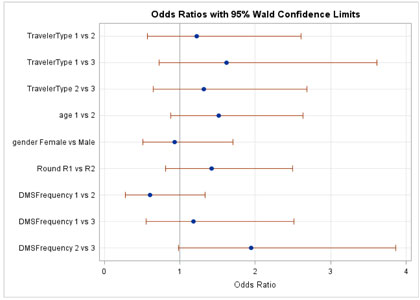
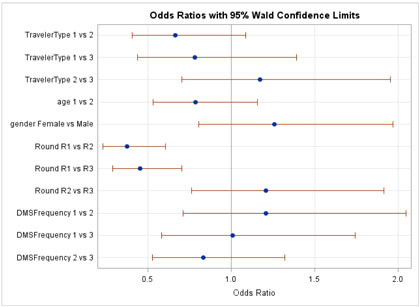
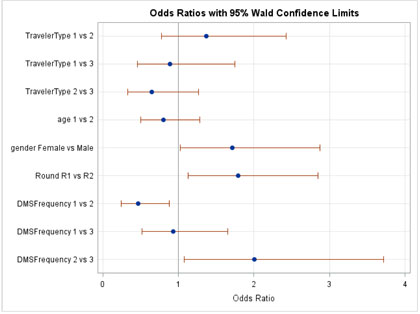
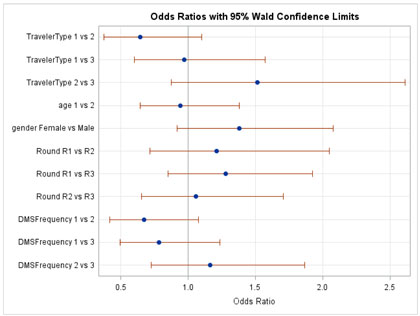
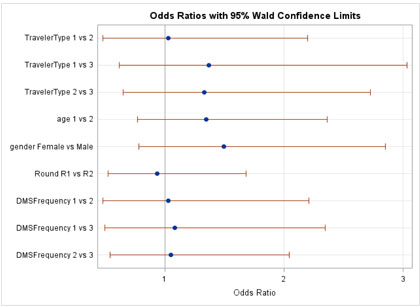
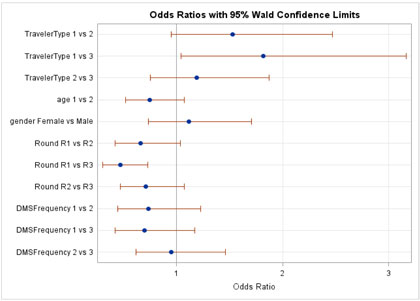
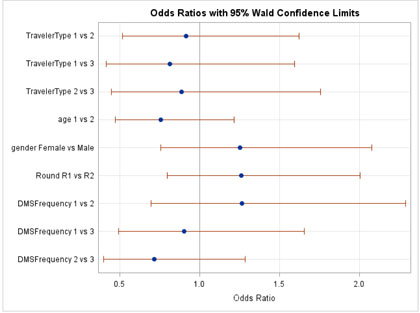
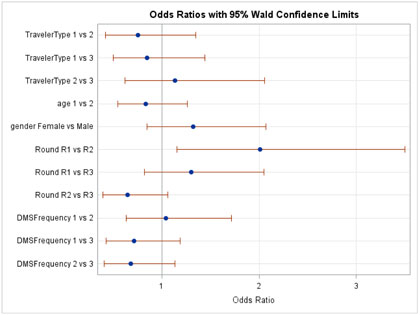
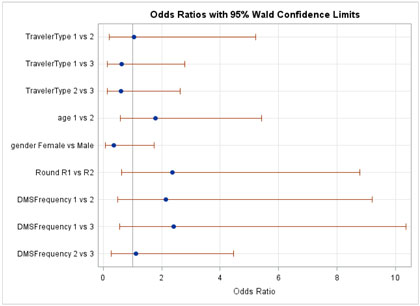
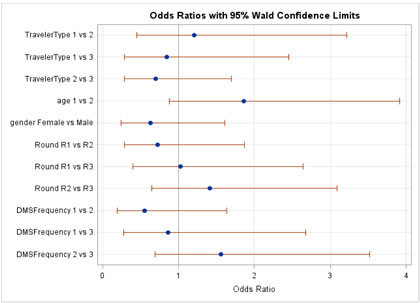
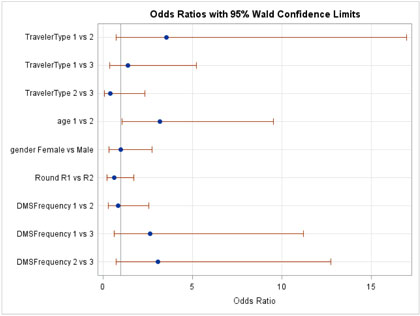
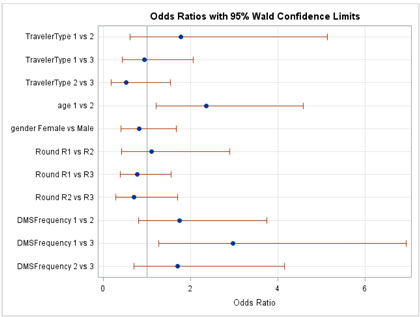
This section includes graphs of odds ratios for each site from the evaluation of select hypotheses. Figure C-1 through Figure C-4 present the odd ratios for each study corridor for the awareness hypothesis of observing an actual safety message and/or PSA on a DMS.
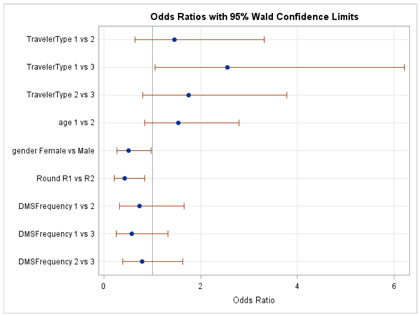
Awareness Hypothesis of Observing an Actual Safety Message and/or PSA on a DMS in Nevada.
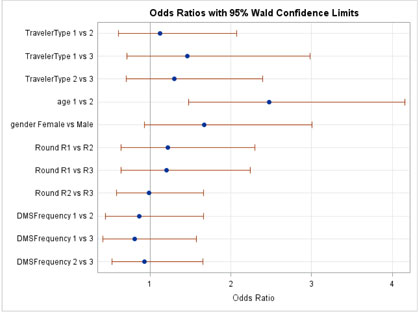
Awareness Hypothesis of Observing an Actual Safety Message and/or PSA on a DMS in Minnesota/Wisconsin.
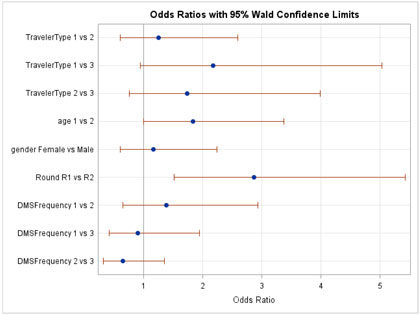
Awareness Hypothesis of Observing an Actual Safety Message and/or PSA on a DMS in Kansas.
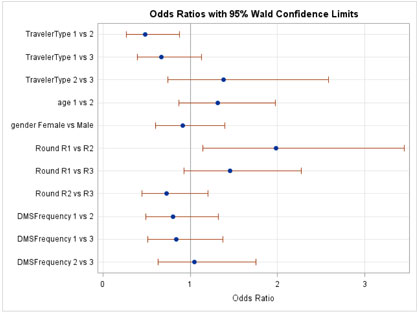
Awareness Hypothesis of Observing an Actual Safety Message and/or PSA on a DMS in Missouri.
Figure C-5 through Figure C-8 present the odd ratios for each study corridor for the understanding hypothesis on travelers understanding the listed message.
Understanding Hypothesis on Understanding of the Listed Message in Nevada.
Understanding Hypothesis on Understanding of the Listed Message in Minnesota/Wisconsin.
Understanding Hypothesis on Understanding of the Listed Message in Kansas.
Understanding Hypothesis on Understanding of the Listed Message in Missouri.
Figure C-9 through Figure C-12 present the odd ratios for each study corridor for the understanding hypothesis on whether the message is understandable.
Understanding Hypothesis on Whether the Message is Understandable in Nevada.
Understanding Hypothesis on Whether the Message is Understandable in Minnesota/Wisconsin.

Understanding Hypothesis on Whether the Message is Understandable in Kansas.
Understanding Hypothesis on Whether the Message is Understandable in Missouri.
Figure C-13 through Figure C-16 present the odd ratios for each study corridor for the behavior hypothesis on whether safety-related DMS cause drivers to slow down.
Behavior Hypothesis on whether Safety-Related DMS Cause Drivers to Slow Down in Nevada.
Behavior Hypothesis on whether Safety-Related DMS Cause Drivers to Slow Down in Minnesota/Wisconsin.
Behavior Hypothesis on whether Safety-Related DMS Cause Drivers to Slow Down in Kansas.
Behavior Hypothesis on whether Safety-Related DMS Cause Drivers to Slow Down in Missouri.
Figure C-17 through Figure C-20 present the odd ratios for each study corridor for the behavior hypothesis on whether travelers do anything differently after seeing the safety or PSA message.
Behavior Hypothesis on Doing Anything Differently after Seeing the Message in Nevada.
Behavior Hypothesis on Doing Anything Differently after Seeing the Message in Minnesota/Wisconsin.
Behavior Hypothesis on Doing Anything Differently after Seeing the Message in Kansas.
Behavior Hypothesis on Doing Anything Differently after Seeing the Message in Missouri.
Figure C-21 through Figure C-24 present the odd ratios for each study corridor for the behavior hypothesis on whether safety-related DMS messages cause changes in driving behavior.
Behavior Hypothesis on Whether DMS Messages Cause Changes in Driving Behavior in Nevada.
Behavior Hypothesis on Whether DMS Messages Cause Changes in Driving Behavior in Minnesota/Wisconsin.
Behavior Hypothesis on Whether DMS Messages Cause Changes in Driving Behavior in Kansas.
Behavior Hypothesis on Whether DMS Messages Cause Changes in Driving Behavior in Missouri.
Figure C-25 through Figure C-28 present the odd ratios for each study corridor for the opinions hypothesis on traveler agreement that the identified message is appropriate.
Opinions Hypothesis on Agreement that the Identified Message is Appropriate in Nevada.
Opinions Hypothesis on Agreement that the Identified Message is Appropriate in Minnesota/Wisconsin.
Opinions Hypothesis on Agreement that the Identified Message is Appropriate in Kansas.
Opinions Hypothesis on Agreement that the Identified Message is Appropriate in Missouri.
Figure C-29 through Figure C-32 present the odd ratios for each study corridor for the opinions hypothesis on traveler agreement that the identified message raised their awareness of the issue.
Opinions Hypothesis that the Identified Message Raised their Awareness of the Issue in Nevada.
Opinions Hypothesis that the Identified Message Raised their Awareness of the Issue in Minnesota/Wisconsin.
Opinions Hypothesis that the Identified Message Raised their Awareness of the Issue in Kansas.
Opinions Hypothesis that the Identified Message Raised their Awareness of the Issue in Missouri.
Figure C-33 through Figure C-36 present the odd ratios for each study corridor for the opinions hypothesis on the best way to communicate safety-related information.
Opinions Hypothesis on the Best Way to Communicate Safety-related Information in Nevada.
Opinions Hypothesis on the Best Way to Communicate Safety-related Information in Minnesota/Wisconsin.
Opinions Hypothesis on the Best Way to Communicate Safety-related Information in Kansas.
Opinions Hypothesis on the Best Way to Communicate Safety-related Information in Missouri.
Figure C-37 through Figure C-40 present the odd ratios for each study corridor for the opinions hypothesis on message types that should be displayed on DMS.
Opinions Hypothesis on Message Types that should be Displayed on DMS in Nevada.
Opinions Hypothesis on Message Types that should be Displayed on DMS in Minnesota/Wisconsin.
Opinions Hypothesis on Message Types that should be Displayed on DMS in Kansas.
Opinions Hypothesis on Message Types that should be Displayed on DMS in Missouri.