Regional Assessment of Weather Impacts on Freight
Chapter 3. Results
Atlanta Prototype
As a first step in the data analysis process, the project team used the Atlanta, Georgia study area as a prototype to explore the implications and limitations of the data. The Atlanta data contained 23 major weather events. A few major weather events had more than one condition (e.g., lightning and thunderstorm winds) so a total of 29 separate weather events were analyzed for their impact on the 23 different Freight Analysis Framework (FAF) highway segments in Atlanta. Based on these numbers, the project team felt that there was sufficient data to draw meaningful general conclusions in the study area, although not enough data to differentiate between weather types. The cumulative analysis of all 13 study areas, discussed in the Cumulative Results section below, had a sufficient sample size to achieve good statistical significance in differentiating between weather types.
Exploring the time-of-day effects in Atlanta revealed that Atlanta has asymmetrical rush hours in terms of average speed (miles per hour)—specifically, the speed decrease is more acute during the morning rush hour than the evening rush hour, as shown in figure 18. Both rush hours also started earlier than expected. These findings suggest that time-of-day effects may be a critical variable in determining the impact of weather on freight.
Figure 18. Chart. Time-of-day effects in the Atlanta, Georgia study area, averaged over all 23 Freight Analysis Framework segments.

(Source: Noel Perry, Cambridge Systematics, Inc.)
The project team also explored potential lead and lagging effects of different weather events using the Atlanta data. Although the sample sizes were too small to draw conclusions by weather event type, this analysis highlighted areas to focus on in the broader analysis. The four-hour periods before and after the reported event (hour 0) were evaluated in this study. Some events did last longer but the team felt that comparisons between different weather events and different geographic areas could be more easily made if consistent time periods were used. Figure 19 illustrates that the impacts of weather events—in terms of change in speed relative to the previous hour—are concentrated around the time of storm (hour 0) and that recovery is generally quick. Winter weather events, however, are an important exception. Ice storms (shown in gold) appear to have a lead effect while winter storms (shown in red) demonstrate a large lagging effect. Regarding the lead effect, there are several reasons why traffic speeds may slow down prior to the reporting of the storm. These include 1) delayed reporting of the storm, 2) weather conditions beginning with light precipitation before the storm is reported, and 3) forecasts of poor weather conditions which encourage drivers to leave early for their destinations, resulting in increased traffic and congestion. Lagging effects, on the other hand, are likely to do with issues such as delays in snow and ice clearance times or congestion that has built up since the beginning of the storm.
Figure 19. Chart. Effects of different weather events over time in Atlanta, Georgia.

(Source: Noel Perry, Cambridge Systematics, Inc.)
These analyses led to a key initial conclusion that time of day matters when it comes to the impact of weather on traffic. Figure 20 below shows the maximum (peak) effects of weather by time of day, revealing that the largest impacts are clearly concentrated around rush hour periods, particularly during the evening rush hour. This is likely because thunderstorms, one of the most frequent major weather events in Atlanta, often occur in the afternoon and evening. The hour-20 events in figure 20 included a flash flood, a discontinuous event that could have produced a range of impacts on the roadways that would overwhelm traffic, including standing water on the roadways, flash floods on arterials that caused regional backups, or a flash flood on the Interstate itself.
Figure 20. Chart. Change in speed from previous hour for all analyzed weather events in Atlanta, Georgia.

(Source: Noel Perry, Cambridge Systematics, Inc.)
The data also suggests that the location of the FAF highway segment may matter, but the sample sizes were too small to draw conclusions and the differences between FAF segments were moderate. To avoid the danger of drawing conclusions with small sample sizes, this part of the prototype analysis was not carried forward to the cumulative analysis.
Cumulative Results
The results of the cumulative analysis of all 13 study areas are described below. As discussed in the Final Data Processing Methodology section, it is important to bear in mind the limitations of the methodology and data used in the analysis while interpreting these results. Mainly, weather events were associated with roadways based on county—meaning that all study area roadway segments in a given county were assumed to have been exposed to weather events reported within the same county. This assumption was necessary in order to conduct the desired analysis using current data sources, but it also introduced some uncertainty into the analysis. Specifically, it is not certain that all roadway segments were exposed to a weather event that occurred in the same county; the likelihood of exposure depends on the size of the weather event and geographic variation within the county. Further, even if a roadway segment was exposed to a given weather event, it is not certain that the weather event significantly impacted roadway conditions. The methodology, however, infers roadway condition impacts from weather event exposure and proximity. Other aspects of the methodology, however, increase confidence in these assumptions and help to counter uncertainty. For example, the weather events analyzed were generally large storms, increasing the probability that a given roadway in the same county was impacted. Additionally, the HERE data was compressed from 5-minute raw data into hourly time periods, which increases the likelihood that, over the course of an hour, the weather events in question occurred over the study area roadways. With these limitations in mind, the results of the cumulative analysis are presented below.
The sample size of weather events across all 13 study areas was sufficiently large to achieve good statistical significance. Figure 21 shows the total number of weather events by type across all 13 study areas—several types have numbers in the thousands.
Figure 21. Chart. Number of weather events by type across all study areas.

(Source: Noel Perry, Cambridge Systematics, Inc.)
The weather events associated with the 13 study areas did not always correlate with decreased traffic speeds relative to similar time periods when weather events did not occur. Figure 22 demonstrates that time periods during the weather events under consideration were only associated with reduced travel speeds 52 percent of the time, when compared to similar time periods when there was no adverse weather. The rest of the time, these weather events were associated with no change in travel speeds (16 percent of the time) or even an increase in travel speeds (32 percent of the time). These numbers serve as a reminder that when changes due to weather are small, other factors can easily outweigh the impact of weather on traffic. Similarly, since the methodology infers road impacts from weather events, these numbers serve as a further reminder that a weather event does not always translate into negative roadway impacts. In addition the temporal resolution of the weather data is coarse (hourly data are being used) and may not reflect the actual timing of events. These events may come on gradually with no discernible impacts initially (e.g., the weather event may have started 45 minutes into hour 0). Another factor is the possibility that in some cases the highway segment in question was not affected by an associated weather event in the county, as discussed above. All things considered, figure 22 again illustrates the limitations of the project’s data and assumptions while still revealing an important trend—that overall statistically significant decreases in speed were found to be correlated with most weather events.
Figure 22. Chart. Travel speeds during time periods with weather events relative to similar time periods under normal conditions.

(Source: Noel Perry, Cambridge Systematics, Inc.)
Figure 23 shows that, of all FAF segments across all 13 study areas, only 21 percent of segments were characterized by irregular traffic flow (i.e., experienced morning and evening rush hour congestion. The term "irregular flow" is used here to describe segments that have a statistically lower-speed during peak hours, while "even flow" is used to describe segments where there is no statistically significant change in speed over the course of the day. The Atlanta prototype indicated that time of day influences the magnitude of weather impacts on traffic. Time of day, however, may have a smaller influence over the impacts of weather on the even flow highways which comprise 79 percent of all segments, compared to the less common irregular flow highways.
Figure 23. Chart. Freight Analysis Framework segments across all study areas characterized by the nature of traffic flow.

(Source: Noel Perry, Cambridge Systematics, Inc.)
Still, the insights from the Atlanta prototype are confirmed at the cumulative-level when the average loss in speed (miles per hour) during weather events on irregular flow highway segments is compared to the average loss in speed on even flow segments. Figure 24 shows that for all weather events (i.e., weather events that decrease, increase, or do not change travel speeds) and for only those that are correlated with decreased speeds, irregular flow roads suffer more in terms of loss in speed during weather events.
Figure 24. Chart. Average loss in speed on even flow versus irregular flow roads for all weather events ("All") and for only weather events that decrease speeds (“Only Losses”).

(Source: Noel Perry, Cambridge Systematics, Inc.)
The reason for this, however, is more subtle than simply the effects of rush hour combined with the effects of weather. Figure 25 shows that irregular flow highways in the 13 study areas are on average busier and experience more truck traffic each day.
Figure 25. Chart. Trucks per day on even flow and irregular flow highways.

(Source: Noel Perry, Cambridge Systematics, Inc.)
From this, one might expect that irregular flow highways are kept closer to their capacity limits during all hours of the day, not just during rush hour periods. Indeed, figure 26 confirms this by showing that irregular flow highways experience greater losses in speed during weather events that occur in the middle of workday as well. Figure 26 shows that even flow highways still suffer relatively more during rush hour periods than they do during off-peak periods, reinforcing that—to some extent—time of day matters for both irregular flow and even flow highways.
Figure 26. Chart. Average reduction in travel speeds due to weather on even flow versus irregular flow roads for each hour of the day.

(Source: Noel Perry, Cambridge Systematics, Inc.)
The project team also examined average travel speeds across all 13 study areas throughout the day during normal weather conditions to get a sense of baseline conditions along these highway segments. Figure 27 demonstrates that, even during normal weather conditions, people tend to drive faster during the daytime on both weekdays and weekends. This is important to keep in mind when considering the impact of nighttime weather events on travel speeds.
Figure 27. Chart. Average speed by hour under normal weather conditions.

(Source: Noel Perry, Cambridge Systematics, Inc.)
Average speed during normal weather conditions also was broken down by study area size—small, medium, and large—based on the population and economic intensity of the metropolitan area associated with the study area. Figure 28 shows that, again, people tend to drive faster during the daytime in study areas of all sizes. Additionally, study areas within smaller regions (e.g., Lake Tahoe, California) enjoy higher travel speeds all hours of day, although the overall pattern is very similar to that of medium and large study areas.
Figure 28. Chart. Average speed by hour for small, medium, and large study areas under normal weather conditions

(Source: Noel Perry, Cambridge Systematics, Inc.)
When weather events are introduced to these highway segments, average speeds decrease for a number of hours both before and after the event. Figure 29 illustrates that when all weather events and all study areas are considered, speeds begin moderately decreasing three hours prior to the weather event, decrease the most during the first hour of the event, and then maintain a depressed state for the next several hours. The larger decreases in speed during the hours after the event indicate that the impact of weather on traffic generally has a lagging effect. The decreases one to three hours prior to the event were very small and could reflect increased traffic due to people trying to get home prior to the event or light precipitation that has not yet been recorded as a major storm. It should be noted again here that in some cases the impact of weather events over time may be partly affected by weather events moving around the county, as weather events were associated with highway segments based on county.
Figure 29. Chart. Change in speed (miles per hour) due to weather events over time, averaged across all weather events and study areas.

(Source: Noel Perry, Cambridge Systematics, Inc.)
Figure 30 explores the lagging effect in greater depth, showing the average decrease in speed four hours after a weather event compared to normal speeds for a range of weather event types. For most weather event types, only moderate speed reductions persist after four hours. For ice and snow, however, figure 30 shows a strong lagging effect—average speeds are still almost 8 miles per hour lower than normal speeds after four hours. This finding indicates also that winter storms have a relatively large impact on traffic conditions compared to other weather event types. (The very small increase in speed seen four hours after fire events is difficult to attach meaning to, as it is not known whether smoke was being blown in such a way that decreased visibility on the actual roadway. One possible hypothesis for the small speed increase is that people on average drive faster during dry, summer days when fire is more prevalent. It should also be noted that fire was a relatively rare event.) As a note, the weather event category called Temperature in figure 30, as well as in following figures, is a combination of the Excessive Heat and Extreme Cold/Wind Chill categories in table 6. This category is intended to represent extreme temperature weather events.
Figure 30. Chart. Lagging Effect: Change in speed four hours after different types of weather events, across all study areas.

(Source: Noel Perry, Cambridge Systematics, Inc.)
The large impact of winter storms is further shown in figure 31, which demonstrates that ice and snow are associated with over half of all travel time lost during weather events across all study areas. This share of lost time equates to about 12 minutes per truck. It should be noted here that most wind events also included other events such as heavy rain and snow, thereby making it difficult to isolate wind impacts.
Figure 31. Chart. Winter weather accounts for over half of all lost time: Weather effects by weather event type, across all study areas.

(Source: Noel Perry, Cambridge Systematics, Inc.)
Sorting weather events by the magnitude of their inferred impacts on traffic instead of by weather event type, as shown in figure 32, reveals that 66 percent of weather events are associated with only moderate reductions in speed (defined here as a less than 10 percent decrease in speed) and cumulatively account for just 20 percent of total lost time. Conversely, the 10 percent of weather events that are associated with the largest speed decreases (ranging from a 40 percent to a 10,000 percent decrease in speed in this project's study areas) account for 56 percent of total time lost (highlighted with red circles). These findings suggest that a small percentage of high-impact weather events are behind the majority of weather-related freight costs in the areas studied.
Figure 32. Chart. The cumulative share of weather events and time lost when weather events are sorted by their impacts on traffic speed (percent decrease in speed).

(Source: Noel Perry, Cambridge Systematics, Inc.)
Bringing together figure 31 and figure 32, figure 33 reveals that almost half (49.1 percent) of time lost due to weather events that are associated with a large impact on traffic (defined as weather events associated with a decrease in speed greater than 10 percent) are in the category of Ice and Snow. Wind (24.9 percent), Rain (12.4 percent), and Flood (12.4 percent) also account for a significant proportion of time losses associated with these large-impact events.
Figure 33. Chart. Weather events associated with large impacts on traffic (greater than 10 percent decrease in speed) sorted by weather event type.

(Source: Noel Perry, Cambridge Systematics, Inc.)
Exploring this trend further, figure 34 demonstrates that Ice and Snow account for an even larger proportion of time lost due to the highest impact weather events (defined as weather events associated with a decrease in speed greater than 50 percent) with a 57.5 percent share of total time lost. Similar to figure 33, Wind (18.9 percent), Flood (12.5 percent), and Rain (10.6 percent) account for a significant share of lost time at this level of impact as well.
Figure 34. Chart. Weather events associated with the worst impacts on traffic (greater than 50 percent decrease in speed) sorted by weather event type.

(Source: Noel Perry, Cambridge Systematics, Inc.)
Given the larger than expected impact of Wind on traffic across all study areas, the project team investigated its impact on each individual study areas. Figure 35 demonstrates that Wind is associated with relatively large reductions in speed in the Lake Tahoe, California study area, where these events decrease speeds by approximately 6 miles per hour on average. Indeed, the Lake Tahoe region is troubled by dust and sandstorms, especially after heavy sanding for traction during snowstorms. The Lake Tahoe study area includes I-80 across the Donner Pass, which frequently sees snowfall and, therefore, would also need sanding.
Figure 35. Chart. The impacts of Wind weather events in each study area.

(Source: Noel Perry, Cambridge Systematics, Inc.)
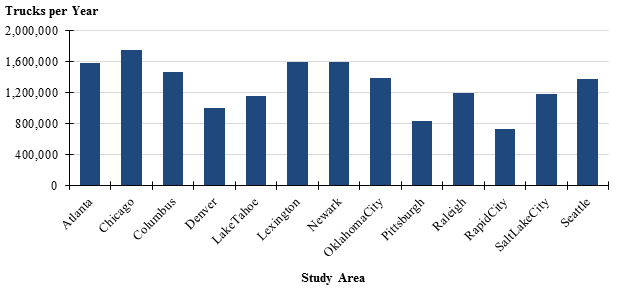
The final stage of the cumulative analysis was to assign truck volumes to the FAF segments in each study area during the hours of interest, meaning during interactions between the FAF segments and weather events under study. In total, there were 413 million truck passings per year across all 13 study areas. Figure 36 shows the average number of truck passings per year in each study area during weather events. Across all study areas, 9 million truck passings, or 2.2 percent, occurred during weather events.
Figure 36. Chart. Average number of trucks per year passing through each of the 13 study areas during weather events. All 13 study areas together see 413 million truck passings per year total, with 9 million, or 2.2 percent of these passings occurring during weather events.
(Source: Noel Perry, Cambridge Systematics, Inc.)
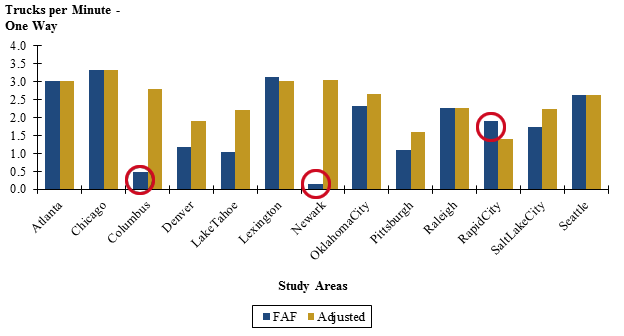
The data shown in figure 36 however, did not match well with the FAF3.5 data for certain study areas. Figure 37 below shows that for Columbus, Ohio; Newark, New Jersey; and Rapid City, South Dakota (highlighted with red circles) the FAF3.5 data differs greatly from the truck volumes shown in figure 36. The project team adjusted the FAF volumes for these study areas and others to better reflect the data in figure 36. These adjustments were based primarily on truck volume and distribution data compiled by Transportation Economics, part of the study team.
Figure 37. Chart. Raw Freight Analysis Framework volume data ("FAF") and adjusted Freight Analysis Framework volume data ("Adjusted") for each study area.
(Source: Noel Perry, Cambridge Systematics, Inc.)
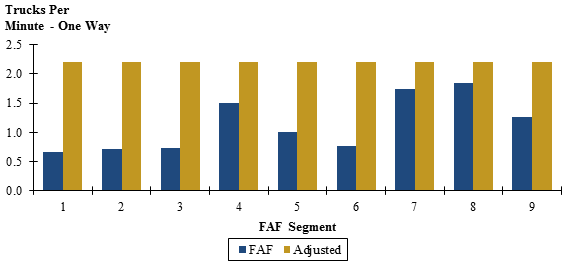
Moreover, the FAF3.5 data was at times inconsistent within study areas, such as the data for Lake Tahoe, California. As demonstrated in figure 38, the project team examined these more fine-grained inconsistencies in the data and made adjustments as needed at this level as well.
Figure 38. Chart. Raw Freight Analysis Framework volume data ("FAF") and adjusted Freight Analysis Framework volume data ("Adjusted") for individual Freight Analysis Framework segments within the Lake Tahoe, California study area
(Source: Noel Perry, Cambridge Systematics, Inc.)
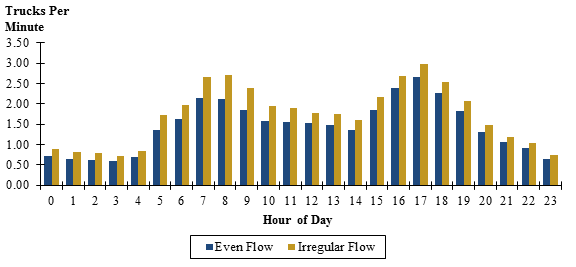
The adjusted FAF truck volumes were then distributed across the day using Transport Economics research. Figure 39 illustrates these adjusted and distributed volumes for both even flow and irregular flow roads.
Figure 39. Chart. Distribution of adjusted Freight Analysis Framework volumes across the day using Transportation Economics' research, for even flow and irregular flow highways, across all study areas.
(Source: Noel Perry, Cambridge Systematics, Inc.)
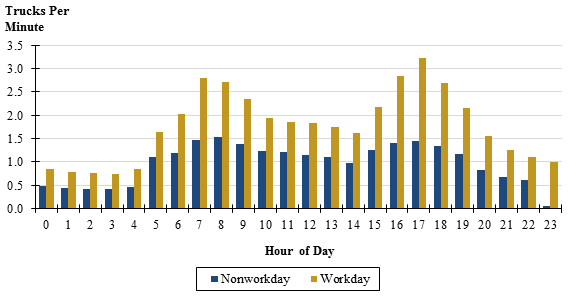
The adjusted FAF volumes also were distributed across the day for workdays and nonworkdays, as shown in figure 40. The assumption behind this distribution was that nonworkdays have half the volume of workdays, in aggregate across the entire day.
Figure 40. Chart. Distribution of adjusted Freight Analysis Framework volumes across the day using Transportation Economics' research, for workdays and nonworkdays across all study areas.
(Source: Noel Perry, Cambridge Systematics, Inc.)
The project team then determined the length of each FAF segment (in miles) and the amount of time trucks spend passing through each FAF segment, or segment travel time (in minutes). The results, shown in figure 41, reveal that the average length of FAF segments is very small (less than 1.375 miles) and that the average travel time is similarly small (approximately 1.395 minutes).
Figure 41. Chart. Average length and travel time of Freight Analysis Framework segments across all study areas.

(Source: Noel Perry, Cambridge Systematics, Inc.)
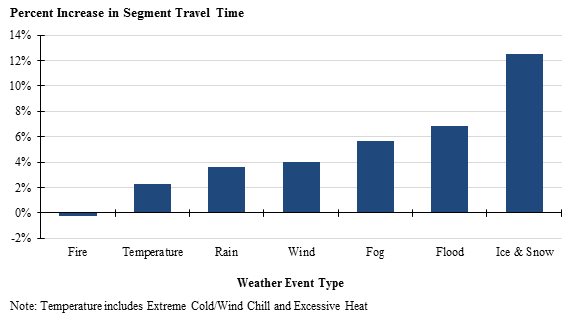
Building on this analysis, the percent increases in FAF segment travel times were calculated for the primary weather event types in the project's study areas, as shown in figure 42. In keeping with earlier findings, Ice and Snow are correlated with the largest percent increases in segment travel time, while Flood, Fog, Wind, and Rain are also associated with notable percent increases in travel time.
Figure 42. Chart. Percent increase in Freight Analysis Framework segment travel times for different weather event types, across all study areas.
(Source: Noel Perry, Cambridge Systematics, Inc.)
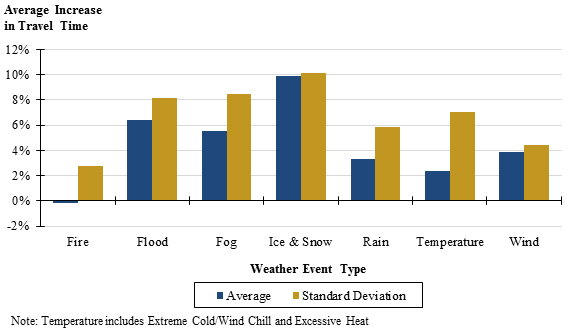
It is important to note, however, that these percent increases varied widely among study areas. Figure 43 shows that the standard deviation of the average percent increase in travel time was greater than the average for all primary weather event types.
Figure 43. Chart. Differences in travel time impacts between and within weather event types, across all study areas.
(Source: Noel Perry, Cambridge Systematics, Inc.)
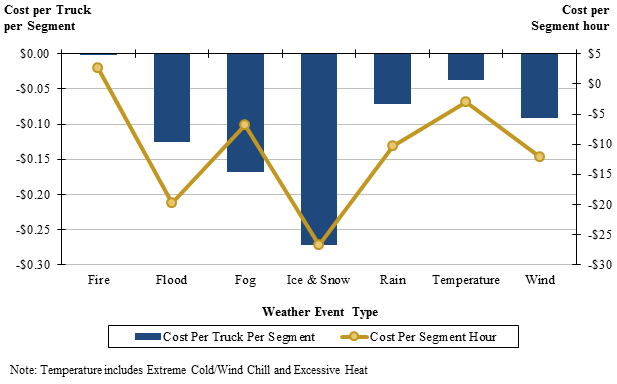
Finally, the project team used data from across all study areas to calculate the average costs associated with different weather event types in terms of costs per truck per segment and in terms of cost per segment hour, as shown in figure 44. These costs should be understood as lost (negative) revenue. The total cost associated with all weather event types and all study area highway segments is $3.8 million per year. These calculations are relative to the average cost of trucking, which includes good and bad weather, and assume a time-cost of $130 per hour for a heavy truck. Safety risks and delay costs are not accounted for in this analysis.
Figure 44. Chart. Costs of weather events by type in terms of cost per truck per segment and cost per segment hours.
(Source: Noel Perry, Cambridge Systematics, Inc.)