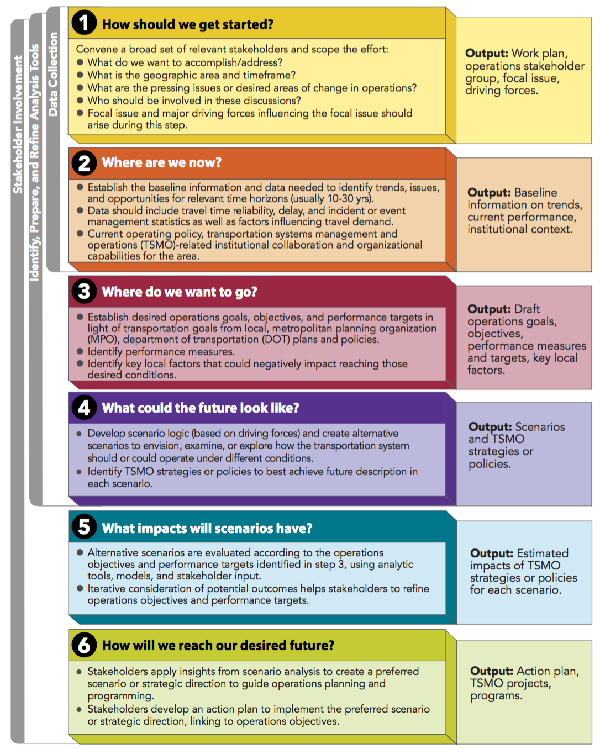
Planning for Transportation Systems Management and Operations Within Corridors: A Desk ReferenceChapter 5. Toolbox for Effective Transportation Systems Management and Operations PlanningThere are a variety of tools that can support transportation systems management and operations (TSMO) planning on a corridor, and many of them have already been discussed prior to this chapter, including analytical tools and simulation models, the regional intelligent transportation system (ITS) architecture, and archived operations data. (Note: The word "tools" is used in this chapter in the broadest sense — anything that can be used to support and enhance TSMO planning on a corridor.) This chapter offers readers a "toolbox" of analysis tools and planning techniques that can be applied when planning for TSMO within corridors. For several of the tools described, there is at least one additional Federal Highway Administration (FHWA) guide that can give readers a much greater understanding of how the tool may be applied. This chapter begins with two planning techniques and then moves into short reference sheet-style descriptions of common types of analysis tools. Following the reference sheets are overviews of several specific applications that planners and operators can use to directly address analysis needs while planning for TSMO within corridors. Scenario Planning for Transportation Systems Management and Operations within CorridorsScenario planning is an important enhancement to planning for TSMO within a corridor. It can be used to incorporate the consideration of factors that are difficult to predict, such as evolving technology, climate change, shifting traveler behavior, financial uncertainty, failing infrastructure, natural and man-made events, and other unknowns into planning and programming decisions. Scenario planning supports the exploration and consideration of different future conditions along a corridor. Scenario planning is an approach to strategic planning that uses alternate narratives of plausible futures (or future states) to play out decisions in an effort to make more informed choices and create plans for the future. It engages participants in considering the "what ifs" of tomorrow, whether those are desirable or undesirable outcomes. The simple task of imagining a different future can help to challenge the status quo and encourage creative thinking, which ultimately can lead to the development of more thoughtful and resilient plans. Scenarios are developed to enable participants to test out possible decisions, analyze their impacts given the conditions in each scenario, and come to agreement on a preferred course of action. Scenario planning follows many of the same planning activities as described in Chapter 3, beginning with scoping the effort, examining current conditions and trends, and then identifying goals and objectives. In scenario planning, the leaders and stakeholders would then develop multiple scenarios or descriptions of possible futures, identify the strategies needed to realize each of the scenarios, and then analyze the impacts of each scenario against reaching their objectives. The scenario planning approach to TSMO is shown in Figure 26.
As an example of scenario planning for TSMO within a corridor, the planning team could be looking to achieve the following goal and objectives for a 40-mile corridor from a rural area to a very large metropolitan area:
The I-21 corridor stakeholders must then create scenarios based on prioritizing modal options or prioritizing route and time of day travel options. The first scenario would be created in response to the question: "What does efficient and reliable travel along the I-21 corridor look like if one emphasizes and encourages the use of multiple modes?" The second scenario would be a response to the question: "What does efficient and reliable travel along the I-21 corridor look like if one emphasizes and prioritizes the use of route and time-of-day travel options?" Assuming the scenarios are written from the perspective of two commuters, the TSMO strategies that would achieve each of the futures provided in the scenarios would be identified and evaluated to see what impact they would have on the operations objectives. During the final step of the scenario planning process, the results of the evaluation would be presented to the stakeholders, who would provide extensive feedback on both the scenarios as well as the predicted impacts on the measures and goals of interest. Stakeholders would then select or combine elements of each scenario together to create a preferred scenario that encompasses a comprehensive vision for the future operations of the corridor. This is only one example of the many ways scenario planning can be applied to planning for TSMO within corridors. Generally, there are three types of scenario planning that reflect the different conditions and purposes for which scenario planning may be used. For example, scenario planning for TSMO within a corridor may be used to identify the most effective package of TSMO strategies given an expected change in conditions on the corridor (trend-based type). Alternatively, scenario planning may be used to build consensus on operations objectives by examining multiple desired future conditions and the strategies needed to support those conditions (normative type). Finally, scenario planning can be used to examine different scenarios in response to uncontrollable or unknown future conditions (e.g., to better understand the impacts of global trade changes, extreme weather, etc.). The purpose of this is to guide stakeholders in identifying policies, plans, and strategies that can work best under all extreme conditions (exploratory type). Additional information on how to use scenario planning to advance TSMO can be found in the FHWA's Advancing Transportation Systems Management and Operations Through Scenario Planning. 80 Use of Archived Operations DataArchived operations data is a critical tool in an objectives-driven, performance-based planning approach to TSMO within corridors. Archived operations data is information that is collected and stored in support of day-to-day efforts to monitor and manage the transportation system. Archived operations data can include traffic, transit, bike, pedestrian, construction, and weather information that is usually collected in real time by ITS infrastructure, such as in-pavement inductive loop detectors, radar detectors, remote traffic microwave sensors, Bluetooth, and EZPass or other unique identification tag readers. It also includes incident or event information entered into electronic logs by transportation or public safety personnel. Transportation planners at the State, metropolitan, and local level are finding that, with archived operations data, they are able to do more, be more accurate, and solve more problems than ever before—relying less on assumptions and modeled data, and making more effective, less costly decisions. There are several advantages to having archived operations data available:
The following are examples of significant uses for archived operations data in planning for TSMO within corridors:
The FHWA has produced a desk reference (Use of Archived Operations Data in Planning) on applying archived operations data to planning aimed toward TSMO planners and their planning partners. This desk reference raises planners' awareness of the opportunities afforded through archived operations data and provides guidance on how to take advantage of that data to expand and improve planning practices.81 It also identifies new and innovative applications for this data in planning. The desk reference is intended to help planners and their operations data partners overcome the barriers to obtaining and using data. Analysis Tools Available for Transportation Systems Management and Operations Planning within CorridorsFollowing are the reference sheets for several types of analysis tools that can be applied for TSMO planning within corridors. The types of analysis tools covered are travel demand models, sketch planning tools, analytic/deterministic tools, simulation tools, and dynamic traffic assignment (DTA) methods. Travel Demand ModelsDescription Travel demand models are widely used to compare or screen alternatives by using origin-destination patterns, demand-to-capacity ratios, differences in percent volumes, and rough estimates of travel times. These models consider land use, demographics, mode choice, and the transportation system (roadway and transit). Examples
Software: TransCAD, Emme, and Cube. Planning for Operations Uses for Corridors
Advantages
Challenges
Sketch Planning ToolsDescription Sketch-planning tools provide quick order-of-magnitude estimates with minimal input data (e.g., traffic volumes and speeds) in support of preliminary screening assessments. These tools are appropriate early in the planning process when prioritizing large numbers of projects or strategies for more detailed evaluation. Tools are often spreadsheets or simple databases that are based on built-in assumptions of impacts and benefits for various strategies. Data from sketch-planning tools, such as Florida ITS Evaluation Tool (FITSEVAL), can be integrated with travel demand model data to provide analysis of operational strategies. Examples
Planning for Operations Uses for Corridors
Advantages
Challenges
Analytical/Deterministic ToolsDescription Most analytical/deterministic tools implement the procedures of the Highway Capacity Manual. The following summarize the Highway Capacity Manual procedures:
Analytical/deterministic tools quickly predict capacity, density, speed, delay, and queuing on a variety of transportation facilities. Examples
Planning for Operations Uses for Corridors
Advantages
Challenges
Simulation ToolsDescription Simulation tools use a variety of formulas and algorithms to simulate travel behavior to analyze operations of traffic and transit to conduct needs assessments, alternatives analysis, environmental impact studies, and operations planning. These tools may be deterministic or incorporate stochastic sampling or perturbation. Simulation tools can be classified as:
Examples
Planning for Operations Uses for Corridors
Advantages
Challenges
Dynamic Traffic AssignmentDescription DTA is a simulation tool that assigns vehicles to paths based on traffic conditions instead of pre-defined routes using origin-destination data and link path travel time equilibrium. Simulated vehicles can adapt to prevailing conditions, change start times, choose alternative routes, or change modes. DTA often involves a combination of model types representing multiresolution modeling. The following are requirements for DTA:
Examples Planning for Operations Uses for Corridors
Advantages
Challenges
Work Zone Traffic Analysis ToolsWork zone management is essential element to a comprehensive approach to managing travel within corridors because of the frequent maintenance and major rehabilitation projects that are required as the infrastructure continues to age. Work zone traffic analysis enables agencies to evaluate the mobility and safety impacts of a transportation construction, maintenance, or rehabilitation project and make more informed decisions regarding when and how the projects should take place. There are a variety of work zone modeling and simulation tools to support work zone traffic analyses ranging from the simple to complex. Work zone traffic analysis can assist in three primary types of decisions: 82
The traffic analysis tools to support work zones include tools in several of the analysis tool categories previously mentioned including sketch-planning tools, travel demand models, and microscopic simulation models. Many tools that were not specifically designed to support work zone traffic analysis can be used in that capacity, but there also are many tools that have been built to address the specific needs of work zone related analysis. The FHWA Office of Operations Work Zone Management Program maintains a list of many of the available tools on its website. 83 Two of the more common tools for work zone traffic analysis are QuickZone and the Construction Analysis for Pavement Rehabilitation Strategies (CA4PRS). QuickZone is a tool that compares the traffic impacts for work zone mitigation strategies and estimates the costs, traffic delays, and potential backups associated with these impacts. QuickZone assists State and local traffic, construction, operations, and planning staff, and construction contractors to accomplish the following:
The Construction Analysis for Pavement Rehabilitation Strategies (CA4PRS) is a tool that allows users to conduct an integrated analysis of project alternatives including pavement design, construction logistics, and traffic operations options. It helps State departments of transportation (DOTs) and contractors make effective scheduling decisions that minimize traffic delay, extend the service life of pavement, and reduce agency costs.85 Application to Planning for Transportation Systems Management and Operations within CorridorsWork zone traffic analysis tools help planners and operators reduce the impacts of transportation infrastructure projects within a corridor. Specifically, these tools help transportation agencies in:
Tool for Operations Benefit CostAnalysisThe Tool for Operations Benefit CostAnalysis (TOPS-BC) offers a means to determine whether investment in a given TSMO strategy is justifiable in comparison to investment in a traditional capital infrastructure project. The tool was created by the FHWA as a sketch-planning benefit-cost analysis tool to support preliminary screening and initial prioritization of TSMO strategies. The TOPS-BC tool has four key functions:
As a sketch-planning tool, TOPS-BC allows users to quickly understand typical benefits for a range of TSMO strategies and then estimate the benefit-cost ratios for each of those TSMO strategies. The tool also provides a suggested list of analysis tools whose use depends on user selected criteria, such as the level of confidence required, which TSMO strategies are being investigated, key measures of effectiveness, and a few other filters. The TOPS B-C tool is built on a Microsoft Excel platform and can be downloaded from the FHWA's Planning for Operations website at: https://ops.fhwa.dot.gov/plan4ops/topsbctool/index.htm. TOPS-BC is a companion resource to the FHWA's Operations Benefit/Cost Desk Reference. Application to Planning for Transportation Systems Management and Operations within CorridorsTOPS B-C is a useful tool for analyzing TSMO strategies identified in corridor planning. The strategies included in TOPS B-C are commonly applied in corridors. Table 5 lists those TSMO strategies included in the TOPS-BC tool and indicates whether typical impacts or benefits are provided for the strategy, as well as the availability of more detailed calculation tools for costs and benefits. Table 5. Strategies included in the Tool for Operations Benefit-Cost Analysis.
Samples of UseAs noted above, the tool exists as a Microsoft Excel spreadsheet with several tabs and color coded cells that clearly identify where the user needs to provide information but also allows the user to modify the spreadsheet as needed. TOPS-BC calculates an annualized cost for each strategy that incorporates the useful life of the equipment, the replacement cost, and the annual operations and maintenance cost. The net present value of implementing the strategy also is provided, and while default values for the discount rate and time horizon are provided, the user can change those values. The cost components for each TSMO strategy are broken down into two categories: the one-time costs to create the backbone structure for the strategy, such as software and system integration; and the incremental cost of each additional installation, such as additional loops, weather stations, and dynamic message signs. Default costs are included in the spreadsheet for all of the cost components. The user simply needs to enter the number of infrastructure deployments and the number of incremental deployments. The annual benefits calculated by TOPS-BC focus on travel time savings for both recurring and non-recurring congestion, energy/fuel savings, and savings due to reduced crashes. A tab marked "Parameters" includes all of the assumptions used to calculate the benefits, such as:
If local information is known, in particular the percentage of trucks on the facility and crash rates on the facility by severity, those can be modified to provide a more accurate assessment of benefits. However, if local factors are not known, the default values make the tool ready to use for an approximation of the benefit for the desired TSMO countermeasure. As with the cost component, each strategy has its own tab to calculate benefits. Again, color-coded cells are used to help the user identify where input is required. A basic benefit analysis requires minimal input from the users. For example, to calculate the benefits for dynamic message signs, the user is required to provide three pieces of information:
There are additional categories where default values are provided, or the user can override those values when location-specific information is known. For example, the ramp meter benefits assessment assumes a freeway free flow speed of 55 miles per hour and a ramp free flow speed of 35 miles per hour. Both of those values can be overridden if local data is known. In addition to the benefit tabs for each strategy, the tool contains a generic link-based analysis tab that can be used to enter benefits related to a TSMO strategy not specifically identified. The TOPS-BC tool also includes a summary tab that allows the user to select some or all of the strategies for a total benefit-cost summary. AdvantagesThe following are advantages of the TOPS B-C tool:
Challenge from Training
The Traffic Incident Management Benefit-Cost ToolTraffic incident management (TIM) strategies are critical components of TSMO. These strategies deal with safety and mobility issues resulting from traffic incidents on the roadways and support quick incident response, thereby shortening incident duration and controlling traffic delays around the occurrence scene. Because resources and funding are oftentimes limited for State DOTs and local transportation agencies, it is essential to investigate benefits and costs for potential and existing TIM strategies to avoid potentially expensive or ineffective approaches. Various types of TIM strategies have been implemented world-wide. Some of the most cost effective and commonly used TIM strategies include:
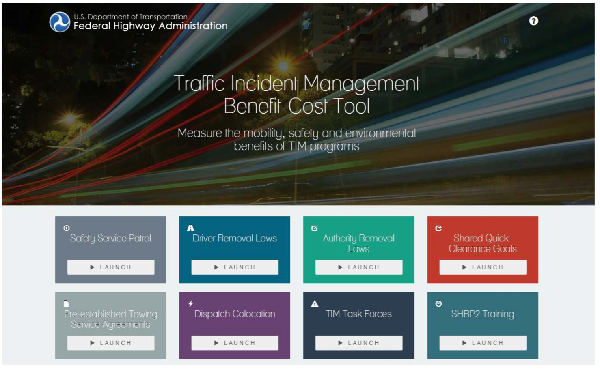
The Traffic Incident Management Benefit-Cost Analysis (TIM-BC) Tool is a web-based tool with a standardized methodology that can be universally employed in benefit-cost ratio estimations for different TIM programs.87 Standardization benefits the evaluations by creating consistency and, therefore, greater confidence in the validity of the results. With access to the approach in the form of a user-friendly, less data-intensive tool, TIM programs and taxpayers alike can benefit from cost-effective evaluations. TIM-BC features different sub-tools for the eight different TIM strategies described above, and users are able to input their own parameters based on their local experiences and engineering judgment. The tool also provides default values for these parameters to facilitate quick TIM-BC evaluation, particularly for areas where targeted TIM strategies have not been implemented and no relevant data is available. A screenshot of the main navigation page is shown in Figure 27.
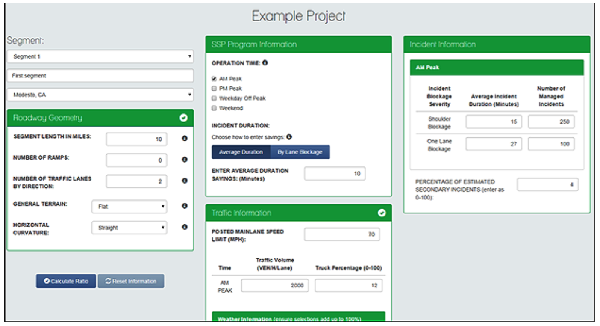
Application to Planning for Transportation Systems Management and Operations within CorridorsThe TIM-BC tool includes the capability to estimate travel delay, fuel consumption, emissions, and secondary incidents. The data and equations encompassed in the database are derived directly from well-designed simulation experiments, which consider different incident information (i.e., number of lanes, lane blockage, duration, and location) under different traffic conditions. The computations employ a hybrid statistical-simulation methodology in which parameters from regression analysis are combined with results from simulation runs to improve the fit of the regression model. A key user interface of one sub-tool, the Safety Service Patrol (SSP) benefit-cost tab (for evaluating a safety service patrol) is shown in Figure 28. Other than basic SSP program information, such as location, number of vehicles, and staff for back-end program cost calculation, the user has the flexibility to input information on roadway geometry, the SSP program, traffic, weather, and incidents. The tool also can automatically generate an evaluation report that is professionally designed for effective presentation of evaluation results.
Samples of UseA recent case study on the I-95 Corridor Coalition in New York was conducted to explain the TIM-BC tool application. This study was performed on the I-287 segment that was approximately 10 miles long, beginning at the junction with I-95 and continuing west to the Tappan Zee Bridge in New York.88 This stretch of roadway has four lanes in each direction and 14 ramps, with level terrain and straight horizontal curvature. The speed limit is 65 miles per hour, and the traffic volumes are 1,800 and 1,200 vehicles per hour with a truck percentage of 7.8 percent. During the 6-month evaluation period, there were 659 incidents on the segment. In addition to SSP program evaluation, two other potential TIM programs, driver removal laws and dispatch collocation, also are evaluated and compared with SSP. The annual program cost of SSP is calculated by the tool based on user input information on number of patrol vehicles, driver's hourly wage, working hours, fuel price, and other costs. Users are required to give an overall estimate of the annual costs of the other two programs, and a conservative value of 5,000 dollars for this segment is assumed for both programs. As shown in Table 6, SSP is the most cost-effective strategy, with a benefit-cost ratio of 18.43, while the other two strategies have relatively lower, but still significant ratios of more than 3.0. The results indicate that all three investments are cost effective and should be considered for the segment. Further, with adequate funding for TIM programs, it is recommended that SSP should be considered initially. The program costs for the driver removal laws and dispatch collocation are assumed to be conservative. If their costs, particularly the institutional components, are reduced by five times, these two strategies will be comparable with the SSP. Table 6. Evaluation results of three traffic incident management strategies.
Note that there are negative benefits of fuel consumption and emissions for the SSP in the case study, and this result is expected through the development process. From various test cases, it was observed that the fuel savings output in relatively high-volume, high-speed scenarios was negative. That is, for these scenarios, a decrease in incident duration resulted in an increase in fuel consumption over the base case. These results are reasonable given that some incidents may have the effect of slowing down fast-moving traffic to more fuel-efficient speeds. The choice to consider these negative values as costs represents a conservative approach and further reflects the fact that some congestion lowers fuel consumption despite increases in travel delays. AdvantagesThe following are a few key advantages of the developed TIM-BC tool:
ChallengesWhile the new TIM-BC tool offers the possibility of evaluating a wider range of TIM programs, there are still areas for future studies. For example, it should be noted that the results for different TIM strategies are not additive. This is because the benefits of different TIM strategies may not be independent of each other. Future studies should consider the potential interactions between these strategies, and corresponding modules should be incorporated for better evaluation. Also, the evaluation of more strategies can be potentially added as next steps, and this is particularly important when more effective TIM strategies are developed in the future. Further, under the environment of TSMO, the tool is limited to evaluating TIM strategies only, and its level consistency with evaluation results from other TSMO tools is yet to be investigated. Future studies should consider how to integrate the TIM-BC tool with other general TSMO evaluation tools to better support TSMO programs. The Strategic Highway Research Program 2 Tools — Incorporating Travel Time Reliability in Operations and Planning ModelsThe approach for modeling and estimating travel time reliability employed by researchers through the SHRP2 supplements existing simulation models with two components: a scenario manager, and a vehicle trajectory processor.89 The simulation models that are compatible with the two tools have to be particle-based, including microscopic (AimSun, VISSIM, and Paramics) and mesoscopic models (DynaSmart, DynasT, and MATSim), but not macroscopic models (TransCAD and Cube), because macroscopic models cannot generate vehicle trajectories. The Scenario Manager is a preprocessor to prepare input scenarios for the traffic simulation models. It captures exogenous sources of travel time variation, such as external events, traffic control and management strategies, and travel demand-side factors. Recognizing the importance of the scenario definition and the complexity of identifying relevant exogenous sources, the Scenario Manager provides the ability to construct scenarios that entail any mutually consistent combinations of external events. It captures parameters that define external sources of unreliability (e.g., special events, inclement weather, and work zones) and enables users either to specify scenarios with particular historical significance or policy interest, or to generate them randomly given the underlying stochastic processes of the associated events. The scenario input files generated by the Scenario Manager are then fed to the traffic simulation model. The model generates vehicle trajectory files for each of the scenarios. The Vehicle Trajectory Processor then extracts reliability-related measures from the vehicle trajectory outputs. It produces and helps visualize reliability performance measures (e.g., travel time distributions and indicators) from observed or simulated trajectories. Observed trajectories may be obtained directly through measurement (e.g., Global Positioning System-equipped probe vehicles), thus enabling validation of travel time reliability metrics generated on the basis of output. The two tools are not stand-alone applications; instead, they work as a preprocessor and a postprocessor of mesoscopic and microscopic simulation models for travel time reliability analysis on the network level, origin-destination level, path level, and segment/link level. The tools are available from the Transportation Research Board SHRP2 project website: http://www.trb.org/Main/Blurbs/170717.aspx. Application to Planning for Transportation Systems Management and Operations within CorridorsThe proposed tools can be used to evaluate TSMO benefits within corridors as long as the simulation models have been established with the corresponding TSMO strategy. Depending on the TSMO strategy, an appropriate simulation model needs to be selected. Factors to consider include the scale of analysis (e.g., regional, corridor, or intersection/segment level), and whether travel demand in terms of intensity, departure time, or mode choice needs to be considered.
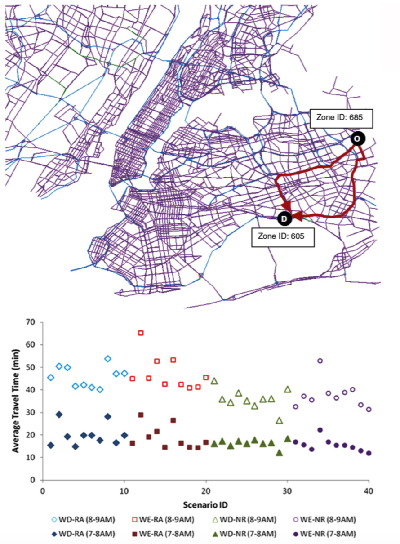
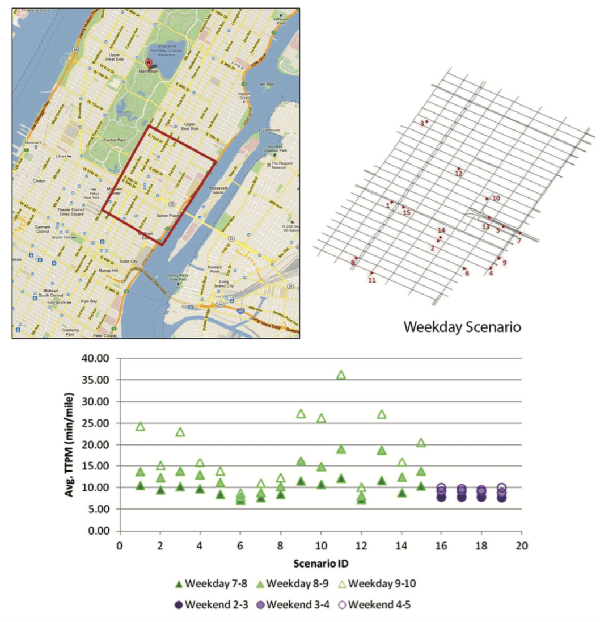
Samples of UseTwo case studies have been conducted to demonstrate how the tool set can be applied: one in mesoscopic (DYNASMART-P), and one in microscopic (AimSun). Mesoscopic Case StudyThis case study examines the effect of inclement weather on travel time reliability for weekday and weekend traffic. Specifically, reliability performance measures for the following four scenario cases were obtained: Weekdays under Rain (WD-RA), Weekends under Rain (WE-RA), Weekdays under No Rain (WD-NR), and Weekends under No Rain (WE-NR). The rain scenarios are based on historical observations. Weather data collected on May 3, 2010, at the Automated Surface Observing System weather station located at the LaGuardia Airport are used. Incident properties are characterized using parametric models. For frequency, a Poisson distribution is used to model the number of incidents for a given time period. To capture the dependency between weather and incident frequency, weather conditional incident rates are used. Figure 29 illustrates an example of the results using the New York City DYNASMART-P network. TSMO concepts, such as managed lanes, road weather management, traveler information system, traffic signal coordination, and transit signal priority (TSP), can be applied on this network, and travel time can be evaluated for both the before and after cases. Microscopic Case StudyThe objective of the microsimulation tests was to determine a range of reliability measures that is characteristic of the study area for weekday and weekend traffic. The weekday and weekend scenarios were subjected to incident and demand variation events that are typical of the study area (East Manhattan). The micro-model covers an area that includes 178 lane kilometers and 217 signalized intersections. A total of 147 centroids were connected to the network to generate origin—destination trips, including 44 gate and 103 internal centroids. The same methodology that was used to generate scenarios for the mesoscopic model using the Scenario Manager was applied for the microscopic model. The scenarios relevant for the microsimulation study area were then selected based on incidents that were located within the boundaries. Fifteen of the generated weekday scenarios and four of the weekend scenarios contained incidents within the microsimulation study area. Two base models were constructed representing peak a.m. weekday and weekend conditions. The weekday a.m. peak period model consisted of a total demand of around 155,000 vehicles over a 5-hour period from 6 a.m. to 11 a.m. The weekend peak period model consisted of a total demand of around 80,000 vehicles over a period of 3 hours from 2 p.m. to 5 p.m. The results are in formats very similar to those of the mesoscopic model (i.e., average, standard deviation, 80th percentile, Buffer Index, and Skew Index of the travel time of the regional, origin-destination, path, and link levels). This example can be used to evaluate TSMO concepts, such as incident management, special event management, ridesharing and demand management, and traveler information systems.
Advantages
Challenges
80 Federal Highway Administration, Advancing Transportation Systems Management and Operations Through Scenario Planning, FHWA-16-016 (Washington, DC: 2016). Available at: https://ops.fhwa.dot.gov/publications/fhwahop16016/index.htm. Return to note 80. 81 Federal Highway Administration, Use of Archived Operations Data in Planning, FHWA-HOP-16-017 (Washington, DC: 2016). Available Summer 2016 at: https://ops.fhwa.dot.gov/publications/fhwahop16016/index.htm. Return to note 81. 82 Federal Highway Administration, Traffic Analysis Toolbox Volume XII: Work Zone Traffic Analysis — Applications and Decision Framework, FHWA-HOP-12-009 (Washington, DC: 2012). Available at: https://ops.fhwa.dot.gov/publications/fhwahop12009/index.htm. Return to note 82. 83 Federal Highway Administration, Work Zone and Traffic Analysis Tools Web page. Available at: https://ops.fhwa.dot.gov/Wz/traffic_analysis/tools.htm. Return to note 83. 84 Federal Highway Administration, QuickZone Web page. Available at: https://ops.fhwa.dot.gov/wz/traffic_analysis/quickzone/index.htm. Return to note 84. 85 Federal Highway Administration, Work Zone and Traffic Analysis Tools Web page. Available at: https://ops.fhwa.dot.gov/Wz/traffic_analysis/tools.htm. Return to note 85. 86 For more information and access to the TOPS BC tool, refer to the FHWA's TOPS- BC web page at: https://ops.fhwa.dot.gov/plan4ops/topsbctool/index.htm. Return to note 86. 87 Federal Highway Administration, Office of Operations Research and Development, Software — Traffic Incident Management Benefit-Cost (TIM-BC) Tool. Available at: https://www.fhwa.dot.gov/software/research/operations/timbc/. Return to note 87. 88 Miller-Hooks, E., TariVerdi, M. and Zhang, X. 2012. Standardizing and Simplifying Safety Service Patrol Benefit-Cost Ratio Estimation, Report to the I-95 Corridor Coalition. Return to note 88. 89 Transportation Research Board, Strategic Highway Research Program, Report S2-L04-RW-2: Incorporating Reliability Performance Measures into Operations and Planning Modeling Tools: Application Guidelines (Washington, DC: 2014). Available at: http://onlinepubs.trb.org/onlinepubs/shrp2/SHRP2_S2-L04-RW-2.pdf. Return to note 89. | ||||||||||||||||||||||||||||||||||||||||||||||||||||||||||||||||||||||||||||||||||||||||
|
United States Department of Transportation - Federal Highway Administration |
||