Office of Operations
21st Century Operations Using 21st Century Technologies

Shared Mobility: Current Practices and Guiding Principles

APPENDIX A:Tables

Table 3. Impacts of Roundtrip Carsharing 3
U.S./CANADA Studies

Authors, Year

Number of Vehicles Removed From the road per carsharing vehicle

Percentage of Members Selling Personal Vehicle

Percentage of Members Avoiding Vehicle Purchase

VMT/VKT Change Percentage PER MEMBER

Average Monthly Cost Savings  PER MEMBER

Percentage of Partici-pants Walking More

Percentage of Partici-pants Taking Transit More

Short-term auto rental (San Francisco, CA)

(Walb & Loudon, 1986)

15.4

43.1

Empty cell Empty cell Empty cell Empty cell Empty cell

Arlington, VA, carsharing pilot

(Price & Hamilton, 2005)

25.0

68.0

-40.0

Empty cell Empty cell

54.0

54.0

Arlington carsharing

(Price et al., 2006)

29.0

71.0

-43.0

Empty cell Empty cell

47.0

47.0

CarSharing Portland (Portland, OR)

(Katzev, 1999)

26.0

53.0

Empty cell Empty cell

154 USD

Empty cell Empty cell

CarSharing Portland

(Cooper et al., 2000)

23.0

25.0

-7.6

Empty cell Empty cell

25.8.0

13.5

City CarShare (Year 1) (San Francisco)

(Cervero, 2003)

2.5

60.0

-3.0a/-58.0b

Empty cell Empty cell Empty cell Empty cell

City CarShare (Year 2)

(Cervero & Tsai, 2004)

6.8.0

29.1

67.5

-47.0a/-73.0b

Empty cell Empty cell Empty cell

City CarShare (Year 4)

(Cervero et al., 2007)

Empty cell Empty cell Empty cell

-67.0a/24.0b

Empty cell Empty cell

PhillyCarShare (Philadelphia, PA)

(Lane, 2005)

10.8c

24.5

29.1

-42.0

172 USD

Empty cell Empty cell

TCRP Report (national)

(Millard-Ballet al., 2005)

Empty cell Empty cell Empty cell

-63.0

Empty cell

37.0

40.0

UC Berkeley (U.S. and Canada)

(Martin & Shaheen, 2010)

9.0-13.0

33.0

25.0

Empty cell Empty cell Empty cell Empty cell

UC Berkeley (U.S. and Canada)

(Martin et al., 2010)

Empty cell Empty cell Empty cell

-27.0

Empty cell

12.0

22.0d

Zipcar (national)

(Zipcar, 2005)

20.0

32.0

39.0

-79.8

435 USD

37.0

40.0

Canadian Studies

Empty cell Empty cell Empty cell Empty cell Empty cell Empty cell Empty cell Empty cell

AutoShare (Toronto, Canada)

(Shaheen, et al., 2010)

6.0-8.0

15.0

25.0

Empty cell

392 CAD

Empty cell Empty cell

AutoShare (Toronto)

(Shaheen, et al., 2010)

8.0-10.0

Empty cell Empty cell Empty cell Empty cell Empty cell Empty cell

CommunAuto (Quebec, Canada)

(Benoit, 2000)

9.1

21.0-29.0

55.0-61.0

Empty cell Empty cell Empty cell Empty cell

CommunAuto (Quebec, Canada)

(Dallaire et al., 2006)

4.6c

24.0

53.0

Empty cell

492 CAD

12.0-13.0

26.0-34.0


Table 4. Demographics of the North American Roundtrip Carsharing 3 Member (N is the sample size)

Demographic Attribute

United States Carsharing

Canadian Carsharing

Total

Gender

N = 4229

N = 2024

N = 6253

Male

44%

46%

45%

Female

56%

54%

55%

Age Category

N = 4201

N = 1996

N = 6197

30 or Younger

38%

31%

35%

30 to 60

57%

64%

59%

Older than 60

6%

5%

6%

Education

N = 4235

N = 2028

N = 6263

Graduated High School

2%

4%

3%

Some College or Associates Degree

13%

21%

16%

Bachelor’s Degree

43%

39%

42%

Graduate or Professional Degree

41%

32%

38%

Other

1%

3%

2%

Income (pER HOUSEHOLD $ US)

N = 4247

N = 2034

N = 6281

Less than $50,000

34%

33%

34%

$50,000–$100,000

34%

40%

36%

$100,000–$150,000

13%

12%

13%

More than $150,000

10%

4%

8%

Decline to Respond

9%

10%

9%


Table 5. Aggregate Shift in Public Transit and Non-Motorized Modes Due to Roundtrip Carsharing3 Use


Mode

Average Hours per Week BY SURVEY RESPONDENTS

Round Trips per Week BY SURVEY RESPONDENTS

Decreased

No Change

Increased

Wilcoxon Sign Rank Test
(P-value)2

Decreased

No
Change

Increased

Wilcoxon Sign Rank Test
(P-value)4

Rail

589 (9%)

5198

494 (8%)

0.001946 a

571 (9%)

5226

484 (8%)

0.007395a

Bus

828 (13%)

4721

732 (12%)

0.007537 a

783 (12%)

4794

704 (11%)

0.02025 b

Walk

568 (9%)

4957

756 (12%)

1.19 × 10⁻⁷ c

559 (9%)

5046

676 (11%)

4.35 × 10⁻⁴ c

Bike

235 (4%)

5418

628 (10%)

2.20 × 10⁻¹⁶ c

219 (3%)

5480

582 (9%)

2.20 × 10⁻¹⁶ c

Carpool

99 (2%)

5893

289 (5%)

2.20 × 10⁻¹⁶ c

86 (1%)

5932

263 (4%)

2.20 × 10⁻¹⁶ c

Ferry

13 (0%)

6262

6 (0%)

0.05415

14 (0%)

6259

8 (0%)

0.1004

a One-tailed Wilcoxon Signed Rank Test, Decline Statistically Significant at 99%;
b One-tailed Wilcoxon Signed Rank Test, Decline Statistically Significant at 95%;
c One-tailed Wilcoxon Signed Rank Test, Increase Statistically Significant at 99%.


Table 6. Public Bikesharing5Impacts (limited to the survey respondents during the data collection period)
Program

Authors, Year

Program Location

Year of Data

Trips per Year

Km*106 per Year

CO2
Reduction (kg per Year)

Before/After Modal Share Percentage

survey Respondents Driving Less Often

Change in Vehicle Ownership Percentage

Bicing

(Romero, 2008)6

Barcelona, Spain

2008

Empty cell

Empty cell Empty cell

0.75/1.76

Empty cell Empty cell

BIXI Montreal

(Houle, 2011) (Shaheen et al., 2012)7

Montreal, Canada

2011

4,174,9178

Empty cell Empty cell Empty cell

36.30%

-3.60

BIXI Toronto

(Shaheen et al., 2012)9

Toronto, Canada

2012

Empty cell

Empty cell Empty cell

Empty cell

25.40%

-2.00

Boulder BCycle

(Boulder BCycle, 2014)10

Boulder, U.S.

2014

43,143

Empty cell

36,560

Empty cell

Empty cell Empty cell

Capital Bikeshare

(Shaheen et al., 2012)11

Washington, DC

2012

Empty cell

Empty cell Empty cell

Empty cell

41.0%

-2.10

Citi Bike

(Citi Bike, n.d.)12

New York City, NY

2014

8,231,907

22.1

3,513,051

Empty cell

Empty cell Empty cell

Denver BCycle

(Denver BCycle, 2014)13

Denver, U.S.

2014

377,229

1.3

674,169

Empty cell

Empty cell Empty cell

Hangzhou Public Bicycle Program

(Hangzhou Program Manager, Unpublished Data, 2009)14

Hangzhou, China

2009

62,780,000

376.7

69,715,000

Empty cell

Empty cell Empty cell

Hubway

(Hinds, 2011)15

Boston, U.S.

2011

140,000

Empty cell Empty cell

Empty cell

Empty cell Empty cell

Madison BCycle

(Madison BCycle, 2014)16

Madison, U.S.

2014

104,274

352,620

Empty cell

Empty cell

Empty cell Empty cell

Nice Ride Minnesota

(Shaheen et al., 2012)17

Minneapolis-St. Paul, U.S.

2012

Empty cell Empty cell Empty cell

Empty cell

52.4%

-1.90%

San Antonio BCycle

(San Antonio BCycle, 2013)18

San Antonio, U.S.

2013

65,560

610,232

93,691

Empty cell

Empty cell Empty cell

Vélib’

(The Globe and Mail, 2009) (DeMaio, 2009)

Paris, France

2007-2009

28,470,0019

Empty cell Empty cell

1%/2.5%

28%

Empty cell

Velo’v*

(Vogel et al., 2014) (Bührmann, 2007)

Lyon, France

2011

6,493,42720

Empty cell Empty cell Empty cell Empty cell Empty cell

Table 7. Race of Capital Bikeshare 5 Annual Members and Casual Users
Race

Percentage of Annual Members

Percentage of Casual Users*

2010 Census21

Caucasian

80

78.0

34.0

Asian/Pacific Islander

5.0

8.0

4.0

Black/African American

2.0

5.0

50.0

Hispanic

3.0

4.0

9.0

Native American

0.3

0.3

0.3

Other/Multi-racial

4.0

3.0

3.0

Prefer Not To Answer

6.0

2.0


Table 8. Annual/Seasonal/30-Day Bikesharing 5 Member Demographics of Cities Surveyed in Canada and U.S.
Parameters

Montreal

Toronto

Salt Lake City

Minneapolis/Saint Paul

2011 NHS Percentage Survey Percentage 2011 NHS Percentage Survey Percentage 2012 ACS Percentage Survey Percentage 2012 ACS Percentage SURVEY Percentage

Household Income

Empty cell Empty cell Empty cell Empty cell Empty cell Empty cell Empty cell Empty cell
< $10,000 9.0 5.0 6.0 2.0 12.0 0.0 11.0 5.0
$10,000 -$14,999 6.0 4.0 4.0 1.0 7.0 3.0 5.0 3.0
$15,000 - $24,999 14.0 8.0 10.0 3.0 13.0 3.0 11.0 5.0
$25,000 - $34,999 12.0 9.0 9.0 3.0 11.0 3.0 10.0 6.0
$35,000 - $49,999 17.0 14.0 14.0 6.0 12.0 10.0 14.0 12.0
$50,000 - $74,999 17.0 21.0 18.0 20.0 17.0 31.0 16.0 19.0
$75,000 - $99,999 10.0 13.0 13.0 16.0 11.0 20.0 12.0 16.0
$100,000 -$149,999 9.0 16.0 13.0 23.0 10.0 17.0 12.0 18.0
$150,000 < 5.0 9.0 13.0 26.0 8.0 13.0 8.0 17.0

Education

Empty cell Empty cell Empty cell Empty cell Empty cell Empty cell Empty cell Empty cell
Less than high school 13.0 0.0 18.0 0.0 15.0 0.0 12.0 0.0
High school/GED 18.0 3.0 24.0 3.0 14.0 0.0 18.0 2.0
Some college/apprentice 12.0 10.0 5.0 10.0 19.0 7.0 19.0 11.0
2 or 3-year College 22.0 32.0 20.0 40.0 7.0 4.0 7.0 3.0
University Bachelor's 20.0 37.0 20.0 37.0 26.0 43.0 27.0 42.0
Post-Graduate Degree 15.0 18.0 13.0 9.0 19.0 46.0 17.0 42.0

Age

Empty cell Empty cell Empty cell Empty cell Empty cell Empty cell Empty cell Empty cell
16 – 24 12.0 11.0 12.0 7.0 20.0 9.0 21.0 6.0
25 – 34 21.0 43.0 19.0 42.0 28.0 39.0 26.0 31.0
35 – 44 18.0 23.0 18.0 23.0 17.0 19.0 16.0 28.0
45 – 54 17.0 14.0 19.0 18.0 13.0 17.0 15.0 23.0
55 – 64 14.0 8.0 14.0 7.0 11.0 13.0 12.0 8.0
65 years or older 19.0 1.0 18.0 2.0 12.0 2.0 10.0 4.0
Race Empty cell Empty cell Empty cell Empty cell Empty cell Empty cell Empty cell Empty cell
Caucasian 68.0 90.0 51.0 74.0 64.0 89.0 62.0 92.0
African-American 9.0 1.0 8.0 2.0 3.0 1.0 17.0 1.0
Hispanic/Latino 4.0 4.0 3.0 1.0 21.0 5.0 10.0 2.0
Asian/Pacific Islander 11.0 3.0 34.0 20.0 9.0 3.0 6.0 5.0
Other/Multi-Racial 7.0 2.0 4.0 4.0 3.0 1.0 5.0 0.0

Gender

Empty cell Empty cell Empty cell Empty cell Empty cell Empty cell Empty cell Empty cell
Male 49.0 50.0 48.0. 70.0 51.0 66.0 50.0 55.0
Female 51.0 50.0 52.0 30.0 49.0 34.0 50.0 45.0

Note: NHS refers to the Canadian National Household Survey. ACS refers to the U.S. American Community Survey.
Across all cities, the survey received a total of N=6,168 completed surveys. The surveys in Montreal had a sample of N=1,102, Toronto had a N=1,015, Minneapolis/Saint Paul had a N=630, Salt Lake City had a N=72, and Mexico City had a N = 3,349. All bikesharing programs surveyed annual, seasonal and 30-day subscribers. For more information on this study methodology, please see: http://transweb.sjsu.edu/PDFs/research/1131-public-bikesharing-business-models-trends-impacts.pdf


Table 9. Public Bikesharing 5 Member Demographics of Mexico City
Parameter

2013 INEGI Percentage

Survey Percentage

Age

16 – 24

27.0

11.0

25 – 34

22.0

47.0

35 – 44

20.0

26.0

45 – 54

14.0

10.0

55 – 64

9.0

4.0

65 +

9.0

1.0

EDUCATION

Sin bachillerato (No High School)

45.0

1.0

Media superior (High School Second Level)

25.0

4.0

Tecnica (No U.S. equivalent)

1.0

4.0

Superior (Professional Associate)

28.0

90.0

Not Reported

Gender

Male

48.0

65.0

Female

52.0

35.0

Household Income Per Month

Less than $125

13.0

3.0

$126 to $251

21.0

4.0

$252 to $377

19.0

5.0

$378 to $628

16.0

15.0

More than $629

11.0

49.0

Not Reported

21.0

24.0

Note: INEGI is the Instituto Nacional de Estadística y Geografía, or the National Institute of Statistics and Geography, a Mexican governmental agency responsible for statistical and geographic information.


A three part figure, each with a bar chart depicting the shift in personal driving as a result of public bikesharing use. Respondents were asked to self report how often they drive a personal vehicle (e.g., car, SUV, etc.) as a result of their bikesharing use. Available options included Much more often, more often, less often, much less often, about the same, did not drive before/after, and changed driving not due to bikesharing. Across the five cities depicted (Mexico City, Montreal, Salt Lake City, Toronto, and the Twin Cities, respondents generally reported driving less (or much less often) due to public bikesharing ranging from 29% in Toronto to 55% in Salt Lake City.

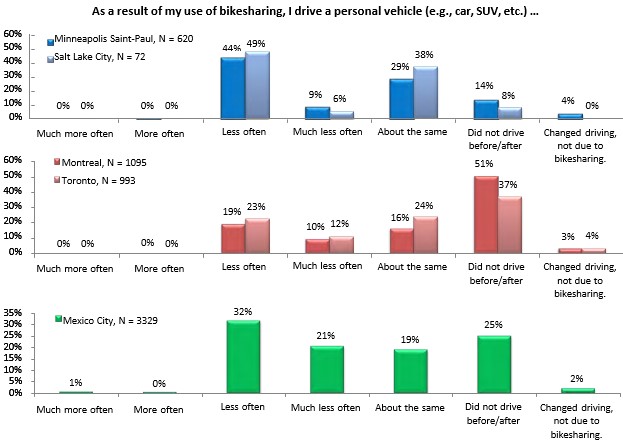
Figure 7. Shift in Personal Driving as Result of Public Bikesharing 5 Use


Table 10. Ridesourcing 22 Demographics of Survey Respondents in San Francisco

Age

Ride-sourcing

Percentage

Taxi Percentage a

SF Percentage b

15-24

50

16

3.0

11.0

25-34

178

57

43.0

22.0

35-44

59

19

27.0

16.0

45-54

20

6

13.0

14.0

55-64

3

1

9.0

12.0

65-74

0

0

4.0

7.0

75+

0

0

2.0

7.0

Sample

310


2013 Household Income (USD)23

Ride-sourcing

Percentage

SF Percentage b

$30K or less

28

9

26.0

$30-70K

74

23

22.0

$71-100K

56

18

13.0

$100-200K

86

27

25.0

$200K+

35

11

13.0

(Decline to Respond)

37

12

n/a

SAMPLE

316


Gender

Ride-sourcing

Percentage

Taxi Percentage a

SF Percentage b

Female

124

40

n/a

49.0

Male

184

60

n/a

51.0

Sample

308


Education

Ride-sourcing

Percentage

SF Percentage b

Less than a bachelor’s degree

51

16

46.0

Bachelor’s degree

173

54

33.0

Graduate degree (Master’s/Ph.D.)

87

27

21.0

Other degree

10

3

n/a

SAMPLE

321


Data Sources:

a 2013 SFMTA taxi user survey

b 2012 ACS one-year estimate

This study conducted an intercept survey of ridesourcing customers in San Francisco during May and June 2014. Surveyors targeted two types of potential respondents: those who had just completed a ridesourcing trip ("intercept trips"), and those who had used ridesourcing within the last two weeks ("previous trips"). Both types responded to identical surveys.


Table 11. Respondent Modal Preference if Ridesourcing22 (uberX/Lyft/Sidecar) Were Not Available

Percentage of Respondents

Do you have a car at home?

Yes

No

Taxi

39%

41%

35%

Bus

24%

17%

33%

Rail (BART, streetcar, Caltrain)

9%

7%

10%

Walk

8%

9%

6%

Bike

2%

2%

3%

Drive my own car

6%

10%

0%

Get a ride with friend/family

1%

1%

2%

Other*

11%

12%

10%

Total

100%

100%

100%

Sample

302

175

124

* "Other" includes several responses indicating the respondent would have used another ridesourcing service.
This study conducted an intercept survey of ridesourcing customers in San Francisco during May and June 2014. Surveyors targeted two types of potential respondents: those who had just completed a ridesourcing trip ("intercept trips") and those who had used ridesourcing within the last two weeks ("previous trips"). Both types responded to identical surveys.

Table 12. Ridesourcing22 and Taxi Trips Travel Times in San Francisco
PARAMETERS

Ridesourcing Trips

Taxi Trips

Avg total time by public transit (wait + travel)

32.5 min

31.0 min

Avg total time by ridesourcing/taxi (wait + travel)

22.1 min

23.7 min

Trips that are at least 50% longer by public transit

86%

88%

Trips that are least twice as long by public transit

66%

61%

Sample

283

277

This study conducted an intercept survey of ridesourcing customers in San Francisco during May and June 2014. Surveyors targeted two types of potential respondents: those who had just completed a ridesourcing trip ("intercept trips") and those who had used ridesourcing within the last two weeks ("previous trips"). Both types responded to identical surveys.
Reference: Rayle, L., Dai, D., Chan, N., Cervero, R., and Shaheen, S. (2016). "Just A Better Taxi? A Survey-Based Comparison of Taxis, Transit, and Ridesourcing Services in San Francisco,"Transport Policy, Volume 45, pp. 168-178.

References

Benoit, R. (2000). Potentiel de L'Auto-Partage Dans Le Cadre d'Une Politique de Gestion de La Demande en Transport. Forum de L'AQTR, Gaz à Effet de Serre: Transport et Développement, Kyoto: Une Opportunité d'Affaires?

Borecki, N., Buck, D., Chung, P., Happ, P., Kushner, N., Maher, T., Buehler, R. (2012). Virginia TechCapital Bikeshare Study. Blacksburg: Virginia Tech.

Boulder BCycle. (2014). 2014 Annual Report.
https://boulder.bcycle.com/docs/librariesprovider35/default-document-library/b-cycle-annual-report-2014.pdf?sfvrsn=4

Bührmann, S. (2007). New Seamless Mobility Services: Public Bicycles.

Cervero, R. (2003). City CarShare: First-Year Travel Demand Impacts. Transportation Research Record, 159-166.

Cervero, R., & Tsai, Y. (2004). City CarShare in San Francisco, California: Second-Year Travel Demand and Car Ownership Impacts. Transportation Research Record, 117-127.

Cervero, R., Golub, A., & Nee, B. (2007). City Carshare: Longer-Term Travel Demand and Car Ownership Impact. Transportation Research Record, 70–80.

Cooper, G., Howe, D., & Mye , P. (2000). The Missing Link: An Evaluation of CarSharing Portland Inc. Portland, Oregon. Portland: Oregon Department of Environmental Quality.

Dallaire, Y., Lafond , N., Lanoix , C., & Viviani , M. (2006). Le projet auto + bus: Évaluation d’initiatives de mobilité combinée dans les villes canadiennes. Montreal: Tecsult Inc.

DeMaio, P. (2009). Bike-Sharing: History, Impacts, Models of Provision, and Future. Journal of Public Transportation 14-4: 41–56.

Denver BCycle. (2014). 2014 Annual Report. https://denver.bcycle.com/docs/librariesprovider34/default-document-library/annual-reports/2014-denver-bike-sharing-annual-report.pdf?sfvrsn=2

The Globe and Mail. (2009). Paris’s Pedal Power Sets Free Uncivilized Behaviour. http://www.theglobeandmail.com/news/world/pariss-pedal-power-sets-free-uncivilized-behaviour/article4276785/

Hangzhou Program Manager, Unpublished Data, 2009

Hinds, K. (2011). In Its First Season, Boston Bike Share Exceeds Projections; Will Expand Next Spring. http://www.wnyc.org/story/283407-in-its-first-season-boston-bike-share-exceeds-projections-will-expand-next-spring/

Houle, M-H. (2011). 4 174 917 déplacements en BIXI en 2011 - BIXI atteint le seuil des 40 000 membres.http://www.newswire.ca/fr/news-releases/4-174-917-deplacements-en-bixi-en-2011---bixi-atteint-le-seuil-des-40-000-membres-509107401.html

Katzev, R. (1999). Carsharing Portland: Review and Analysis of Its First Year. Portland: Department of Environmental Quality.

Lane, C. (2005). PhillyCarShare: First-Year Social and Mobility Impacts of Carsharing in Philadelphia, Pennsylvania. Transportation Research Record, 158-166.

Madison BCycle. (2014). 2014 Season Overview. https://madison.bcycle.com/docs/librariesprovider19/default-document-library/2014-annual-report-madison-bcycle.pdf?sfvrsn=0

Martin, E., & Shaheen, S. (2010). Greenhouse Gas Emission Impacts of Carsharing in North America. San Jose: Mineta Transportation Institute

Martin, E., & Shaheen, S. (2011). The Impact of Carsharing on Public Transit and Non-Motorized Travel: An Exploration of North American Carsharing Data.. Energies. doi.10.3390/en4112094

Martin, E., & Shaheen, S. (2010). Greenhouse Gas Emission Impacts of Carsharing in North America. San Jose: Mineta Transportation Institute.

Martin, E., Shaheen, S., & Lidicker, J. (2010). Impact of Carsharing on Household Vehicle Holdings: Results from a North American Shared-Use Vehicle Survey. Transportation Research Record, 150–158.

Millard-Ball, A., ter Schure, J., Fox, C., Burkhardt, J., & Murray, G. (2005). Car-Sharing: Where and How It Succeeds. Washington, D.C.: Transportation Research Board.

Price, J., & Hamilton, C. (2005). Arlington Pilot Carshare Program. Arlington: Arlington County Commuter Services, Division of Transportation.

Price, J., DeMaio, P., & Hamilton, C. (2006). Arlington Carshare Program. Arlington: Arlington County Commuter Services, Division of Transportation.

Rayle, L., Dai, D., Chan, N., Cervero, R., and Shaheen, S. (2016). "Just A Better Taxi? A Survey-Based Comparison of Taxis, Transit, and Ridesourcing Services in San Francisco," Transport Policy, Volume 45, pp. 168-178.

Romero, C. (2008). SpiCycles – in Barcelona. Presented at the Final Conference of the Chamber of Commerce & Industry of Romania, Bucharest, Romania.

San Antonio Office of Environmental Policy. San Antonio Bikes. Presented at the Texas Trails and Active Transportation Conference, San Antonio, TX, February 1-3, 2012. http://www.biketexas.org/

Shaheen, S., Martin, E., Cohen, A., and Finson, R. (2012). Public Bikesharing in North America: Early Operator and User Understanding. Mineta Transportation Institute Report Number 11–26.

Shaheen, S., Cohen, A., & Chung, M. (2010). North American Carsharing: A Ten-Year Retrospective. Transportation Research Record 09-3688, 35–44.

Shaheen, S., Martin, E., Chan, N., Cohen, A., & Pogodzinski, M. (2014). Public Bikesharing in North America During A Period of Rapid Expansion: Understanding Business Models, Industry Trends and User Impacts. San Jose: Mineta Transportation Institute.

Vogel, M., Hamon, R., Lozenguez, G., Merchez, L., Abry, P., Barnier, J., Borgnat, P., Flandrin, P., Mallon, I., and Robardet, C. (2014). From bicycle sharing system movements to users: a typology of Vélo"v cyclists in Lyon based on large-scale behavioural dataset. Journal of Transport Geography. http://liris.cnrs.fr/Documents/Liris-6880.pdf

Walb, C., & Loudon, W. (1986). Evaluation of the Short-Term Auto Rental (STAR) Service in San Francisco, CA. Washington D.C.: Urban Mass Transportation Administration. Office of Technical Assistance.

Zipcar. (2005, July 31). Zipcar Customer Survey Shows Car-Sharing Leads to Car Shedding. Retrieved from Zipcar: http://www.zipcar.com/press/releases/press-2

3Carsharing members have temporary access to a vehicle without the costs and responsibilities of ownership. Individuals typically access vehicles by joining an organization that maintains a fleet of cars and light trucks deployed in lots lo cated within neighborhoods, public transit stations, employment centers, and colleges/universities. Typically, the carsharing operator provides insurance, gasoline, parking, and maintenance and participants pay a fee each time they use a vehicle.

4 The Wilcoxon signed-rank test is a non-parametric statistical hypothesis test used when comparing two related samples, matched samples, or repeated measurements on a single sample to assess whether or not their population mean ranks differ.

5 Bikesharing users access bicycles on an as-needed basis for one-way (point-to-point) or roundtrip tripmaking. Station-based bikesharing kiosks are typically unattended, concentrated in urban settings, and offer a one-way station-based service (bicycles can be returned to any kiosk). Free-floating bikesharing offers users the ability to check-out a bicycle and return it to any location within a predefined geographic region. Bikesharing provides a variety of pickup and drop-off locations. The majority of bikesharing operators cover the costs of bicycle maintenance, storage, and parking. Generally, trips of less than 30 minutes are included within the membership fees. Users join the bikesharing organization on an annual, monthly, daily, or per-trip basis.

6 Sample Size Unavailable

7 Sample Size: 3,322

8 Based on usage from 40,000 members and 125,831 casual users

9 Sample Size: 853

10 Based on usage from 1,561 members and 9,998 casual users

11 Sample Size: 5,248

12 Sample Size Unavailable

13Sample comprised of 3,980 annual members and 70,332 casual users.

14 Sample Size Unavailable

15 Sample Size: 3,629

16 Sample comprised of 2,622 annual members and 18,651 casual users.

17 Sample Size: 1,238

18 Sample comprised of 556 annual members and 15,873 casual users.

19 Based on approximately 250,000 system subscribers.

20 Sample comprised of 4,363,500 trips by annual members and 2,129,927 trips by casual users. Sample comprised of approximately 50,000 annual members. Precise sample size of annual members and casual users unavailable.

21 The 2010 US census did not tally bicycle users. Data represent Washington D.C. only, not the metropolitan statistical area. Membership may include some users outside of the District of Columbia.

22 Ridesourcing services (also known as transportation network companies (TNCs) or ride-hailing) provide prearranged and on-demand transportation services for compensation, which connect drivers of personal vehicles with passengers. Smartphone mobile applications are used for booking, ratings (for both drivers and passengers), and electronic payment. There are a variety of vehicle types that can be offered by these services including: sedans, sports utility vehicles, vehicles with car seats, wheelchair accessible vehicles, and vehicles where the driver can assist older or disabled passengers.

23 Corresponding data for taxi users unavailable.

Office of Operations