CHAPTER 8. OBJECTIVE 5: ADVANCE THE STATE OF THE PRACTICE BY PROMOTING TAILORED MANAGEMENT STRATEGIES FOR DIFFERENT REGIONS
There is not a universal approach to developing and implementing strategies to address winter weather. On the contrary, there are a wide range of potential methods and strategies that can be tailored to address the unique local conditions (pavement conditions, etc.). The Road Weather Management Program (RWMP) encourages State departments of transportation (DOT) to create a customized approach to road weather management that accounts for the local context (e.g., road conditions, forecasts, etc.). The activities under Objective 5 assess the variability of management strategies and methods used by State DOTs in order to consider local conditions. Four performance measures (PM) are used to document progress for this objective.
PM #15: Number of States disseminating weather advisory and other road weather information to travelers
This measure focuses on State DOTs providing road weather advisory information to travelers. Advisory information may include pre-trip and en route cautionary messages, weather advisories, travel times, accident reports, pavement surface conditions, and routing or diversion information. Types of weather information commonly disseminated to travelers include:
- Atmospheric observations (e.g., precipitation and air temperature from environmental sensor station (ESS) and airport observations).
- Atmospheric conditions (e.g., sky conditions, precipitation, wind speed/direction, and air temperature from analyses of observed weather data).
- Route-specific pavement condition data (e.g., dry, wet, icy, compact snow, plowed, flooded).
- Video images of selected routes.
- Weather-related travel restrictions (e.g., tire chain requirements, closed routes).
- Weather advisories (e.g., National Weather Service [NWS] watches and warnings).
- Weather forecast data (e.g., weather service provider-generated weather forecasts).
- Route-specific road weather forecasts.
Effective messaging to travelers is an essential part of road weather management. This measure assesses the level of deployment nationally in providing advisories to the traveling public. Figure 13 shows the number of States reporting that they provide advisory weather information using four different technologies including Dynamic Message Signs (DMS), Highway Advisory Radio (HAR), 511 phone system, and traveler information website in 2004 and 2007. The source of the 2004 and 2007 data is the Intelligent Transportation Systems (ITS) Deployment Statistics Survey. The 2015 data were pulled from the State DOT survey. For this update, the website, 511 phone systems and social media are merged into one category.
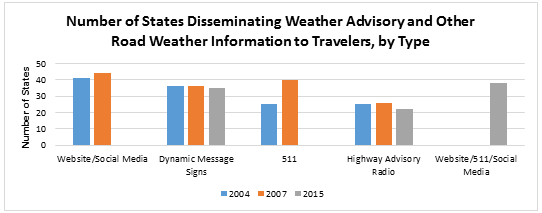 Figure 13. Graph. Number of States Disseminating Weather Advisory and Other Road Weather Information to Travelers, By Type.
As shown in Figure 14, online sources (website and social media) and 511 phone systems continue to be the most commonly used platforms to disseminate weather advisory and other information to the public. Use of HAR has decreased, and the use of dynamic messaging signs has decreased slightly.
In the 2015 State DOT survey, respondents also indicated the level of deployment for each type of communication platform.
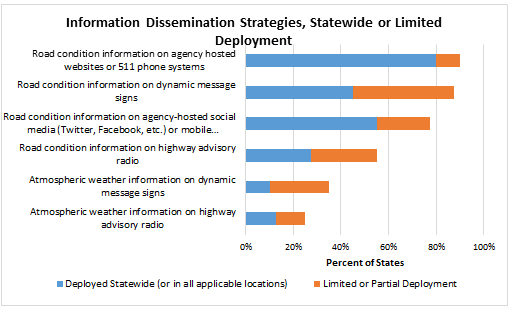 Figure 14. Graph. Information Dissemination Strategies.
Overall, providing road condition information on websites or 511 phone systems and DMS is more prevalent, followed by agency hosted social media and other mobile applications, and highway advisory radio. For atmospheric weather information, 35 percent of States reported full or partial deployment, and 25 percent reported full or partial use of highway advisory radio for disseminations.
The 2013 ITS Deployment Survey asked respondents whether they deployed safety warning systems related to road weather events. Seventeen (17) State DOTs responded that they do deploy safety warnings. Respondents also indicated for which types of hazards they have safety warning systems, shown in Figure 15.
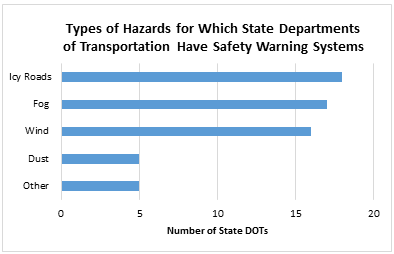 Figure 15. Graph. Types of Hazards for Which State Departments of Transportation Have Safety Warning Systems.
Safety warning systems are most commonly used for icy roads, followed by fog, wind, dust and other (not specified).
PM #16: Number of agencies using control and treatment strategies during weather events
Control and treatment strategies, like advisory strategies, are important and effective actions agencies can take in response to all types of road weather conditions. Control and treatment strategies include ramp meters, traffic signal timing, variable speed limits, etc. This performance measure assesses the type of strategies used in response to weather events and the extent to which they are deployed by State DOTs. Respondents to the State survey provided information on which strategies are used and whether they have statewide or limited/partial deployment. The results are shown below in Figure 16.
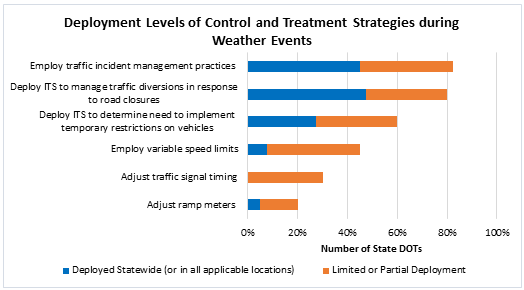 Figure 16. Graph. Level of Deployment of Control and Treatment Strategies during Weather Events.
The most widely deployed strategy, either partially or statewide, is employing traffic incident management practices (83 percent). The least commonly used strategy is ramp meter adjustment (20 percent). As shown in Table 17, the overall prevalence of control and treatment strategies remained largely the same, with the exception of ramp metering and traffic signal timing which changed places at the bottom of list.
Table 17. Rankings of Selected Control and Treatment Strategies (2013 and 2015).
| Control and Treatment Strategy |
2013 Ranking |
2015 Ranking |
| Employ traffic incident management practices |
1 |
1 |
| Deploy ITS to manage traffic diversions in response to road closures ) |
2 |
2 |
| Deploy ITS to determine need to implement temporary restrictions on vehicles |
3 |
3 |
| Employ variable speed limits |
4 |
4 |
| Adjust traffic signal timing |
6 |
5 |
| Adjust ramp meters |
5 |
6 |
ITS – intelligent transportation systems
PM #17: Number of agencies that have participated in or conducted road weather management capability maturity assessment exercises
This measure assesses the number of agencies that have conducted or participated in capability maturity assessment exercises, in which agencies examine current practices and identify business process improvements to help establish road weather management (RWM) as a core function. FHWA's Capability Maturity Framework (CMF) tool prompts agencies to develop action plans for implementing improved RWM capabilities. Capability maturity assessment is a first step towards greater mainstreaming of road weather management programs at State DOTs.
The framework was recently developed in 2014. Colorado DOT supported a validation exercise of the framework and various State and local agencies were part of the framework development process, but additional use of the framework is expected to occur in 2015 and beyond through facilitated workshops. Note that while not strictly for road weather, other capability assessments such as the American Association of State Highway and Transportation Officials (AASHTO) Capability Maturity Model (CMM) address issues relating to road weather management as well and have been used by many State DOTs as part of the Strategic Highway Research Program 2 (SHRP2) implementation process. While participation in these exercises is currently low, the RWMP anticipates that capability maturity exercises will increase and intends to track the participation levels in the coming years.
PM #18: Number of agencies that coordinate with their local forecast offices for road weather management and operations
Local weather forecast information is a critical input in road weather management and operations decision-making. When a State DOT makes an effort to coordinate with its National Weather Service (NWS) local forecast office, it reflects a commitment to enhancing the performance of road weather management and operations activities. This measure quantifies the number of agencies that are mainstreaming road weather management activities by coordinating with their local weather forecast offices, ranging from routine coordination to limited or no coordination.
The State DOT survey asked State DOTs to describe the extent of their coordination with the NWS local forecast office. Seventy-five percent of respondents reported at least some coordination with the NWS local forecast office. A small group of DOTs (7.5 percent) reported using publicly available information provided by the media and NWS, despite not having direct coordination, as illustrated in Figure 17.
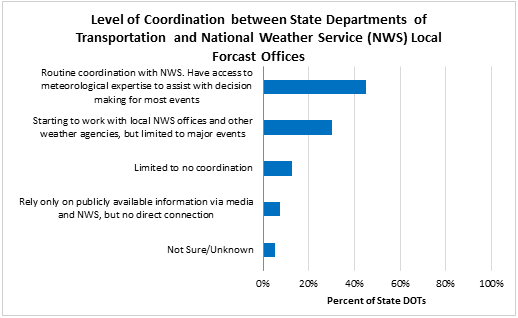 Figure 17. Graph. Level of Coordination between State Departments of Transportation and National Weather Service Local Forecast Offices for Road Weather Management and Operations Activities.
Summary
State DOTs are using a range of advisory, control, and treatment strategies as part of road weather management. Additionally, a large majority of agencies use local weather forecast information, either through routine coordination with the local NWS office or by accessing publicly available forecasts, to inform decision-making that allows for more effective strategy deployment. However, the RWMP has an opportunity to help advance the state of the practice by encouraging more States to conduct RWM capability maturity assessment exercises, which will help to further institutionalize RWM activities within agencies.