CHAPTER 6. OBJECTIVE 3: TRANSPORTATION, WEATHER, AND RESEARCH COMMUNITIES USE AND RELY UPON FIXED AND MOBILE ROAD WEATHER OBSERVATIONS
The transition from Clarus to the Meteorological Assimilation Data Ingest System (MADIS) signals momentum towards the creation of a national operational system of real-time (or near real-time) and archived observational road weather data. Ultimately, MADIS will offer a robust set of quality data that will be available to support traffic management, inform maintenance decision-making and performance measurement, and provide information on current conditions to the traveling public. The performance measures (PM) under Objective 3 capture progress towards continued growth in the use of fixed and mobile road weather observations by State departments of transportation (DOT). Additionally, this objective not only examines the availability of data, but also the subscription rates and use of observational data at State DOTs – which gauge the impact of the availability of data on strategic and tactical decision-making for weather-related maintenance and traffic operations.
PM #10: Number of State departments of transportation that are participants in the Meteorological Assimilation Data Ingest System program
The transition from Clarus to MADIS is a new activity since the 2012 update. The Road Weather Management Program (RWMP) is supporting the National Oceanic and Atmospheric Administration (NOAA) by working with State DOTs to secure data sharing agreements and helping to ensure data quality by integrating quality checking algorithms into the system. This performance measure tracks the number of State DOTs that are participating in the MADIS program by signing a data sharing agreement and providing real-time data to MADIS. According to RWMP records, twelve States have participated in the MADIS program as of April 2015, as shown below in Figure 8. These states are: Alaska, Arizona, Iowa, Idaho, Kentucky, Minnesota, Missouri, Montana, North Dakota, New York, Oregon, and Vermont.
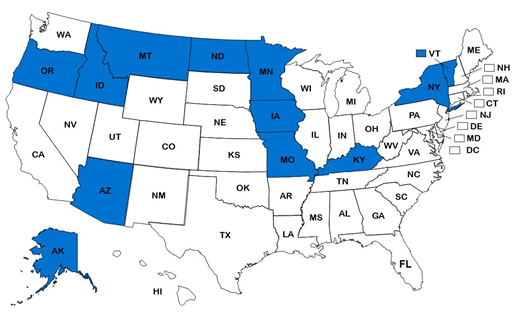 Figure 8. Chart. State Departments of Transportation Participating in the Meteorological Assimilation Data Ingest System Program.
PM #11: Number of State Departments of Transportation that subscribe to road weather products and services
This performance measure reflects the number of State DOTs reporting that they subscribe to various road weather products and services. These products and services support the DOT's advisory, control, and treatment strategies. In addition to mass media, various weather data are available to agencies from both public and private sources including information from the NWS, the Federal Aviation Administration (FAA), sensors deployed by federal and State agencies, and private-sector value-added services. In recent years, social media outlets have become a source of information as well. The RWMP has played a vital role in the development, promotion, and distribution of road weather information. Coordination with the National Weather Service (NWS) and Office of the Federal Coordinator for Meteorological Services (OFCM) has helped bring the needs of transportation agencies to the forefront, thereby enabling the NWS and OFCM to help increase awareness of the relevance of their products to the transportation community.
The RWMP encourages State DOTs and other transportation agencies to access road weather information through a wide variety of sources. This measure reflects the extent to which the major sources of weather information in transportation decision-making are being accessed by the States. Increases in both the number and nature of subscribed road weather products point to growing sophistication in the road weather community regarding the acquisition and use of these data.
This measure compares the percentage of States subscribing to road weather products and services in 2007, 2013, and 2015. Data from 2007 were obtained from the Intelligent Transportation Systems (ITS) Deployment Statistics survey; 2013 and 2015 data are from the respective RWMP surveys of State DOTs. Figure 9 shows the percentage of State DOTs that used selected sources of road weather information. However, because these data are derived from two different types of surveys with different wording and sets of respondents, they are not fully comparable. However, the results show that subscription to National Weather Service Products held steady since 2013. There has been a slight increase in the use of agency sensors (road weather information systems [RWIS]/probes), and a slight decrease in use of Private Weather Service Providers, agency field personnel, and Federal Aviation Administration (FAA) (automated surface observing system [ASOS], automated weather observing system [AWOS]) products. There was a precipitous decline in the use of National Sensor Data sources (i.e., MADIS or previously Clarus). This is likely attributed to the recent transition from Clarus to MADIS and is likely a temporary blip as full transition between MADIS and Clarus occurs.
The respondents identified other sources of weather and road weather information, including: maintenance decision support systems (MDSS), mobile weather sensors (air temp, road temp, relative humidity, dew point, etc.); internet websites and applications; and University Meteorology Departments.
![Graph shows the percentage of State DOTs that used selected sources of road weather information. The results show that subscription to National Weather Service Products held steady since 2013. There has been a slight increase in the use of agency sensors (road weather information systems [RWIS]/probes), and a slight decrease in use of Private Weather Service Providers, agency field personnel, and Federal Aviation Administration (FAA) (automated surface observing system [ASOS], automated weather observing system [AWOS]) products. There was a precipitous decline in the use of National Sensor Data sources (i.e., MADIS or previously Clarus).](images/f9.png) Figure 9. Graph. Percent of States that Subscribe to Weather and Road Weather Products and Services.
Figure 9. Graph. Percent of States that Subscribe to Weather and Road Weather Products and Services.
PM #12: Number of State Departments of Transportation collecting mobile observations of road weather data from appropriate vehicle fleets
This measure tracks the growth in the collection and use of mobile observations of road weather data from vehicle fleets. In addition to vehicle location data from Automatic Vehicle Location (AVL) systems and radio communication between the driver and the maintenance center, mobile road weather observations can also include more detailed maintenance vehicle information such as plow status and material usage, and/or road weather measurements, such as pavement surface and air temperatures.
Systems to provide these data are built into the vehicle and include wireless transmission to a central dispatch in real- or near-real time. The idea of utilizing passenger and fleet vehicles as weather observation probes is promising due to the potential to increase the coverage and quality of the road weather observations. Resting on the connectivity offered by rapidly evolving communication technology, the use of mobile observations for road weather management is closely linked to the Connected Vehicle research initiatives. The vision espoused by the program is that mobile observations will offer higher resolution observations that spatially augment fixed sensors. Major activities/projects of interest for the performance measures update include:
- Integrated Mobile Observations (IMO) – This program seeks to collect data from maintenance fleets that are equipped with AVL/MDSS technologies and other sensors. Results from the program will help develop the requirements for data and communication requirements, enhance and expand the post-processing algorithms to turn the data into weather observations, and tie these observations to existing weather networks. Under the IMO project, the RWMP is working with Nevada, Minnesota and Michigan DOTs, to collect mobile observations from their DOT vehicle fleets. More recent research indicates that other States are developing or deploying similar capabilities.
- Vehicle Data Translator (VDT) Research – Translating the point data coming from vehicles to meaningful quality-checked information is the goal of the VDT research. The VDT provides a way to assimilate mobile data into existing fixed stations to generate basic and advanced road segment weather information.
- Dynamic Mobility Applications (DMA) – Collecting mobile observations and transforming them into useful weather observation models is one part of the challenge. The second part relates to the use of such observations in weather-related mobility applications.
Increased use of mobile observations will support a wide variety of strategic and tactical decision-making for State DOT maintenance and traffic operations. In the State DOT survey, respondents were asked whether their agencies collect real-time field data from maintenance vehicles and from what percentage of the applicable fleets. This year, the survey also included a question to identify the type of data that are collected from maintenance vehicles, as well as from what percentage of the applicable fleets (Figure 10).
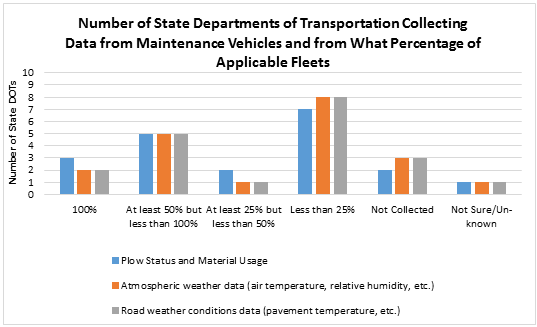 Figure 10. Graph. Number of State Departments of Transportation Collecting Data from Maintenance Vehicles and From What Percentage of Applicable Fleets.
Overall, 50 percent of States surveyed collect real-time field data from maintenance vehicles. Figure 10 shows the type of data collected and from what percentage of the applicable vehicle fleets. The results of the survey show that collecting data fleet-wide is starting to become a practice; as many as three DOTs reported using 100 percent of the fleet to collect data, compared to zero in 2013.
PM #13: Number of State Departments of Transportation reporting the use of Environmental Sensor Stations in operations and maintenance activities
This performance measure tracks the number of fixed ESS that exist in the United States and how they are used in operations and maintenance activities. This definition is slightly different from previous updates where this measure tracked only the number of ESS sensors.
While the number of ESS deployed is an important statistic, it can be misleading. First, since many States have already deployed ESS, the number in those States is not expected to increase substantially in the coming years. Second, not all installations of ESS may be used in support of operations and maintenance activities.
In the State DOT survey, the respondents reported a total of 2,473 ESS. This is a slight decrease from 2,499 in the 2012 report. Figure 11 depicts how ESS are used to support road weather management. The most common use of ESS is to support traffic management and maintenance decision-making; more than 90 percent of responders report this use. The majority of agencies also use ESS data to provide current conditions to traveler information systems (61 percent) and input for segment-level forecasts (58 percent).
Respondents also identified other uses for ESS including: after-action reports and performance assessment post weather events, providing the data to the public through the agency website, and uploading it to the State's 511 system to make it easier for freight, transit, and the traveling public to access this information in order to make more informed decisions.
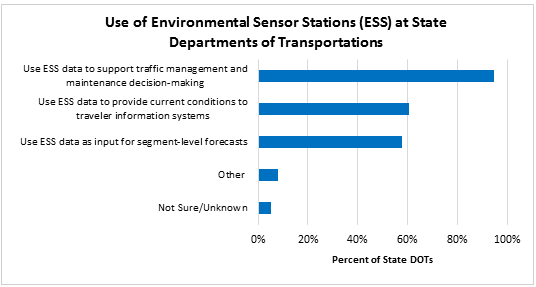 Figure 11. Graph. Use of Environmental Sensor Stations at State Departments of Transportation.
Summary
The performance measures demonstrate overall success for the activities under Objective #3, indicating progress in these early stages of the development and application of a national database of observational data (i.e., MADIS). As of early 2015, twelve State DOTs have data sharing agreements. These early implementers are comprised primarily of States with higher levels of engagement in RWMP activities. In the future, a concerted effort may be needed to help NOAA establish data sharing agreements with those States with lower levels of engagement to meet the goal of the MADIS program.
Additionally, the results show modest strides in the collection of mobile observations of road weather data from vehicle fleets, specifically the collection of data using the entire DOT fleet is beginning to emerge as a practice. However, there is still room for significant improvement, as the largest group of respondents reported collecting mobile data from less than 25 percent of the fleet. There was a slight decrease in the number of reported ESS, but this is not very surprising as the 2012 Update noted that a major increase in the overall number of stations was not expected (given the nature of ESS deployment). The results also indicate widespread application of data to support traffic management and maintenance decision-making. Ninety-five percent of State DOTs reported using ESS data for decision-making.