CHAPTER 5. OBJECTIVE 2: ENSURE ROAD WEATHER MANAGEMENT INVESTMENTS IMPROVE HIGHWAY PERFORMANCEThrough implementation of various activities, products, and services supported by the Road Weather Management Program (RWMP) and growing capabilities at State and local agencies, meaningful improvements in highway performance are expected nationally during adverse weather conditions. The following six performance measures (PM) are used to monitor progress and performance to identify how program activities are contributing to overall performance of the highway system. PM #3: Number of agencies that collect and report road weather-related performance measures to the publicCollecting and reporting road weather-related performance measures to the public enhances State departments of transportation (DOT) transparency. Conveying the effectiveness and efficiency of road weather management (RWM) activities can be a valuable public relations tool for the agency, helping the public better understand how public funds are spent on these types of activities. Reporting may include dashboards, winter maintenance reports, seasonal summaries, etc. Different performance measures for snow and ice control have been used in the United States and abroad with varying degrees of success, but it is difficult to establish widely accepted standards of success applicable to different roadway classifications, storm characteristics, traffic conditions, or even location. The lack of widely accepted standards for measuring success of snow and ice control activities has been a long-standing concern and challenge for the winter maintenance community for the following reasons:
In spite of these challenges, many State and local agencies have developed approaches to measure performance for snow and ice control. Starting with measures that focus on maintenance inputs and outputs, agencies have started to develop measures using data from field reports, maintenance management systems, and traffic operations to improve their operations. This has led to a patchwork of measures that are defined and used in an ad-hoc manner at an agency level. Among the State DOTs surveyed, 23 DOTs (58%) reported regularly collecting and reporting some form of road weather performance measures. Eight States reported they did not collect and report road weather performance measures, and eight respondents were uncertain. Unfortunately, the responses to the survey did not provide more detail on the nature of the performance assessment conducted by the 23 States. PM #4: Number of agencies that have a process for evaluating the return on investment or net benefit of their road weather management investmentsEvaluating return on investment (ROI) is a management process State DOTs can use to evaluate the effectiveness of road weather measurement activities. The majority of States reported that they did not have a process or were not sure regarding evaluating ROI or the net benefits of road weather management investments. Out of the respondents, five agencies do have a process in place. Figure 4 shows the number of State DOTs that have a process for evaluating ROI or net benefits of RWM investments. 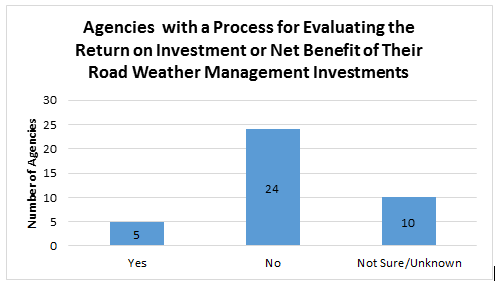 Figure 4. Graph. Number of Agencies that Evaluate Return-on-Investment or Net Benefits of Road Weather Management. PM #5: Reductions in agency costs of winter weather-related maintenance and operations activitiesThis measure tracks the cost of winter maintenance activities (identified as snow and ice removal) experienced by State and local agencies on an annual basis. Weather-related maintenance costs are a significant portion of the State and local agency budgets. State and local statistics on expenditures for snow and ice removal are available on an annual basis as part of the Highway Statistics publication series, a data compilation created and maintained by the United States Department of Transportation (USDOT) Federal Highway Administration (FHWA) Office of Highway Policy Information (OHPI).(11) Figure 5 shows the national expenditures for snow and ice removal for a 12-year period between 2001 and 2012. The previous FHWA RWMP Performance Measurement Report tracked this data for the ten year period between 2001 and 2010.(12) The current report shows 12 years of data updated through 2012 with the last three years (2010, 2011, and 2012) highlighted.(13) 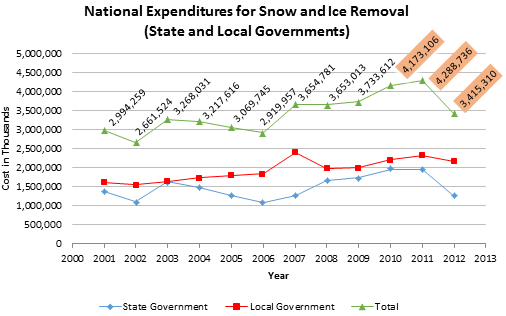 Figure 5. Graph. Annual Expenditures for Snow and Ice Removal (State and Local Governments). These national numbers for the cost of winter maintenance activities are hard to attribute to RWMP performance. Long term trends in the data can be indicative of overall performance; however, seasonal and geographic variation in weather and road weather conditions and local practices create significant variation in the data. While the causes of winter maintenance cost increases are not easily broken down nationally, individual States have reported increased costs for winter weather operations in recent years. Most States in the Midwest and East Coast have reported historic spending on snow removal due to the increasing price of road salt and sand. For example, New Jersey, Illinois, and Georgia have spent over $97.7 million, $100 million, and $2 million, respectively, for snow and ice removal in the year 2014.(14) North Carolina's Department of Transportation (NCDOT) has also spent over 30.1 million going over the budgeted $30 million, $12.9 million of which was spent in a week alone.(15) Planners have also had trouble allocating budget for road salt, maintenance, labor and equipment due to unpredictable weather patterns in recent years. Cities typically base budgets on reports from the past three to five years. Boston's funding for snow removal services has increased throughout the years with a winter budget of $18.5 million set aside for the year 2014.(16) Comparing that to funds in 2005, there has been an increase of $10.8 million in just 9 years. Boston is not the only city surpassing the preset budget for snow removal. The St. Louis region has been experiencing severe winter seasons causing an increase in the budget for winter maintenance. The metropolitan area spent approximately $4.2 million just a month in through the winter of 2014.(17) The situation is similar in Illinois, where Illinois DOT was running approximately 70 to 80 percent ahead of a normal year during the winter season of 2014.(18) The centerpiece of RWMP efforts to reduce agency costs for weather related maintenance and operation activities pertain to Maintenance Decision Support System (MDSS) development and adoption. MDSS is intended to provide agencies with more accurate and route-specific weather forecasts and road weather condition information by providing time and location specific weather forecasts along transportation routes. This improves the timing of crew call-up and pre-treatment applications and guides decisions regarding treatments. The objective is to reduce staff and material requirements to more efficiently manage winter storm conditions and their impacts on pavement surfaces. Non-winter MDSS systems offer comparable benefits at other times of the year for activities such as pavement striping, resurfacing, and roadside maintenance. Since the publication of the 2012 report which documented the benefits of MDSS and other winter maintenance activities, limited evaluation reports have been published documenting savings. Some States have reported the findings of case studies that documented reductions in winter maintenance costs. The Michigan Department of Transportation (MDOT) provided benefit-cost calculations for two weather related deployments, Road Weather Information Systems (RWIS) and Maintenance Tracking using Global Position System (GPS). The potential benefits of these deployments are crash reduction during adverse weather and operating cost savings through more efficient use of winter maintenance resources. The results were positive, showing higher benefit-cost ratios in the Bay and the Grand regions with ratios of 7.0 and 5.1, respectively.(19) The Idaho Transportation Department (ITD) has implemented a winter performance index that uses RWIS data in conjunction with maintenance response data to monitor snow and ice performance measurement. While the results cannot be solely attributed to the use of the winter performance index, ITD reported that a significant reducing trend in costs from the base year (2010/2011).(20) The Utah Department of Transportation (UDOT) has implemented a proactive winter maintenance operations program to assist the agency with effective planning strategies that will allow area-specific weather forecasts. A case study was completed in order to quantify this value and compare it to the costs of obtaining such customized weather information. The results estimated the value and additional saving potential of the Utah DOT weather service to be 11 percent to 25 percent and 4 percent to 10 percent of the Utah DOT labor and materials cost for winter maintenance, respectively. On the basis of the program's cost, the benefit—cost ratio was calculated at over 11:1.(21) PM #6: Reduction in number and types of fatalities and crashes attributed to adverse weather nationallyOn average, there are over 5,870,000 vehicle crashes (resulting in injuries or fatalities) annually, twenty-three (23) percent of which are attributed to adverse weather and its effect on visibility and road surface conditions.(22) This measure tracks the reduction in nationwide numbers and types of fatalities attributed to adverse weather. Databases like the Fatality Analysis Report System (FARS), National Highway Traffic Safety Administration's (NHTSA) National Automotive Sampling System (NASS) General Estimates System (GES), and NHTSA's National Motor Vehicle Crash Causation Survey (NMVCCS) provide national level summaries. Table 11 summarizes the number of nationwide fatal crashes occurring during inclement weather (rain, snow/sleet, and other). Although the national level data had been showing a decreasing trend of the number of fatal crashes occurring during inclement weather, 2013 shows a slight increase.
VMT – vehicle miles traveled
Sources: Fatal Crash Data sourced from FARS "Fatal Crashes by Weather Condition: USA" (2001-2013), available at http://www-fars.nhtsa.dot.gov/Crashes/CrashesTime.aspx. Population and Vehicle Miles Traveled Information sourced from Highway Statistics Reports (2001 – 2013) Tables (DL-1C) "Licensed Drivers by Sex and Ratio Population" and (VM-202) "Annual Vehicle-Miles of Travel," available at: https://www.fhwa.dot.gov/policyinformation/statistics.cfm. Figure 6 and Figure 7 below show the national trends for crash rates during inclement weather conditions per thousand licensed drivers and per billion vehicle miles traveled. The figures illustrate how the crash rates decreased since 2001, however the last four reported years have leveled out. However, while there is a decrease in both the overall and the inclement weather crash rates, the weather crash rate is decreasing at a much slower rate than the overall crash rate with a slight increase of 0.002 per thousand licensed drivers and 0.097 per billion vehicle miles traveled (VMT) in the year 2013. 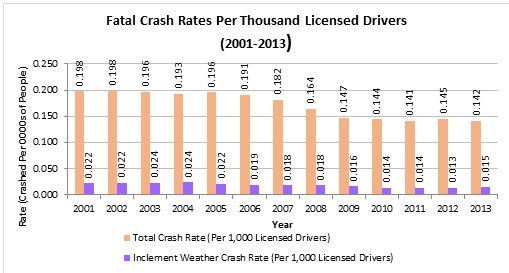 Figure 6. Graph. Fatal Crash Rates per 1,000 Licensed Drivers (2001-2013). 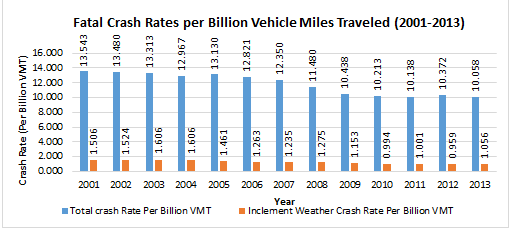 Figure 7. Graph. Fatal Crash Rates per Billion Vehicle Miles Traveled (2001-2013). Table 12 further breaks down the weather-related crashes according to conditions. The majority of most weather-related crashes happen on wet pavement and during rainfall, 74 percent on wet pavement and 46 percent during rainfall. A much smaller percentage of weather related crashes occur during winter conditions.
Source: Federal Highway Administration Road Weather Management Program website.
Adoption of decision support tools like MDSS can improve agency response and treatment of weather conditions, thereby reducing safety risks during inclement weather. Also, the RWMP's participation in the DOT Connected Vehicle program will directly address safety issues. Specifically, the best practice database maintained by the RMWP encourages the adoption of technologies to address fog, high wind, floods and adverse road conditions, treatment strategies such as pavement de-icing systems and MDSS, and other control strategies which have resulted in several successful deployments nationally. It is still hard to determine the contribution of specific strategies on national crash rates that can be attributed to the RWMP. However, individual success stories can be tabulated. The primary source of data for tracking this indicator at the strategy-level comes from the US DOT Research and Innovative Technology Administration (RITA) Intelligent Transportation Systems (ITS) Benefits Database. The data in Table 13 are a compilation of the benefits reported in various deployments around the country since 2012.
DOT – department of transportation
FAST – fixed automated spray technologies ICWS – ice curve warning system ITD – Idaho Transportation Department MVMT – million vehicle miles traveled RWIS – road weather information systems VSL – variable speed limits 1 USDOT, Office of the Assistant Secretary for Research and Technology, ITS-JPO, "Knowledge Resources - Benefits Database - Benefit ID: 2013-00891." Available at: http://www.itsbenefits.its.dot.gov/its/benecost.nsf/ID/6A6939B150A9BA5485257C4A0058CDA7. 2 USDOT, Office of the Assistant Secretary for Research and Technology, ITS-JPO, "Knowledge Resources - Benefits Database - Benefit ID: 2014-00894." Available at: http://www.itsbenefits.its.dot.gov/its/benecost.nsf/ID/AF7DACC99A687A9285257C58006EAFCC. 3 USDOT, Office of the Assistant Secretary for Research and Technology, ITS-JPO, "Knowledge Resources - Benefits Database - Benefit ID: 2011-00733." Available at: http://www.itsbenefits.its.dot.gov/its/benecost.nsf/ID/86DB0BA6A9B08E03852578C000715F5F. 4 USDOT, Office of the Assistant Secretary for Research and Technology, ITS-JPO, "Knowledge Resources - Benefits Database - Benefit ID: 2011-00733." Available at: http://www.itsbenefits.its.dot.gov/its/benecost.nsf/ID/86DB0BA6A9B08E03852578C000715F5F. 5 New Hampshire Department of Transportation, "Evaluation of an Automated Bridge Anti-icing System," Report No. FHWA-NH-RD-13733G, January 2014. Available at: http://ntl.bts.gov/lib/52000/52500/52514/FHWA-NH-RD-13733G.pdf. 6 ITD, Idaho Transportation Department Winter Performance Measures, Presentation at the Road Weather Capability Maturity Workshop Meeting by Robert Koeberlein, Operations Engineer, September 2015. PM #7: Reduction in the extent of capacity losses and delays due to fog, snow, and ice events including freightRoughly half of congestion experienced by travelers in the United States is caused by temporary disruptions or nonrecurring congestion. Inclement weather (snow, ice and fog) is one of the main causes of non-recurring congestion, attributing to 15 percent of this type of delay.(23) This is estimated to result in an annual delay of 544 million vehicle-hours of delay across the country.(24) In addition, snow accumulation, precipitation (type, rate, and start/end times), extreme wind speeds, and water levels also lead to a decrease in capacity. Weather events can reduce arterial mobility and reduce the effectiveness of traffic signal timing plans. On signalized arterial routes, speed reductions can range from 10 to 25 percent on wet pavement and from 30 to 40 percent with snowy or slushy pavement. Furthermore, average arterial traffic volumes can decrease by 15 to 30 percent depending on road weather conditions and time of day. Travel time delay on arterials can increase by 11 to 50 percent and start-up delay can increase by 5 to 50 percent depending on severity of the weather event.(25) While information for freight delays due to weather events are not readily available, one study indicates that nearly 12 percent of total estimated truck delay is due to weather in 20 cities with the greatest volume of truck traffic. The estimated cost of weather-related delay to trucking companies ranges from $2.2 billion to $3.5 billion annually.(26) Another study found that weather phenomena impact freight traffic between 3 percent and 6 percent of the time, depending on location, with a national average of 4.6 percent. The cost of weather-related delay to the freight industry was estimated at $8.659 billion or 1.6 percent of the total estimated freight market of $574 billion.(27) Directly reducing the delays experienced by travelers driving in inclement weather conditions is one of the key elements of system performance improvement targeted by RWMP. The data for this measure are a compilation of benefits reported in various evaluations in the RITA ITS Benefits Database.(28) The database reports RWMP best practices implemented by State DOTs resulting in reductions in capacity loss and delays associated with adverse weather. Limited evaluations have been found beyond those reported in 2012. Table 14 below highlights impacts of two strategies on traffic flow implemented in Utah, Idaho and Oregon.
ATM – active traffic management
ITD – Idaho Transportation Department UDOT – Utah Department of Transportation VSL – variable speed limits 1 ITD, "Idaho Transportation Department Winter Performance Measures," Presentation at the Road Weather Capability Maturity Workshop Meeting by Robert Koeberlein, Operations Engineer, September 2015. 2 USDOT, Office of the Assistant Secretary for Research and Technology, ITS-JPO, "Knowledge Resources - Benefits Database - Benefit ID: 2014-00927." Available at: http://www.itsbenefits.its.dot.gov/its/benecost.nsf/ID/1856A715BA3E6F9685257CF9006724D0. 3 USDOT, Office of the Assistant Secretary for Research and Technology, ITS-JPO, "Knowledge Resources - Benefits Database - Benefit ID: 2014-00928." Available at: http://www.itsbenefits.its.dot.gov/its/benecost.nsf/ID/5E2910DFA5CF9E7285257D02006178E4 4 Downey, M.B., Evaluating the Effects of a Congestion and Weather Responsive Advisory Variable Speed Limit System in Portland, Oregon, Portland State University, September 2015. PM #8: Increase in travel time reliability or decrease in variability due to road weather management strategies during adverse weather scenariosReliability is a measure of how travel time varies over time. Higher variations of travel time imply a lower level of reliability. Travel time reliability is often more important to travelers than average travel times. However, while the concept of reliability is intuitively understood by both travelers and policy-makers, the appropriate measures to calculate and communicate reliability continue to be a challenge. The degradation of reliability can be associated with the seven causes of non-recurring congestion including: incidents, weather, work zones, fluctuation in demand, special events, traffic control devices and inadequate base capacity. While each of these can occur independently and cause variations in normal travel times, they are not mutually exclusive. The causes of non-recurring congestion can have compounding effects. For example, weather affects capacity and demand, as well as the probability of incidents. The impact on reliability is also dependent on a combination of factors or scenarios. For instance, an ongoing weather event which occurs at rush hour (high-demand) is different from a weather event which occurs during low-demand conditions. While the total variability is important for many agencies, understanding the contribution of individual cause is crucial in developing mitigation approaches. Isolating the impacts of weather on travel time reliability is important for RWMP performance evaluation. However, there are not many examples where the role of weather and travel time reliability has been explored. In a paper submitted to TRB, researchers tried to quantify the impact of adverse weather on travel time variability on freeway corridors reporting that on average, adverse weather results in twice the travel time variability compared with that under normal weather conditions.(29) It is also found that rain has little or no effect on travel time variability below a certain critical inflow, but progressively impacts travel time variability above it. The Strategic Highway Research Program 2 (SHRP2) performance measure L02, Establishing Monitoring Programs for Travel Time Reliability, describes approaches to identify the sources of unreliability as part of the travel time monitoring systems including a tagging approach to link observed travel times with non-recurrent event data (such as weather data from environmental sensor stations (ESS) or Automated Surface Observing Systems [ASOS]/Automated Weather Observing System [AWOS] stations) allowing for travel time distributions to be disaggregated across various combinations of congestion and recurrent condition. Very few agencies track reliability measures, and even the ones that do, do not distinguish between the various causes of reliability. FHWA tracks reliability through the travel time index and the planning time index as part of the urban congestion reports at national or city levels.(30) However, the information available is not at a level that can be used for assessing the performance of the RWMP products, activities and services. One study in Oregon (Evaluation of the OR-217 ATM) discussed the impact of adverse weather on travel time noting that pre-variable speed limits (VSL), peak hour travel times during wet conditions were between 19 to 78%. After the VSL became active, the variation almost disappeared indicating that drivers were behaving more homogenously during adverse weather.(31) PM #9: Reduction in the number of tons of salt or chemical usage in the United states normalized by Winter Severity IndexThis measure focuses on the tons of sodium chloride (aka "salt") used for winter maintenance activities as it relates to the environmental impacts and sustainability of maintenance operations. Salt is considered to be the most commonly used and economical deicer. According to the United States Geological Survey USGS, salt used for highway deicing has been linked to corrosion of bridge decks, motor vehicles, reinforcement bar and wire, and unprotected steel structures used in road construction. In addition, surface runoff, vehicle spraying, and windblown actions have been found to affect soil, roadside vegetation, and local surface water and groundwater supplies. The USGS Minerals Yearbook reports that United States (U.S.) consumption of salt for ice control and road stabilization in 2013 was 20.4 million tons, which was 84 percent more than in 2012.(32) Table 15 provides annual salt usage during inclement weather for ice control and road stabilization from 2006 through 2013.
Source: United States Geological Survey Minerals Yearbook: Salt (2006-2013)
The quantity of salt used for road deicing each year is directly related to the severity of winter weather conditions. Accurate forecasting of salt consumption is extremely difficult because of the complexities in long‑range weather forecasting. One strategy for monitoring salt consumption used by Iowa DOT is a management dashboard featuring actual salt usage during maintenance operations compared to estimated usage amounts, based on road weather conditions. Managers monitor this dashboard to make sure current usage is reasonable given the weather and is within Iowa DOT's standard application rate guidelines. Variability in winter weather severity and levels of service – from year to year and from place to place – makes performance measurement difficult. The use of a Winter Severity Index (WSI) has gained recognition as a way to gauge the relative severity of winter weather across various time frames or geographic regions. Massachusetts DOT utilizes a WSI to compare annual road salt usage to the severity of the winter conditions that occur each season. Factors that are included with their WSI include: daily minimum and maximum temperatures, daily snowfall and the number of snowfall events each month. WSI and salt usage are positively correlated. In two recent years, the agency has seen more efficient use of salt (i.e., actual salt consumption was less than the amount estimated from the WSI-salt usage relationship).(33, 34) As information from Massachusetts DOT shows, the correlation between salt usage and WSI can determine the efficiency of snow and ice operations in terms of material usage and cost in comparison to winter severity. However, WSI factors vary from State to State as shown in Table 16. This variation makes it very difficult to evaluate salt usage since a direct comparison cannot be made.
FI – frost index
NCHRP – National Cooperative Highway Research Program WSI – winter severity index 1 Transportation Research Board of the National Academies, Transportation Research Circular (Number E-C063): Sixth International Symposium on Snow Removal and Ice Control Technology, June 2004. Available at: http://onlinepubs.trb.org/onlinepubs/circulars/ec063.pdf. 2 Wisconsin DOT, 2012-2013 Annual Report. 3Transportation Research Board of the National Academies, Transportation Research Circular (Number E-C063): Sixth International Symposium on Snow Removal and Ice Control Technology, June 2004. Available at: http://onlinepubs.trb.org/onlinepubs/circulars/ec063.pdf. 4 Minnesota DOT, 2010–2011 Annual Winter Maintenance Report at a Glance. Available at: http://www.dot.state.mn.us/maintenance/pdf/research/winterataglance.pdf. 5 Massachusetts DOT, "MassDOT Snow & Ice Control Program – 2012 Environmental Status and Planning Report EOEA#11202 – Public Review Draft," February 2012. Available at: http://www.massdot.state.ma.us/Portals/8/docs/environmental/EnvironStatus_PlanningRpt_0212.pdf. 6 New Hampshire DOT, "Effective Resource Management – 2012." Available at: http://www.nh.gov/dot/org/commissioner/balanced-scorecard/department/documents/2012_bs_performance_salt_usage.pdf. 7 Maine DOT Transportation Research Division, A Winter Severity Index for the State of Maine, Technical Report 09-1, January 2009. Available at: http://ntl.bts.gov/lib/54000/54500/54542/report0901f.pdf. Reducing salt used and switching to other alternative deicers or anti-icing methods is an important strategy of many agencies, not only for saving maintenance cost but also reducing negative environmental effects, because salt is highly soluble and elevates the levels of sodium and chloride in soil and water. Through the implementation of road weather management tools like MDSS and treatment technologies (i.e., deicing and anti-icing methods), agencies can optimize their usage of materials, thereby providing safe mobility while reducing the amount of salt on the highways. However, no new studies were found in the 2012-2015 relating to documented benefits in salt usage. SummaryOverall, the importance of performance measurement and return on investment continues to grow. However, there are limited examples of evaluation studies since the 2012 update. In itself, it is not surprising since evaluation studies require several winters' worth of data to be meaningful. However, the paucity of evaluation studies leads to reduced acceptance and adoption of some of the road weather management strategies. At a programmatic level, the lack of consistently defined measures continues to be a challenge. Note: You will need the Adobe Reader to view the PDFs on this page. 11 Data Source: Highway Statistics (2001 – 2012), Data Tables SF-4C (Disbursements for State-Administered Highways) and LGF-2 (Local Government Disbursements for Highways). Available at: https://www.fhwa.dot.gov/policyinformation/statistics.cfm. [ Return to note 11. ] 12 Federal Highway Administration, Road Weather Management Performance Measures – 2012 Update. FHWA-JPO-13-87, 2013. Available at http://ntl.bts.gov/lib/51000/51000/51065/26615E33.pdf. [ Return to note 12. ] 13 At the time of this report, 2012 data was the latest available data published in the Highway Statistics publication series. [ Return to note 13. ] 14 Michel, Erica. "Budget–Breaking Snow Year." The National Congress of State Legislation Blog, February 28, 2014. Accessed October 1, 2015. Available at: http://www.ncsl.org/blog/2014/02/28/budget-breaking-snow-year.aspx. [ Return to note 14. ] 15 Marklein, Mary. "Relentless Winter Saps Snow-removal Budgets." USA Today, February 6, 2014. Accessed July 1, 2015. Available at: http://www.usatoday.com/story/news/nation/2014/02/06/snow-removal-budgets-tapping-out/5225805/. [ Return to note 15. ] 16 Levenson, Eric. "Why Boston's Snow Removal Budget So Often Comes Up Short." Boston.com, November 13, 2014. Accessed June 24, 2015. Available at: http://www.boston.com/news/local/massachusetts/2014/11/13/why-boston-snow-removal-budget-often-comes-short/wSsqr91N08AugheqUxz7VM/story.html?p1=related_article_page. [ Return to note 16. ] 17 "Missouri and Illinois Snow Removal Budgets Dwindling." CBS St. Louis, January 24, 2014. Accessed June 13, 2015. Available at: http://stlouis.cbslocal.com/2014/01/24/missouri-and-illinois-snow-removal-budgets-dwindling/. [ Return to note 17. ] 18 "Missouri and Illinois Snow Removal Budgets Dwindling." CBS St. Louis, January 24, 2014. Accessed June 13, 2015. Available at: http://stlouis.cbslocal.com/2014/01/24/missouri-and-illinois-snow-removal-budgets-dwindling/. [ Return to note 18. ] 19 USDOT, Office of the Assistant Secretary for Research and Technology, ITS-JPO, "Knowledge Resources - Benefits Database: Rural Road Weather Information System deployments show estimated benefit-cost ratios of 2.8 to 7.0." Available at: http://www.itsbenefits.its.dot.gov/its/benecost.nsf/ID/E516FB20F38316728525788B0069DB05. [ Return to note 19. ] 20 ITD, "Idaho Transportation Department Winter Performance Measures," Presentation at the Road Weather Capability Maturity Workshop Meeting by Robert Koeberlein, Operations Engineer, September 2015. [ Return to note 20. ] 21 Strong, Christopher, and Xianmind Shi. "Benefit-Cost Analysis of Weather Information for Winter Maintenance: A Case Study." Transportation Research Record: Journal of the Transportation Research Board: Volume 2055. Accessed June 20, 2015. Available at: http://trrjournalonline.trb.org/doi/pdf/10.3141/2055-14. [ Return to note 21. ] 22 U.S. DOT FHWA Office of Operations Road Weather Management Program, "How do Weather Events Impact Roads?" Accessed October 1, 2015. Available at: http://www.ops.fhwa.dot.gov/weather/q1_roadimpact.htm. [ Return to note 22. ] 23 USDOT FHWA Office of Operations Road Weather Management Program, "Operations Story." Accessed October 1, 2015. Available at: http://ops.fhwa.dot.gov/aboutus/opstory.htm. [ Return to note 23. ] 24 USDOT FHWA Office of Operations Road Weather Management Program, "How do Weather Events Impact Roads?" Accessed October 1, 2015. Available at: http://ops.fhwa.dot.gov/weather/q1_roadimpact.htm. [ Return to note 24. ] 25 USDOT FHWA Office of Operations Road Weather Management Program, "How do Weather Events Impact Roads?" Accessed October 1, 2015. Available at: http://ops.fhwa.dot.gov/weather/q1_roadimpact.htm. [ Return to note 25. ] 26 USDOT FHWA Office of Operations Road Weather Management Program, "How do Weather Events Impact Roads?" Accessed October 1, 2015. Available at: http://ops.fhwa.dot.gov/weather/q1_roadimpact.htm. [ Return to note 26. ] 27 USDOT ITS Joint Program Office – HOIT, "Weather Delay Costs to Trucking," Report No. FHWA-JPO-13-023, November 2012. Available at: http://www.its.dot.gov/road_weather/pdf/weather_delays_trucking.pdf. [ Return to note 27. ] 28 USDOT, Office of the Assistant Secretary for Research and Technology, ITS-JPO, "Knowledge Resources - Benefits Database." Available at: http://www.itsbenefits.its.dot.gov/. [ Return to note 28. ] 29 Tu et al, "The Impact of Adverse Weather on Travel Time Variability of Freeway Corridors." Paper presented at 86th meeting of the Transportation Research Board, 21-25, January 2007. [ Return to note 29. ] 30 USDOT FHWA Office of Operations, Operations Performance Measurement Program, "Urban Congestion Reports." Available at: http://ops.fhwa.dot.gov/perf_measurement/ucr/. [ Return to note 30. ] 31 Downey, M.B., Evaluating the Effects of a Congestion and Weather Responsive Advisory Variable Speed Limit System in Portland, Oregon, Portland State University, September 2015. [ Return to note 31. ] 32 Bolen, William. 2013 Minerals Yearbook. Available at: http://minerals.usgs.gov/minerals/pubs/commodity/salt/myb1-2013-salt.pdf. [ Return to note 32. ] 33 Massachusetts DOT, "MassDOT Snow & Ice Control Program – 2012 Environmental Status and Planning Report EOEA#11202 – Public Review Draft," February 2012. Available at: http://www.massdot.state.ma.us/Portals/8/docs/environmental/EnvironStatus_PlanningRpt_0212.pdf. [ Return to note 33. ] 34 Massachusetts DOT, "The GreenDOT Report - 2014 Status Update," December 2014. Available at: http://www.massdot.state.ma.us/Portals/0/docs/GreenDOT/GreenDOT_Report2014/statusReport_GreenDOT2014.pdf [ Return to note 34. ] | ||||||||||||||||||||||||||||||||||||||||||||||||||||||||||||||||||||||||||||||||||||||||||||||||||||||||||||||||||||||||||||||||||||||||||||||||||||||||||||||||||||||||||||||||||||||||||||||||||||||||||||||||||||||||||||||||||||||||||||||||||||||||||||||||||||||||||||||||||||||||||
|
United States Department of Transportation - Federal Highway Administration |
||