Traffic Signal Management PlansAppendix. Performance Measurement Case StudiesLinking Traffic Signal Performance Measures to Agency Objectives – Cast Study of Mesa, Arizona (Population: 500,000)Agency representative: Avery Rhodes Operational ObjectiveThe City of Mesa has used travel time data, since 2006, as a measure of traffic signal system performance. The travel time metric is used to monitor the operational objective of stable travel times along certain corridors. The objective is to ensure that along each corridor, the growth rate of traffic volume always exceeds the growth rate of travel times. If travel time growth rate along a corridor increases by an amount greater than traffic volume growth rate, this would trigger a review of the need to update signal timings. Floating Car Travel Time MeasurementThe original method of collecting corridor travel times was by floating car surveys, between defined origin-destination (O-D) pairs. Floating car surveys were typically conducted during the first two weeks of April, or during the first week of October. These time frames were considered to represent "average" traffic conditions for Mesa. The floating car surveys were performed along four major arterials, during the p.m. peak (3:30 p.m. – 5:30 p.m.). Data were collected using hand held electronic data collection boards by staff members traveling at a speed they believed to be representative of typical traffic at the time. Since the travel time data are limited (i.e., only for two weeks of the year, only during the p.m. peak, and only a limited number of runs per peak period), the City could only use the metric to monitor high level trends. Migration to BluetoothTM Travel Time MeasurementStarting in 2012, the City tested a new method of collecting travel time data; MAC address matching (Bluetooth). The average travel times measured using this method were found to be very similar to those obtained by floating car surveys for the PM peak period, which provided confidence that it could replace the floating car method. However, significant additional benefits were also realized. The automated method reduces the amount of direct manual labor needed. It increases the sample size and reliability of measurements. It allows assessment of travel times over the whole day, weekends, and throughout the various seasons. It also has the ability to identify traffic issues in real time. Such traffic issues include:
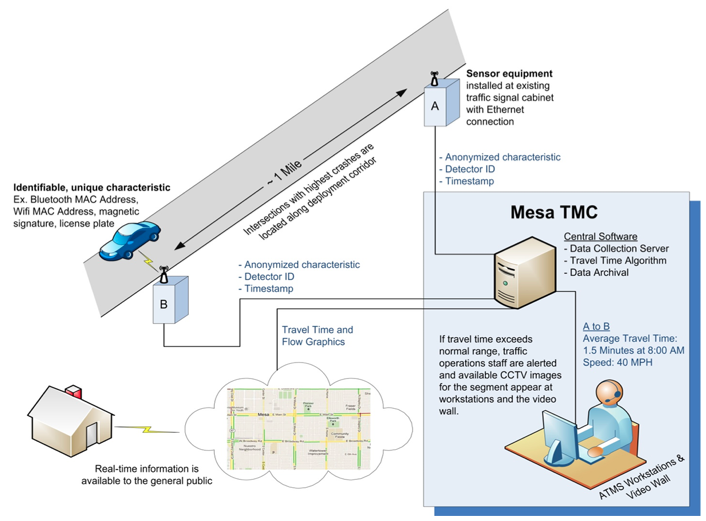
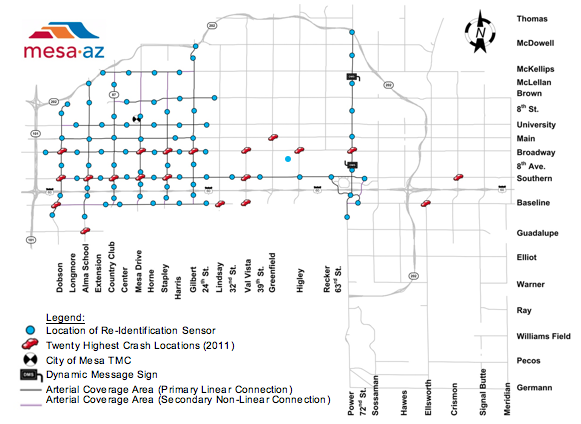
The Bluetooth technology has improved the city's data collection and analysis. The automated system (illustrated above) is constantly operating, so the City is able to collect data on more corridors, 24 hours a day, instead of just during the p.m. peak periods. Raw data are uploaded on an as-needed basis for reporting and archiving, but the Bluetooth map refreshes every 30 seconds. Recurrent congestion is expected in certain locations every day, but unexpected congestion is detected when analysts spot abnormal congestion patterns in certain locations. The City currently does not have the resources to constantly monitor these outputs, to discern when crashes or other events are affecting traffic operations. A color-coded problem detection system is expected to pay dividends in the future, in terms of cost-effectiveness and accuracy, but it is not yet fully automated. Twenty major arterial streets are now covered by the Bluetooth-based travel time study system, while a smaller number of corridors are still monitored via floating car surveys. The city currently maintains 82 sensors at one-mile spacings, with an estimated 40 percent of the city being covered (illustrated below). Bluetooth data are collected by matching MAC addresses detected by one sensor (A) with a second sensor (B), and computing travel times between the points. Travel times for the one-mile increments are added together to calculate total travel times along predetermined routes.
Experimentation with WiFi Travel Time MeasurementThe city is concerned about possible deterioration of Bluetooth reliability over time. "Undiscoverable" mode is the new default on many electronic devices, possibly for privacy reasons; whereas in the past, devices used to be shipped with “discoverable” mode enabled by default. The low number of Bluetooth matches (3-6 percent of total volume) is concerning. This low number may continue to decline as undiscoverable devices continue to be purchased, and as older (discoverable) devices are discarded. Because of this, the city is experimenting with WiFi readers as an alternative to Bluetooth readers. WiFi is another technology that matches unique electronic signatures of electronic devices. It is too early to tell if the WiFi data provides the same reliability and accuracy that the Bluetooth readers have. However, it is noted that while Bluetooth handshaking occurs continually, the WiFi seek typically occurs approximately every 30 seconds. Therefore it is possible that the sample of vehicles detected using WiFi may be biased towards vehicles that stop adjacent to each monitoring site, compared to those detected using Bluetooth. Lessons LearnedOver time, the city aims to gradually automate their travel time data collection system to the maximum extent possible. However for now, the ARID-Bluetooth system requires a human to observe variations from "normal" traffic conditions. Purdue's automated signal performance measure (SPM) concepts may provide a pathway to enabling automation, and providing residents with faster problem response times. The city is moving in the direction of identifying problems before they get reported as complaints. They are cooperating with other agencies within the region. The city is providing data feeds from 10 intersections to the regional Utah Department of Transportation (UDOT) automated SPM software that has been installed on pilot basis. This is marking a move by the region to invest in automated SPMs. The UDOT system is illustrated on: www.udottraffic.utah.gov/signalperformancemetrics However this automation requires extra detection, compared to the detection provided at most intersections in Mesa. Part of the City's evaluation of this system will be to weigh the benefits against the costs of this additional detection. Linking Traffic Signal Performance Measures to Agency Objectives – Case Study of Walnut Creek, California (Population: 70,000) – Case Study Date: 08/27/2015Operational ObjectivesYgnacio Valley Road is defined by the San Francisco Metropolitan Transportation Commission (MTC) as an arterial-level "route of regional significance" traversing Walnut Creek, providing the primary access to downtown and various neighborhoods, and connecting I-680 to several cities to the east of Walnut Creek. It is a major commuter route that carries in excess of 100,000 vehicles per day, and experiences significant variation in traffic demand, as a result of incidents on freeways for which it provides an alternative route, and concerts and other events at an outdoor concert pavilion and at a performing arts center. The primary operational objective for this corridor is to provide predictable and stable travel times that are consistent with the level of demand for the various periods of the day and days of the week.
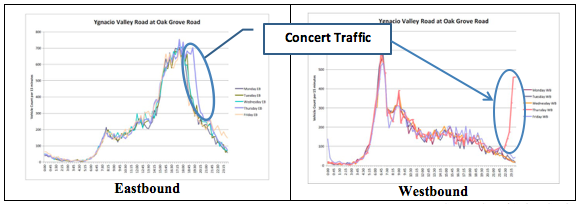
BackgroundSince the 1980’s, the City of Walnut Creek has devoted significant resources to traffic signal system maintenance and coordinated signal timing. During the past 35 years, the majority of signals within the city have been coordinated using a central signal system, which has been upgraded and replaced several times. While the city has devoted considerable local resources to equipment purchases, operation and maintenance, their ability to perform this high level of operations and maintenance has been aided greatly by a series of grant funding opportunities. Each time the city has received a grant to update its coordinated signal timing, it has been required to submit final reports containing before-and-after studies, to validate the retiming effectiveness. The studies were typically accomplished by using floating cars to measure travel time, stopped delay, and numbers of stops, which were used to calculate a benefit/cost (B/C) ratio. As a result, the corridor has been retimed approximately every three to five years since the mid-1980's, so there is a long-term record of travel time performance along the corridor. In addition, staff have continually maintained and fine-tuned the signal timing during the intervening years, the formal travel time surveys have been periodically supplemented by less formal travel time surveys conducted by staff at various times of the day, to highlight any deterioration in travel times that may need attention between the major retiming projects. The city is also collecting extensive traffic volume data through its central signal system, and these data are sometimes cross-correlated with the travel times. In some cases where travel time anomalies have been identified, the city has been able to use traffic volume anomalies to partially or fully explain the deviations. These volume and travel time cross-correlations are not fully automated, and the city does not maintain a formal policy for how often these cross-correlations are analyzed. Review of the volume data in 2010 showed the variability in traffic demand along the corridor, as illustrated in Figure 13.
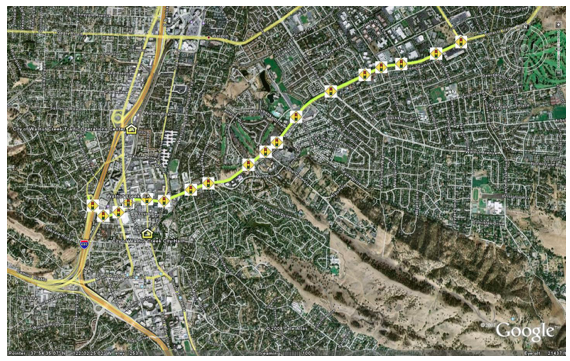
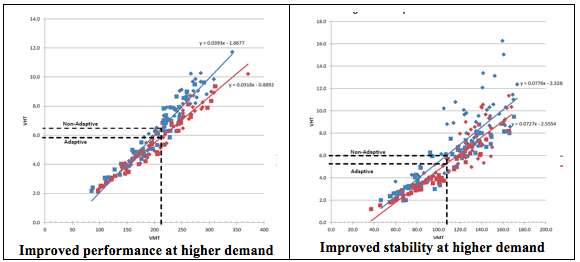
Installation of ATMS.NOW and BluetoothTM Travel Time ReadersIn 2010, the city upgraded its Naztec Streetwise signal system to the more modern ATMS.now, in order to add adaptive signal control technology (ASCT). The ASCT capability was desired for addressing and mitigating some unstable operation on the corridor. To validate its effectiveness in meeting the operational objective, the city needed to measure travel times along the corridor. However, to assess the ASCT benefits, which can be significant at unpredictable times of the day, they knew floating car surveys conducted using traditional methods, during the traditional periods of AM peak, mid-day and PM peak, would be inadequate. To expand floating car surveys to cover all periods during which adaptive operation may perform differently from traditional time of day (TOD) operation was cost prohibitive, and could not reliably capture times when traffic demand varied because of incidents on the alternative freeway routes. This motivated them to deploy Bluetooth readers, which continuously collect data at all times. These were installed (initially as a temporary deployment) along Ygnacio Valley Road as the adaptive system was being fine-tuned and evaluated, during 2012. Ygnacio Valley Road is divided into three relatively homogeneous sections by two significant crossing arterials, with a freeway at the western end and another crossing arterial at the eastern end. The complete corridor remains coordinated at all times except during the overnight hours, when coordination is temporarily lifted due to low volumes. To conduct the before-and-after studies, a Latin-Squares survey design ensured that both adaptive and non-adaptive operation were applied to the full corridor at comparable times on comparable days, to remove the uncertainty associated with daily and seasonal variations in traffic patterns and demands. By installing one reader at each of the four major boundary intersections, it became possible to reliably measure travel times for each section on a 24/7/365 basis. Initial Use of Bluetooth DataThe Bluetooth data was initially used for the Before/After evaluation of the ASCT. Because it was expected that the ASCT would automatically vary its operation based on the measured traffic volumes, the most appropriate method for comparing the two operating modes was to relate the measured travel times to the measured demand present at the same time. The Bluetooth travel time data was combined with the traffic volume data from the traffic signal system to calculate vehicle hours of travel (VHT) and vehicle miles of travel (VMT) for each 15 minute period of the two-week evaluation period, for each of the three sections of the corridor. By plotting these data and running regression analyses, various comparisons could be made to examine:
The data, a sample of which is shown in Figure 14, illustrated the variability in travel time with demand, and in some cases the instability of travel times as demand varies. This was useful for the city staff to determine the suitability of ASCT for their situation, and evaluate it against their objective of providing stable travel times consistent with the traffic demand.
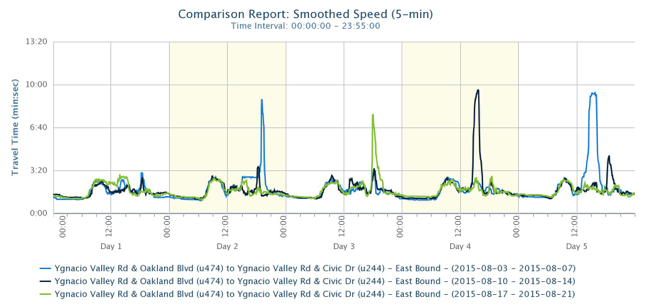
Longer Term Use of BlueToad DataOver the longer term, in the three years since the readers were installed, staff have used the Bluetooth data to continually monitor the travel times in both directions on the corridor, and to provide guidance on when there was a need to review signal timing to accommodate issues. It has also provided a very useful resource for verifying the validity of citizen complaints about signal operation. The example BlueToad report shown in Figure 15, covering weekdays of three consecutive weeks in August, 2015, shows relative stability of travel time but with occasional significant outliers occurring once during the three week period on each weekday except Monday. This is an example of a report that can provide staff with the opportunity to periodically examine the operation, at very little cost, and have accurate data that would formerly have been unavailable.
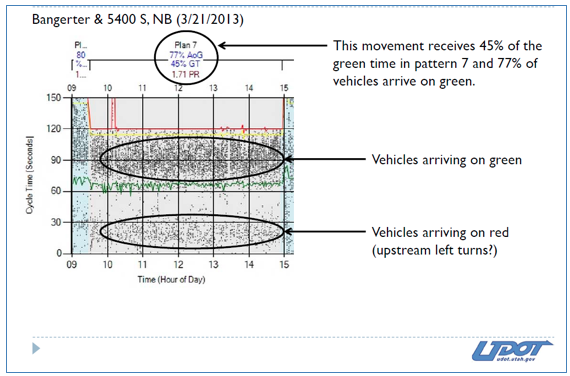
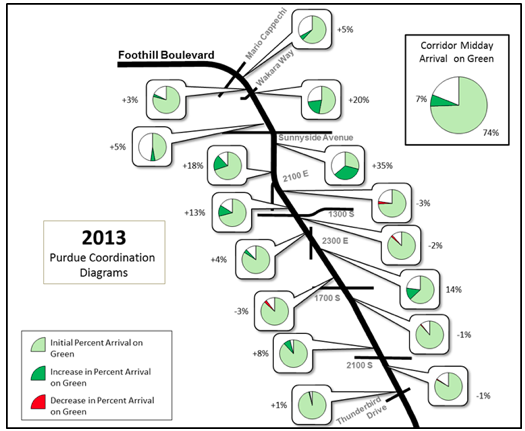
Lessons LearnedOverall, the city was quite satisfied with performance of the Bluetooth system, in achieving their initial objective of assessing the ASCT performance. This success inspired them to continue using the system, and a permanent installation replaced the temporary deployment. It now provides a continuous and lasting assessment of signal timing plan effectiveness and stability over time, allowing continuous measurement of the system’s performance against the objective of predictable and stable travel times on this important corridor. As a result of this successful experience, the system is in the process of being expanded to include the other important coordinated routes within the city. Linking Traffic Signal Performance Measures to Agency Objectives – Case Study (Signal Regression) of Utah Department of Transportation – Operational ObjectiveThe Utah Department of Transportation (UDOT) has identified the operational objective of providing smooth flow along suitable corridors (such as linear arterials that connect regional activity centers and freeways), particularly in under-saturated conditions. Percent Arrivals on Green (AoG) is a measure of how effectively bandwidth promotes progression with coordinated traffic signal parameters designed to promote automobile flow without stops along arterials. This high-resolution signal performance measure can assess progression through both adaptive and non-adaptive signal corridors. BackgroundCoordinated signal timing plans are typically prepared on the basis of computer analysis, using tools such as Synchro™. The traditional approach involves extensive data collection of volumes and travel times; development of a calibrated model of the existing coordination (if applicable); optimization of the timings based on the in-built objective function (minimizing a function that is usually some combination of stops and delays); manual adjustment of the suggested timing using time-space diagrams to provide bandwidth and progression that is considered by the analyst to provide more acceptable operation; and fine tuning of those timings in the field based on roadside and windscreen observations. UDOT's experience has been that while the cycle length and phase splits recommended by the software are often close to the final adopted settings, much fine tuning is required of the offsets to successfully accommodate the variations in average travel speeds often encountered from block to block, which in turn often vary with time of day, depending on traffic density and the prevalence of disturbances to flow caused by turning vehicles using mid-block driveways, percentage of larger vehicles in the traffic stream and differences in driver populations. Because the fine tuning is based simply on observation, there is no single metric that can be used to confirm that the optimum offsets have been selected. Attempts to simulate the effect of the fine tuning within the computer model can only be indicative, and not accurately reflect the actual vehicle operation, because of the many underlying assumptions built into the model coding. Assessment of the quality of coordination has historically been mainly undertaken using limited floating car surveys. These are often in the form of "before and after" studies related to signal retiming projects and, of necessity because of the expense, are generally limited to short periods of the day (AM, PM and Mid-Day peak periods) on days of the week and months when traffic is considered "typical." Even when these are supplemented by informal travel time surveys by operators, they have very limited sample size and do not provide a rigorous assessment of the signal timing performance. As identified in the 2012 National Traffic Signal Report Card, many agencies recognize that traffic patterns and volumes change over time, and there is a need to review and recalibrate signal timing regularly to accommodate these changes. Because historically there has been no on-line measure of performance available, FHWA recommends that agencies should review their signal timing once every three to five years. However, this means that a significant investment is already sunk by the time an up to date model of the existing traffic volumes and signal operation is completed, and an assessment can be made of whether new timings are likely to better than the existing timings. Migration to Systematic Performance MonitoringThe Purdue Coordination Diagram (PCD) provides a graphical method to illustrate the stage of a cycle at which vehicles arrive at an intersection. For a specific approach of an intersection, the arrivals can be plotted in a time scale, as illustrated in Figure 16, in which each dot represents the arrival of a single vehicle. By calculating statistics (such as the AoG) for the coordinated approaches of all intersections within a corridor, during a specific period, it is now possible to derive a single metric (Corridor AoG) that indicates the quality of the coordination, based on the objective of providing smooth flow along a corridor. An example of this is illustrated in Figure 17.
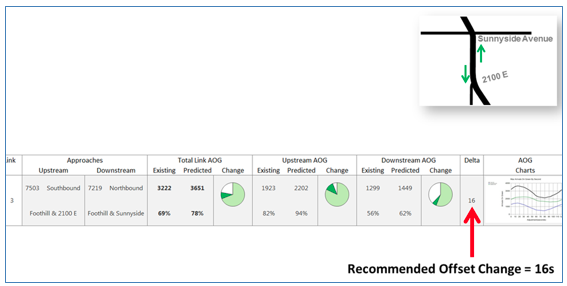
UDOT's system of performance monitoring for coordinated corridors now follows a two-phase process. In the first phase, AoG values are observed at each intersection and used during the fine tuning process. When unacceptable locations are identified, signal timings are fine-tuned until all AoGs fall within an acceptable range, and/or the platoons are stopped at acceptable locations. An assessment of the likely effect on one pair of intersections of changing the offset can be provided by the software, as illustrated in Figure 18. Once this process has been completed for all links, this establishes an appropriate baseline against which to monitor ongoing performance, as illustrated in Figure 18.
In the second phase UDOT continuously monitors ongoing performance, comparing the corridor AoG metric to the baseline established during the first phase. A semi-automated system is in place to monitor for significant AoG deviations. This allows for an intelligent assessment of the need for signal retiming, based on the deviation of the metric from the baseline. In this way, retiming can be triggered in a shorter period of time if the deviation exceeds a threshold set by UDOT for the corridor, while unnecessary retiming is avoided if the deviation is still small after the normal retiming interval has elapsed. Experimenting with Pro-Active Offset OptimizationIn addition to the improved decision-making made possible by systematic monitoring of AoG, UDOT has observed significant benefits from semi-automated optimization of AoG. The Purdue Link Pivot (PLP) algorithm uses an iterative approach to identify the impact of potential offset changes for both approaches in a link, to optimize AoG. Data required for applying this algorithm are collected automatically through an intersection’s advance detectors, and through phase data obtained directly from the controllers. The PLP is a compelling concept because resource-intensive modeling and calibration are not required. Moreover the PLP easily accommodates elements that are difficult to model, such as link travel times and early returns to main street green. The PLP even automatically considers progression for heavy left turns. However the PLP cannot directly address queues that extend beyond detectors, and large offset changes may require multiple iterations. So rather than following the traditionally labor-intensive process of model optimization, modification and fine tuning, staff can select the cycle length and splits and install them with an initial set of offsets, then use the PLP to approach the optimum. Lessons LearnedPurdue University’s automated signal performance measurement concepts, which include AoG values derived from the PCD, have allowed UDOT to establish an efficient process for continual assessment of the performance of coordination on a corridor against the objective of providing smooth flow. Additional benefits have accrued because resources are shifting from off-line analysis to on-line fine tuning and optimization, and resources for retiming are now better directed towards corridors that need retiming, rather than those next on the schedule. The monitoring technology set up by UDOT represents a paradigm shift of traffic signal system architecture. In this architecture, controllers are connected to a central traffic signal management system in the traditional fashion, for all management and control functions provided by the vendor. However, a separate communication channel is provided between the controllers and the performance monitoring server. FTP sessions are opened with local controllers to automatically create reports, without interfering with the traffic control functions. In response to these achievements, it is expected that more agencies will incorporate system requirements related to High Resolution Data performance reporting into traffic signal system specifications. In response to these requirements it is likely that vendors will modify their systems to accommodate and/or incorporate high-resolution data logging. The UDOT system is illustrated on: www.udottraffic.utah.gov/signalperformancemetrics. Linking Traffic Signal Performance Measures to Agency Objectives - Case Study (Detection Health) of Utah Department of Transportation - Operational ObjectiveThe Utah Department of Transportation (UDOT) has established a maintenance objective of keeping traffic signals in a good state of repair and operating in a manner for which they were designed. A maintenance strategy of proactively maintaining the reliability of field infrastructure calls for an activity that regularly monitors the health of intersection detection. While regular preventative maintenance activities might involve annual testing of all intersection detection systems, UDOT has taken this tactic to the next level by adopting a system of analyzing high-resolution signal controller data, to quickly identify detector faults. This allows them to monitor performance against the objective to "keep traffic signals in a good state of repair and operating in the manner for which they were designed"; and also implements the strategy to "identify detector faults in a timely manner." The primary metric for this is the proportion of cycles in a user specified period that are extended to their maximum green time or "max-outs." When signal phases are observed as maxing-out frequently during time periods when traffic demand is expected to be light, this implies a detector malfunction. Detector failures of inductive loops trigger a constant on condition, causing traffic signal phases they are associated with to "max-out." A high proportion of max-outs would typically only occur in a fully functional signal when there is a high number of queued vehicles in each cycle, resulting in consistent phase failures and carryover queues. While maxing out can also be caused by platoons of vehicles arriving towards the end of green, this would not consistently happen from cycle to cycle unless the upstream signal is coordinated with the phase that experiences this arrival pattern. This high-resolution signal performance measure can be used to assess detector health at both coordinated and non-coordinated signal locations. BackgroundPrior to use of the high resolution data, maintenance staff relied on alarms and fault reports generated by the central traffic signal system to identify potential detector faults, or faults were identified when responding to citizen complaints about inappropriate signal timing. Most traffic signal systems flag a detector that has registered continuous presence longer than some pre-set duration (locked on), registers continuous short detections that are too short to be vehicles (oscillating), or does not register presence for a pre-set period of time (not detecting). When a complaint is received about poor or faulty signal timing, the typical sequence of events involved:
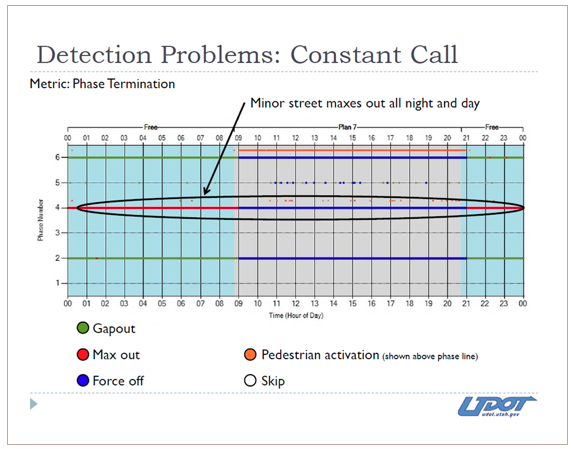
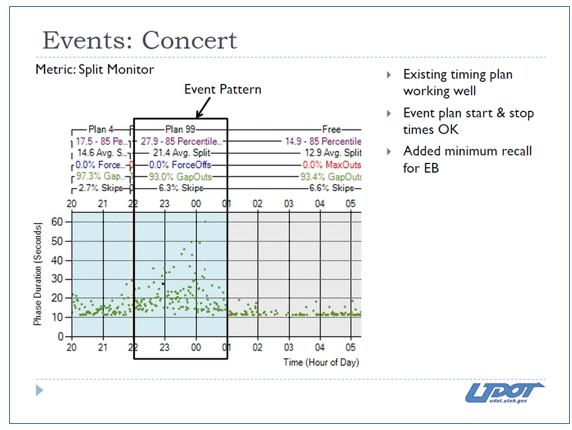
However, there were situations in which the technician was unable to identify a fault. In some cases involving video detection, the fault condition only occurred during darkness and the technician typically visited the site during daylight. In the case of loop detectors it may be possible that after a fault occurs the detector unit retunes itself and the fault is cleared. There was clearly benefit to be gained in terms of improved traffic operations and public relations if the detector faults could be identified shortly after they occurred, and before they have sufficient impact on traffic operations that members of the public complain. There was also direct financial benefit to be gained by UDOT if the labor involved in identifying and troubleshooting detector faults could be reduced. Systematic Performance MonitoringThe UDOT system of detection monitoring produces reports that highlight detection anomalies. This system allows staff to proactively identify and fix detection problems, and reduces the labor involved in identifying faulty detection as the source of a timing problem. There are two types of reports generated by the UDOT system that are useful in this context: Phase Termination Monitor and Split Monitor. The Phase Termination Monitor identifies, for a specific intersection, the reason for termination of each phase in each cycle. An example is illustrated in Figure 19. This particular report illustrates that for an entire 24 hour period, phase 4 has run to maximum during free operation, and has been forced off by the coordinated timing pattern during coordination. This indicates a high probability that a detector is locked on. The second relevant report is the Split Monitor report, illustrated in Figure 20. This report shows the actual phase length and reason for phase termination for a specific phase at an intersection, and is useful in confirming whether or not the detection is causing phases to be called and extended as expected for the prevailing traffic conditions.
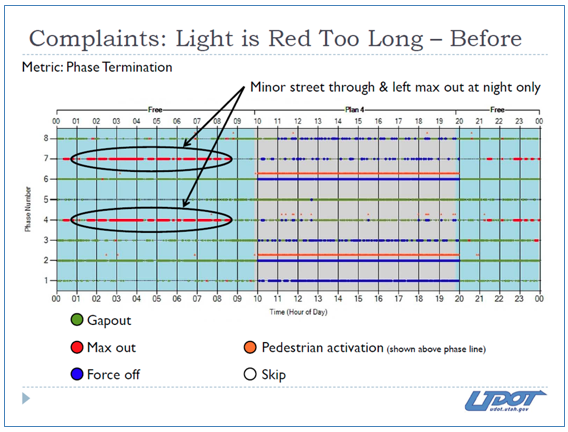
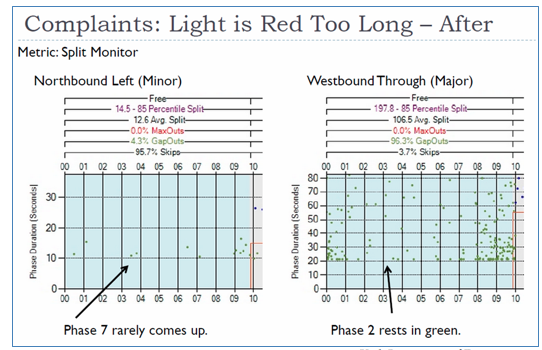
Practical ApplicationThere are two primary ways in which the reports are used to identify potential detection faults. Each day, the reports are reviewed by staff and any locations showing an unexpectedly high incidence of "max-out" are flagged for further review and analysis. Secondly, if a timing complaint is received, a report is generated from historical data to examine the patterns of phase time and phase termination. The following figures illustrate the automated signal detection reports used by UDOT. In Figure 21, a high percentage of max-outs can be seen on two minor-street phases, during late night hours when max-outs should rarely occur. This wastes valuable time by reducing right-of-way time for the opposing movements, in particular increasing stops on the major street. It is also noticeable that those same phases often gap out during the daylight and early evening hours. This approach used a video detector, and this indicated that the detector was not coping with the lighting conditions during the late night. Subsequent investigation at night showed that the presence of a nearby streetlight and the absence of vehicles moving through the picture led to the video detector incorrectly lock on for extended periods of time, and the problem was then able to be addressed. The split monitor was then used to quantify the condition with the detection fault (see Figure 22), and then confirm that operation as expected after the condition was rectified (see Figure 23). By contrast, the second report shows that minor-phase max-outs no longer occur after the detection error has been resolved. This allows the opposing major-street through movement to regain access to the green time that it needs, based on its heavier traffic demand, while the minor street phase is rarely required.
Purdue University's automated signal performance measure concepts have allowed UDOT to establish an efficient procedure for monitoring and maintaining detector health, which has been beneficial from both a reactive and a proactive standpoint. Reactively, it allows UDOT to more quickly and accurately identify reported problems without having to first visit the actual locations. Proactively, it also allows them to continuously and inexpensively monitor detector operations, to reduce complaints from the public. In the future UDOT hopes to further automate the detection monitoring system, to automatically identify and send alerts for detection problems and operational problems. The UDOT system is illustrated on: www.udottraffic.utah.gov/signalperformancemetrics
|
|
United States Department of Transportation - Federal Highway Administration |
||