Transportation Systems Management and Operations Benefit-Cost Analysis Compendium
CHAPTER 4. INTRODUCTION TO BENEFIT-COST ANALYSIS TOOLS
Benefit-cost analysis (BCA) of one or more transportation systems management and operations (TSMO) strategies can be conducted with the support of several available software tools. Some of these tools are generic and support the analyst in organizing their data for BCA. Others are more focused on the needs of analysts examining TSMO strategies and options. These include tools developed by regional, state, and Federal agencies, as well as proprietary tools developed by many private sector enterprises. These software tools range from simple methods intended for one-time analysis to more complex tools that are continually maintained and updated. Additionally, several emerging tools/methods are currently undergoing development as part of parallel efforts by the U.S. Department of Transportation (USDOT), American Association of State Highway and Transportation Officials (AASHTO), the Strategic Highway Research Program 2 (SHRP2), individual states and regions, and research organizations.
Some of the most widely distributed and applied tools used for conducting benefit-cost analysis of TSMO strategies include those summarized (in alphabetical order) in Table 3. This listing summarizes those major tools developed by Federal, state, or regional transportation agencies (or affiliated research organizations) that are available within the public realm. This listing does not include proprietary offerings of private-sector vendors. Specific descriptions of the various tools follow.
Source: FHWA TOPS Manual and JFA
The following sections provide a brief introductory description of the tools and methods presented in Table 3. More detailed information can be accessed by following the links provided.
- BCA.Net – BCA.Net is the FHWA's web-based benefit-cost analysis tool to support the highway project decision-making process, which is supported by the FHWA Asset Management Evaluation and Economic Investment Team. The BCA.Net system enables users to manage the data for an analysis, select from a wide array of sample data values, develop cases corresponding to alternative strategies for improving and managing highway facilities, evaluate and compare the benefits and costs of the alternative strategies, and provide summary metrics to inform investment decisions.
- CAL-BC – Excel spreadsheet-based tool developed by Caltrans. Originally designed to conduct benefit-cost analysis of traditional highway improvements, Cal-B/C has been subsequently enhanced to be used to analyze many types of highway construction and operational improvement projects, as well as some ITS and transit projects. Several agencies outside Caltrans have also adapted Cal-BC as the basis for their own tools. Cal-BC has been developed in separate versions supporting corridor- and network-wide benefits.
- Clear Roads – This toolkit is meant to be used not only to understand the expected costs and benefits of specific winter weather maintenance practices, equipment, or operations, but also to convey those expectations to decision-makers outside the maintenance community. It includes costs and benefits for new practices, equipment, and operations, as well as provides a means to be expandable in the future to include additional winter maintenance elements as needed. This toolkit was initially developed by the Western Transportation Institute at Montana State University and Current Transportation Solutions under contract to the Clear Roads Consortium and Wisconsin Department of Transportation
- COMMUTER Model – Spreadsheet-based analysis developed by the U.S. EPA to estimate emissions benefits related to a number of employer-based travel demand management strategies.
- EMFITS – Benefit-cost analysis methodology developed for New York State DOT and incorporated in New York State DOT ITS Scoping Guidance (Project Development Manual).
- FITSEval – The Florida ITS Evaluation (FITSEval) tool is currently under development by the Florida DOT. The tool is a travel demand model post-processor designed to estimate B/C of ITS from the State's standardized FSUTMS model structure.
- HERS-ST – Highway Economic Requirements System – State Version (HERS-ST) was developed by the FHWA. Originally designed for assessing the impacts of traditional capacity improvements, HERS-ST was updated in 2004 to include analysis of selected management and operations strategies through the use of a data preprocessor. The Operations Preprocessor modifies the basic characteristics of the HPMS data used by HERS (capacity, delay, crash relationships, and incident characteristics). HERS then estimates the impacts based on the revised characteristics. The I-95 Corridor Coalition recently used HERS-ST to assess impacts of investment in multistate corridors.
- HOT-BC – The HOT-BC was developed by the Managed Lanes Pooled Fund Study to analyze societal benefits and costs associated with value pricing projects for managed lanes. HOT-BC is an Excel based tool designed to help planners address the concern of legislators, transportation engineers, and the public on the cost-effectiveness of the value priced lanes in congestion mitigation.
- IDAS – The IDAS tools was initially developed by the FHWA in 2001 and has undergone multiple updates since. IDAS, a sketch-planning tool operating as a travel demand model post-processor, implements the modal split and traffic assignment steps associated with the traditional traffic demand forecasting planning model. IDAS estimates changes in modal, route, and temporal decisions of travelers resulting from more than 60 types of ITS technologies. There are more than 30 state and metropolitan planning organizations (MPO) applications of IDAS. Although many of the public sector-developed tools and methods presented in this section are available free of charge, IDAS is only available for purchase through the McTrans Center at the University of Florida.
- IMPACTS – IMPACTS is a series of spreadsheets, related to the STEAM model, developed to help screening-level evaluation of multimodal corridor alternatives, including highway expansion, bus system expansion, light-rail transit investment, HOV lanes, conversion of an existing highway facility to a toll facility, employer-based travel demand management, and bicycle lanes. Inputs are travel demand estimates by mode for each alternative.
- MBCA – The Multimodal Benefit-Cost Analysis (MBCA) is a free, web-based calculation system for comparing the costs and user benefits of individual transportation projects. MBCA is unique in that it covers both passenger and freight transportation spanning all modes – road, rail, air and marine – and it also includes pedestrian and bicycle modes. It is designed to be consistent with USDOT guidelines, making it useful for multimodal project assessment, grant applications and education programs. MBCA is set up with standard US and Canadian values for user benefit, which are not tied to any specific study area.
- TOPS-BC – The Tool for Operations Benefit-Cost Analysis (TOPS-BC) was developed in parallel with this Desk Reference and is intended to support the guidance provided in this document by providing four key capabilities: 1) allows users to look up the expected range of TSM&O strategy impacts based on a database of observed impacts in other areas; 2) provides guidance and a selection tool for users to identify appropriate B/C methods and tools based on the input needs of their analysis; 3) provides the ability to estimate life-cycle costs of a wide range of TSM&O strategies; and 4) allows for the estimation of benefits using a spreadsheet-based sketch-planning approach and the comparison with estimated strategy costs. The capabilities of TOPS-BC are highlighted throughout this Desk Reference.
- TRIMMS – Trip Reduction Impacts of Mobility Management Strategies (TRIMMS) model developed by the CUTR at the University of South Florida. TRIMMS© allows quantifying the net social benefits of a wide range of transportation demand management (TDM) initiatives in terms of emission reductions, accident reductions, congestion reductions, excess fuel consumption, and adverse global climate change impacts. The model also provides program cost effectiveness assessment to meet the FHWA's CMAQ Improvement Program requirements for program effectiveness assessment and benchmarking.
- SHRP L07 – Evaluation of Cost-Effectiveness of Highway Design Features – The overall objective of this project is to identify the full range of possible roadway design features used by transportation agencies on freeways and major arterials to improve travel time reliability, assess their costs, operational effectiveness, and safety, and provide recommendations for their use and eventual incorporation into appropriate design guides.
- SHRP C11 – Tools for Assessing Wider Economic Benefits – The Strategic Highway Research Program II funded the SHRP2 Project C11, "Development of Tools for Assessing Wider Economic Benefits of Transportation." The goal of this project was to develop a bridge between (A) the case study form of analysis provided by the TPICS web tool, and (B) more sophisticated simulation and forecasting models that are necessary to fully assess the wider economic impacts of proposed projects. This study provides four sets of spreadsheet tools that can aid in transportation project impact assessment. These tools enable measurement of project impacts on travel time reliability, intermodal connectivity and accessibility, and they are accompanied by an accounting system for incorporating them into economic benefit and impact analyses.
The above tools and research efforts represent a sampling of the available methods that may be used for supporting and conducting benefit cast analysis of TSMO strategies. The capabilities of many of these tools and the findings of the research efforts are more fully described in the Operations Benefit/Cost Analysis Desk Reference which is available at: https://ops.fhwa.dot.gov/publications/fhwahop12028/fhwahop12028.pdf
In addition, these developed tools and published research often form the basis for the benefit and cost estimation capabilities incorporated in the TOPS-BC tool.
TOPS-BC – A Tool for Benefit-Cost Analysis of TSMO Strategies
TOPS-BC provides an analysis framework and many default parameters that offer the capability to conduct simple sketch planning level benefit-cost analysis for selected TSMO strategies. This capability provides practitioners with the capability to conduct benefit-cost analysis quickly, simply and with generally available input data. A number of sketch planning tools and analysis frameworks described above allow analysts the ability to assess the benefits of a particular TSMO strategy or small sets of strategies. TOPS-BC leverages many of these existing tools to identify best practices, and synthesizes their capabilities into a more standardized format for analyzing a broader range of strategies within a single tool. TOPS-BC also links the estimation of sketch level benefits with life-cycle cost estimates. This ability to directly estimate benefits and costs within a single tool is uncommon in existing tools. TOPS-BC provides the ability to assess the sketch planning level benefits of various TSMO strategies using minimal user data input. Changes in performance measures, such as throughput, speeds, and number of crashes are based on simple and established relationships used in numerous other models. With generally available data such as corridor speeds, volumes and capacities, TOPS-BC can produce an estimate of the change in performance resulting from the implementation of TSMO strategies. This change in performance can then be used to generate enhanced metrics, and the estimated benefits can be monetized within the tool and compared with estimated life-cycle costs for the strategy.
While the sketch planning level analysis provided by TOPS-BC may be suitable for many planning studies, TOPS-BC was not intended to serve as a single analysis tool to be used for all situations. The Desk Reference discusses benefit cost analyses of deployments requiring detailed output and high levels of confidence in the accuracy of the results and how these studies may require more advanced analysis capabilities than provided directly within TOPS-BC. Even in these situations, however, TOPS-BC may provide value in serving as a framework for monetizing benefits and comparing with costs. Outputs from more advanced simulation or dynamic traffic assignment tools may be used as inputs to TOPS-BC, overriding the performance impacts normally calculated within the tool.
TOPS-BC is intended to provide a framework for analysts that can be modified and configured to match the needs of their regions and the characteristics of the area being analyzed. Default data is provided for many impact parameters, performance relationships, and benefit valuations. Such default data are typically based on national averages or accepted values. However, opportunities are provided, and users are encouraged, to use locally configured or regionally relevant data where appropriate and desired.
The TOPS-BC life-cycle cost estimation capabilities and the benefit estimation capabilities provide a common instructional worksheet with links to individual strategies housed on separate worksheets. The outputs from the benefits estimation include the Average Annual Benefit and the Stream of Benefits time horizon (up to 50 years). The estimated benefits for all strategy sheets are rolled up in a summary sheet that estimates the cumulative benefit for all strategies deployed in the selected analysis.
The cases provided in the compendium cover many of the strategies included in TOPS-BC. In some cases the strategies analyzed are evaluated with custom developed tools or with benefit-cost analysis software such as those identified above. In other cases, the strategy is evaluated with TOPS-BC where model input and output data are provided. Still other cases offer examples setting up, modifying and running TOPS-BC for TSMO strategies.
Data Requirements
Current data is essential for conducting BCA of TSMO projects or combinations of projects. TOPS-BC provides an analysis framework and many default parameters in order to provide the capability to conduct simple sketch planning level BCA for selected TSMO strategies. This capability was provided in order to enable practitioners to conduct BCA quickly, simply and with generally available input data. A number of sketch planning tools and analysis frameworks currently exist to assess the benefits of particular TSMO strategies or small sets of strategies. TOPS-BC leverages many of these existing tools to identify best practices, and synthesizes their capabilities into a more standardized format for analyzing a broader range of strategies within a single tool.
TOPS-BC also links the estimation of sketch level benefits with life-cycle cost estimates developed elsewhere in the model. This ability to directly estimate benefits and costs within a single tool is uncommon in existing tools to date. The benefits estimation capability of TOPS-BC incorporated much of the latest research on the benefits of TSMO, particularly for many new and emerging strategies.
TOPS-BC provides the ability to assess the sketch planning level benefits of various TSMO strategies using minimal data input. Changes in performance measures, such as throughput, speeds, and number of crashes are based on simple and established relationships used in numerous other models. With generally available data such as corridor speeds, volumes and capacities, TOPS-BC can produce an estimate of the change in performance resulting from the implementation of TSMO strategies. This change in performance can then be used to generate enhanced metrics, and the estimated benefits can be monetized within the tool and compared with estimated life-cycle costs for the estimation of a benefit-cost ratio and net benefits.
There are two methods available to modify the values required for benefit calculation in TOPS-BC. For an individual technology evaluation, the user can input values into the green cells on the Benefits Estimation pages or the user can go to the Parameters page and make universal modifications that will be used in all future TOPS-BC calculations until changed again.
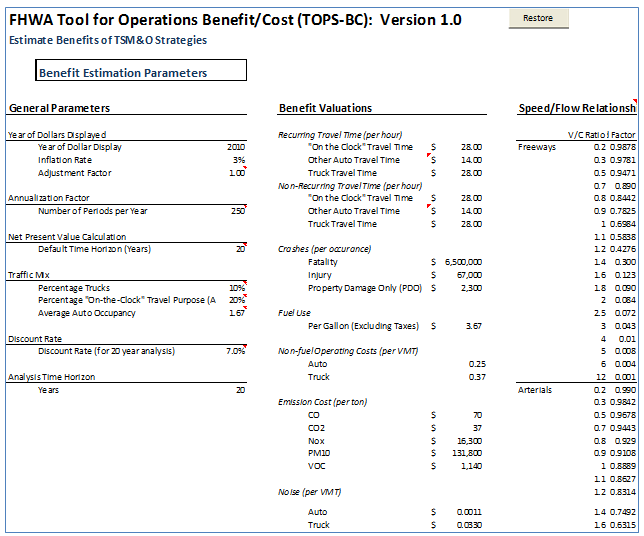
Updating the Parameters Page. TOPS-BC allows the user to rely heavily on data already contained in TOPS-BC. The user is also encouraged to update default values for individual TSMO benefit analysis with more recent data. In addition, information generated for the project by simulation modeling, travel demand modeling, surveys or other means can be input to TOPS-BC to replace default values. The user will always input some project/facility information such as the facility type, location, length, number of lanes, etc. Some default values contained in TOPS-BC are located on the Parameters Page. These data are used by many technologies and strategies to provide quantification and monetization. A partial screen shot of the TOPS-BC Version 1.0 Parameters page is provided in Figure 10.
 Source: FHWA TOPS-BC
Figure 10. Screenshot. Portion of the Benefit Estimation Parameters Page from the Tool for Operations Benefit-Cost Analysis
Source: FHWA TOPS-BC
Figure 10. Screenshot. Portion of the Benefit Estimation Parameters Page from the Tool for Operations Benefit-Cost AnalysisThe Parameter page also includes data on fuel economy for autos and trucks and incident delay factors by facility type, duration and congestion levels. Note that the gasoline price per gallon excludes all taxes. The user may want to modify some of these values to reflect more current or regionally specific information. Note the upper right hand corner where a Restore button allows the user to go back to the original default values on this page at any time. The first item to observe is the Year of Dollar Display, here 2010. If prices or values are changed on this page, they must be entered in the base year 2010 dollars. The Parameters page assumes a 3 percent annual inflation rate, but this value can be modified. If you change the Year of Dollar Display to the current year the page will recalculate most values on the page to that year dollars assuming a 3 percent annual inflation rate. These revised values will now be used in all TOPS-BC calculations that call for that value.
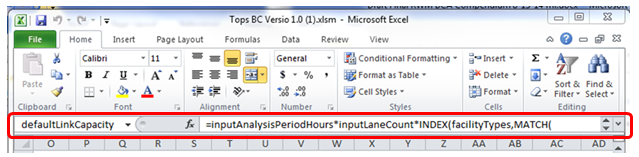
If you plan to change a value in the Benefit Valuations column, you should do this in the formula bar by editing the formula displayed, and not in the individual cell. The formula bar in Excel is located above the work area of the spreadsheet, shown in Figure 11. The formula bar displays the data or formula stored in the active cell. The formula bar can be used to enter or edit a formula, a function, or data in a cell. If you enter a new value directly in a cell, it will overwrite the cell formula. In this case, if you later change the Year of Dollar Display, the Benefit Valuation for the cell changed directly will not be updated to the new year dollars.
 Source: Microsoft Inc. Excel Spreadsheet and FHWA TOPS-BC
Figure 11. Screenshot. Excel Formula Bar Outlined in Red
Source: Microsoft Inc. Excel Spreadsheet and FHWA TOPS-BC
Figure 11. Screenshot. Excel Formula Bar Outlined in Red
The user can also change the speed flow relationship or the delay factors. Be careful to make these adjustments in the same cells as are now displayed on the Parameters page as they may be referred to by another sheet in the model.
TOPS-BC Current Safety Impact Defaults
In the TOPS-BC methodology, the number of crashes is generally estimated by applying a crash rate based on crashes per vehicle miles traveled. The overall crash rates are based on crash rates from the FHWA's ITS Deployment Analysis System (IDAS) analysis tool. Different rates are provided by roadway type (freeway or arterial) and for three different crash severity levels (fatality, injury and property-damage-only (PDO)). For selected categories (freeway injury and PDO crashes) the rates are sensitive to the volume/capacity (V/C) ratio of the analyzed facility and increase at higher levels of congestion. Table 4 shows the safety rates uses for the different categories. Table 5 shows the V/C ratio-sensitive rates used for estimating the freeway injury and PDO crashes. These and other TOPS-BC defaults can be overridden if users have more accurate or accepted local values.
Table 4. Crash Rates per Million Vehicle Miles Traveled.
| Severity |
Freeway |
Arterial |
| Fatality |
.007 |
.018 |
| Injury |
Variable |
1.699 |
| PDO |
Variable |
2.474 |
Source: FHWA TOPS-BC
In TOPS-BC, the non-fatal crash rate assumed on freeways is based on the volume to capacity ratio or V/C. TOPS-BC uses a fixed crash rate for freeway crash rates for injury and PDO crashes where the V/C is less than 0.7 or greater then 1.0, TOPS-BC uses an increasing crash rate for injury and PDO crashes when V/C is between 0.7 and 1.0. The variable rates are shown in Table 4.
Table 5. Crash Rates per Million Vehicle Miles Traveled.
| V/C Ratio |
Freeway Injury Crashes |
Freeway PDO Crashes |
| .1 to .7 |
0.476 |
0.617 |
| 0.8 |
0.532 |
0.718 |
| 0.9 |
0.677 |
0.836 |
| 1+ |
0.706 |
0.919 |
Source: FHWA TOPS-BC
Using this general methodology, the number of crashes is predicted to change for any strategy that results in a change in VMT, or strategies that result in a change to the volume/capacity level of freeway facilities.
In addition to this general estimation methodology, selected strategies available for deployment in TOPS-BC also have specific default safety impacts associated with them that are applied on top of any crash change resulting from a change in VMT or V/C ratio. Table 6 presents these default impacts currently used in the tool.
Table 6. Default Impact Assumptions Currently in the Tool for Operations Benefit-Cost Analysis.
| Strategy |
Default Impact Assumptions |
| Arterial Traffic Signal Coordination |
10% reduction in crash rate for pre-set timing signal coordination
12.5% reduction in crash rate for traffic actuated signal timing
15% reduction in crash rate for centrally controlled signal timing |
| Ramp Metering |
27% reduction in crash rate for pre-set timing metering
27% reduction in crash rate for traffic actuated metering
27% reduction in crash rate for centrally controlled metering |
| Traffic Incident Management |
10% reduction in fatality crashes for incident detection/verification strategies due to faster response times
Notes: –Reduced number of fatality crashes added to injury crashes totals. No net change in the number of total crashes. –User is provided opportunity to enter a percentage reduction (for all crash severity categories) to represent a reduction in secondary crashes resulting from the introduction of the traffic incident management strategies. Default in the tool is 0% (no change). |
| Pre-Trip Traveler Information |
No change to default crash rates |
| En-route Traveler Information |
No change to default crash rates |
| Variable Speed Limits/Speed Harmonization |
7% reduction in crash rates |
| Work Zone Management |
10% increase in base crash rate to reflect added risk of work zone
7% reduction in modified crash rates to reflect crash reduction benefit of work zone management strategies |
| Travel Demand Management |
No change to default crash rates |
Source: FHWA TOPS-BC
How to Use the Compendium
The Compendium is designed to work with the Desk Reference and the TOPS-BC User's Manual. Together the Desk Reference and the TOPS-BC User's Manual provide the basic instructions for conducting a BCA of a TSMO project. The Compendium compliments these tools by providing case references where BCA of TSMO projects have been completed. In addition, the hypothetical examples demonstrate particular uses and modifications of TOPS-BC. The intent is to demonstrate a broad range of Operations BCA cases so that users have a better idea of the structure and aspects of similar analysis they may interested in performing.
Users who have a particular strategy or technology they are interested in evaluating can find that strategy or technology in Table 7. This table lists types of strategies and technologies along with an indication of the project title if it is a previous BCA. If it is a hypothetical case, the description is more generic. The table also indicates some of the type of information addressed by each case study to assist the user in locating the case which will be most suited to their current needs.
TOPS-BC was released by FHWA in late 2013. As such, there are not many published analyses applying the software. Few of the real world cases presented in the Compendium use TOPS-BC. As with any job, finding the right tool is critical. In many cases this is a custom application developed for the particular project under review. Some BCA models are generic by design. They allow the user to construct the analysis of a particular project and the model assists with the calculation. An example of this type of model is BCA.net, available at https://www.fhwa.dot.gov/infrastructure/asstmgmt/bcanet.cfm.
A model like TOPS-BC is designed to cover a range of TSMO projects and include cost and benefit computations for each technology. Notably, some models are developed for a specific technology or strategy. For example, the Freeway Service Patrol Evaluation (FSPE) model was developed by the University of California Berkeley for the analysis of a specific technology. A technology/strategy specific model usually contains more detail about the deployment of the technology and may require more specific information from the user. Such a model is usually applied closer to deployment than a sketch planning tool.
Table 7 presents the listing of TSMO technologies covered in the Compendium. For each case the table works as a guide to help users find what they are looking for. Each case presented is an example of a benefit-cost analysis previously conducted for a TSMO strategy or technology or it is an example of how such an analysis could be undertaken in TOPS-BC. The column heading indicates some of the areas addressed in each case. These include:
- Case Number and Name
- This Compendium of TSMO Benefit-Cost Analysis includes three general types of case studies:
- TSMO BCAs conducted by government or private agencies.
- Demonstration of TSMO BCAs using the TOPS-BC tool.
- Demonstration of a user modification to the TOPS-BC software.
- TSMO Area
- The case studies are organized into seven general technology/strategy areas including: traveler information, arterials, freeway systems, demand management, transit, other strategies and combined strategies.
- TSMO Strategy Type
- Within each strategy type, several examples of different types of strategies or analysis tools are provided.
- Real or Hypothetical
- Case studies that report on the findings of previous BCA studies are referred to as real case studies. Hypothetical case studies are examples of how to run TOPS-BC or to carry out specific calculations using hypothetical data which may come from actual projects or averages of previous project data. Hypothetical case studies are for demonstration purposes only.
- BCA Tool Demonstrated – TOPS-BC, Custom, Other
- The sketch planning TOPS-BC tool is highlighted in the TSMO BCA Desk Reference, but it is not the only such BCA tool and many cases report the use of custom software or other packaged tools for their BCA analysis of TSMO strategies.
Table 7. Default Impact Assumptions Currently in the Tool for Operations Benefit-Cost Analysis.
| # |
Case Name |
Transportation Systems Management and Operations Area |
Strategy Type |
Benefit-Cost-Analysis Model |
Actual or Hypothetical Case |
| 5.1 |
Hypothetical Preset Arterial Signal Coordination |
Arterial Operations |
Signal Coordination |
TOPS-BC |
Hypothetical |
| 5.2 |
Adaptive Traffic Signal Control in Greeley and Woodland Park, Colorado |
Arterial Operations |
Adaptive Signal Control |
Custom In-house Analysis |
Actual |
| 5.3 |
Adaptive Traffic Signal Control |
Arterial Operations |
Adaptive Signal Control |
Custom In-house Analysis |
Hypothetical |
| 5.4 |
Hypothetical Roundabouts |
Arterial Operations |
Roundabouts |
TOPS-BC |
Hypothetical |
| 5.5 |
Effectiveness of Roundabouts in Maryland |
Arterial Operations |
Roundabouts |
Custom Stand Alone BCA Model Focused on Safety Benefits |
Actual |
| 5.6 |
Effectiveness of Arterial Management in Florida |
Arterial Operations |
Arterial Management |
TOPS-BC |
Actual |
| 6.1 |
Hypothetical Centrally Controlled Ramp Metering Deployment |
Freeway Systems Management |
Ramp Metering |
TOPS-BC |
Hypothetical |
| 6.1 |
Florida DOT Road Ranger Program |
Freeway Systems Management |
Freeway Service Patrol |
Custom Stand Alone BCA Model Focused on Safety Benefits |
Actual |
| 6.3 |
Metropolitan Area Transportation Operations Coordination Program |
Freeway Systems Management |
Freeway Management |
Custom Stand Alone BCA Model |
Actual |
| 6.4 |
Regional Traffic Management Center, Ft. Lauderdale, FL |
Freeway Systems Management |
Traffic Management Center |
Custom Stand Alone BCA Model |
Actual |
| 6.5 |
Coordinated Highways Action Response Team, Maryland |
Freeway Systems Management |
Traffic Management Center |
Custom Stand Alone Benefit Analysis |
Actual |
| 6.6 |
Georgia NaviGator Traffic Incident Management System |
Freeway Systems Management |
Incident Management |
Custom Stand Alone Benefit Analysis |
Actual |
| 7.1 |
Minnesota I-35W Urban Partnership |
Demand Management |
Demand Management, Congestion Pricing |
Project Developed BCA Tool |
Actual |
| 7.2 |
Interstate I-95 Express Managed Lanes |
Demand Management |
Managed Lanes |
TOPS-BC |
Actual |
| 8.1 |
Transit Signal Priority, Portland Tri-Met |
Transit Operations |
Transit Signal Priority |
Internal BCA Data Review |
Actual |
| 8.2 |
Transit Signal Priority, Los Angeles DOT/MTA |
Transit Operations |
Transit Signal Priority |
Internal BCA Data Review |
Actual |
| 9.1 |
Oregon's Automated Wind Warning System |
Traveler Information |
Automated Wind Warning Systems |
Custom In-House Analysis |
Actual |
| 9.2 |
Hypothetical Truck Tip-Over Warning System |
Traveler Information |
Curve Speed Warning Systems |
TOPS-BC |
Hypothetical |
| 9.3 |
Freight: Truck Over-Height Warning System |
Traveler Information |
Over-Height Warning System |
TOPS-BC |
Hypothetical |
| 10.1 |
Road Weather Pooled Fund Maintenance Decision Support System (MDSS) Implementation |
Other Strategies |
Maintenance Decision Support System |
Custom In-House Analysis |
Actual |
| 10.2 |
Hypothetical Maintenance Decision Support System (MDSS) Implementation |
Other Strategies |
Maintenance Decision Support System |
TOPS-BC |
Hypothetical |
| 11.1 |
Automated License Plate Recognition |
Multiple Strategies |
Automated License Plate Recognition System, Weigh-in-Motion, Automatic Vehicle Identification |
Custom In-House Tool |
Actual |
| 11.2 |
Cincinnati Region Advanced Regional Traffic Interactive Management & Information System (ARTIMIS) Study |
Multiple Strategies |
Regional traffic operations center, traffic surveillance, incident management, freeway service patrols, traveler information, dynamic message signs, highway advisory radio |
IDAS |
Actual |
| 11.3 |
Washington's Automated Anti-Icing System Study |
 |
|
Custom In-House Analysis |
Actual |
Source: JFA
Overall Lessons Learned from Case Studies
Each case study provides detailed key observation about the application of BCA to the specific TSMO projects. The following list of lessons learned apply to BCA in general and should be kept in mind when conducting BCA.
- Use Good Data – It Is Essential – TOPS-BC, BCA.net and other BCA Tools support the analytic process when good data on MOE change is available. When limited data is available, some BCA systems can still use default data to support preliminary system analysis.
- Clearly Identify the Baseline – A benefit-cost analysis compares and alternative to a baseline condition. The practitioner should calculate all benefits and cost in relation to that baseline to produce a meaningful analysis.
- Use Data from Real Projects – TOPS-BC and other BCA Tools often include default values for required inputs. These are national estimates taken from the published literature. Users should review these values to see if they seem appropriate for your region or project.
- Use Net Present Values – A benefit-cost analysis should calculate the NPVs of the streams of incremental benefits and costs over the lifetime of the project. TOPS-BC divides the resulting NPV of benefits by the NPV of costs to produce a meaningful benefit-cost ratio.
- Provide Additional Benefit Estimates – As TOPS-BC provides a specific set of benefits, you may have other benefit estimates such as reductions in vehicle emissions. TOPS-BC allows you to enter these values directly and have them included in the benefit-cost analysis.
- Evaluate Strategies – A benefit-cost analysis needs estimates of the change in MOEs to compare and contrast with and without technology conditions. These changes in MOEs can be quantified to compare with costs.
- Test the Deployment before Expanding the System Sensitivity Analysis – A benefit-cost analysis allows the user to examine the efficiency of the installation and compare it to alternative assumptions.
- Consider Combining Strategies – As many TSMO projects and strategies are synergistic, consider combining multiple strategies to maximize benefits.
- Conduct a Before and After BCA – BCA can and should be conducted before deployment, but it is also a good tool for post deployment analysis when project performance impacts are often observable.
- Add Qualitative Benefits – While not all benefits are easily quantifiable, qualitative descriptions of items like "improved quality of life" provide the decision maker and the public with a better understanding of what is accomplished by project deployment.