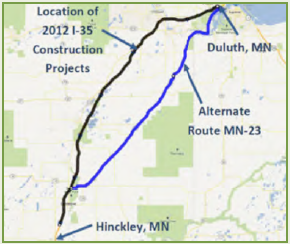
Travel Time on Arterials and Rural Highways: State-of-the-Practice Synthesis on Rural Data Collection Technology3. Implementations of Rural Travel Time Data CollectionThis section provides summaries of RTT data collection implementations. The implementations described were selected to represent a broad range of implementation objectives, methods, and technologies. Emphasis is placed on implementations that collect travel time data that can be leveraged in real time. Note that the first two RTT implementations addressed in this section (I-35 Minnesota, Duluth to Hinckley; and I-95 Maine, Portland to Houlton) are described as detailed case studies, whereas the following implementations are described more briefly. 3.1 Minnesota DOT's I-35 Temporary Travel Times System3.1.1 Background and PlanningBackground In 2012, Minnesota Department of Transportation (MnDOT) initiated three separate roadway improvement projects along I-35 from Hinckley to Duluth that covered approximately 70 miles of rural highway. The roadway is not a typical weekday commuter route; I-35 is primarily a recreational route with high traffic volumes over holidays and weekends. The peak traffic times occur mostly on weekends when motorists are traveling to and from resort areas, and traffic would be most impacted by construction from May 2012 to October 2012. A detailed account of the project and its results is provided in the final report by Athey Creek Consultants (2013). Defined need MnDOT recognized the need to provide accurate travel times and congestion information to motorists along the freeway during construction with minimal latency issues. The system was to be designed and deployed to aid travelers in making decisions on whether to travel I-35 or Minnesota State Route 23, an approved alternate route during construction, as shown in Figure 7. "The purpose of this project is to inform the traveling public of the travel times through three major reconstruction projects on I-35 this summer," said Dave Mavec, project engineer. "The intent is to reduce driver frustration by displaying the actual driving time it takes to drive through the corridor. State Route 23 travel times are displayed to encourage State Route as an alternate route." It was also important to MnDOT that the public be involved in providing feedback on the travel time project. Objectives In addition to several internal criteria, MnDOT defined the project's intent and purpose as the following:
Specifications The travel time system was to be automated and used temporarily during the I-35 construction projects. MnDOT created a performance specification allowing the contractors to pursue the travel time system that met the project objectives so long as maintenance and upkeep of the system were minimal. Among other criteria, the specifications included the following:
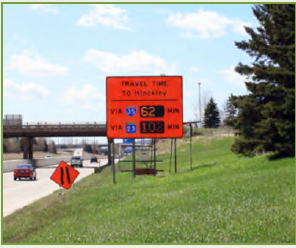
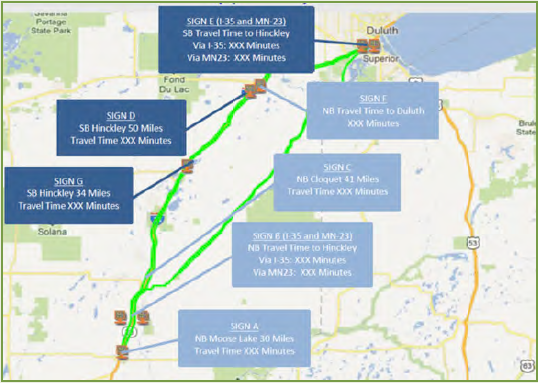
3.1.2 Implementation and ManagementContract requirements MnDOT hired a contractor through its Design-Build process to implement a temporary standalone travel time project throughout the I-35 work zones and on an arterial highway, State Route 23. The system included deployment of seven roadside static signs along I-35 with inserted changeable modules that displayed travel times to the motorists in real-time, as shown in Figure 8. The system was required to have sufficient traffic detection devices (sensors) to detect traffic speeds and, by the use of an algorithm, compute and communicate estimated travel times. The quantity and location of sensors were not specified in the plans and were to be tailored to the site by the contractor. Sensors were required to be relocated when construction stages changed. The contractor, Renaissance Technologies, Inc. (RTI), deployed 12 radar sensors to collect travel time information. The traffic data collected was archived in an .zxml format and ultimately transferred to MnDOT ownership (Athey Creek Consultants, 2013). Updates to travel time information were required to occur at least every 5 minutes. The accuracy and latency values were determined by reviewing values used by MnDOT for travel time displays in the Metro area, calculations based on a percentage of travel times between signs at normal speeds, and a maximum deviation thought to be acceptable to the public. After this analysis, MnDOT estimated that the public would not likely accept more than a 15 minute deviation at any one sign. The final accuracy and latency deviation from the displayed travel time values were determined using engineering judgment for each sign location. Dissemination RTI's flagship software, TrafAlert™, was used to communicate travel time information to the public via eight DMS, seven roadside static signs, and an online travel time map. Messages displayed on the seven roadside static signs are depicted in Figure 9. The TrafAlert™ software enabled total control of roadside signs and sensors from a central location. Because this work zone was outside of the installed communications devices of the MnDOT TMC's central dispatch, the I-35 system operated independently of the TMC and was not integrated into any other MnDOT system. Figure 9. Travel Time Sign Locations
and Messages on I-35 Evaluation Travel time accuracy was assessed by MnDOT using floating car runs to compare travel time estimates to actual drive times. The assessment found that 95 percent of travel times were within the allowable accuracy range and that, among the 5 percent that were out of range, more than 85 percent of these instances occurred during or shortly after periods of congestion began. MnDOT also conducted online surveys to assess travelers' reactions to the travel time system. The surveys found that nearly all respondents who traveled the designated route noticed the travel time information. Respondents felt that the information helped them make route and other planning decisions, set expectations, and reduce stress. 3.1.3 Lessons LearnedOverall, MnDOT deems the project as a success which benefited travelers throughout the summer travel season. Feedback obtained through a public survey was generally positive, and respondents appreciated having information that prepared them for congestion in the work zone and assisted them in making decisions about taking alternate routes. Through comments provided by MnDOT staff and the contractor, MnDOT has indicated they may provide additional system specifications to contractors in the future in order to enhance travel time data output accuracy and minimize latency. MnDOT indicated that project costs were much more affordable compared to implementing a permanent system. An extensive set of lessons learned by MnDOT and the project contractor are provided in the project final report (Athey Creek Consultants, 2013) and select lessons learned are summarized below:
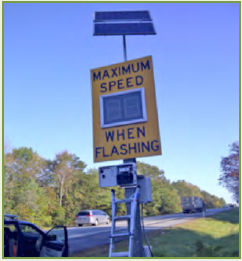
3.2 Maine DOT's Use of Variable Speed Limit (VSL) Signs to Provide Real-Time Traveler Information3.2.1 Background and PlanningBackground During 2008 and 2009, the State of Maine updated its VSL signs system (see Figure 10) on Interstate 95, Interstate 295, and surrounding arterial routes. The State's intention was not just to capture data related to user delay and vary speed limits to make them appropriate for conditions, but ultimately to provide travel time information to motorists. The Maine Department of Transportation (MaineDOT) currently displays variable speed limits across the I-95 corridor and provides situational alerts through the 511 system. The system measures and displays speeds to enhance real-time information relayed to motorists.
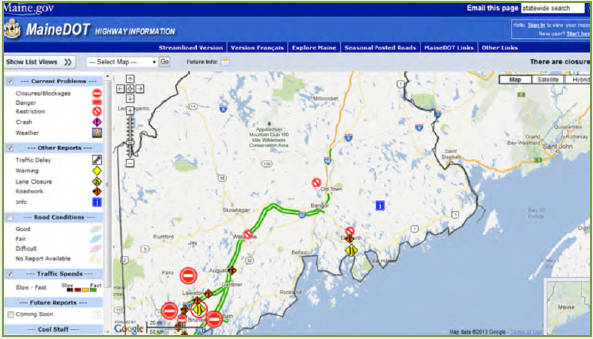
Objectives Initially, the State's goal was to improve incident notification information for all highway incidents and weather events, control speeds, and improve the State's 511 System mapping capabilities for the public. The Maine 511 Travel Information Service is designed to help commuters and travelers access information regarding weather-related road conditions, construction zones, and congestion areas, via either the 511 website (www.511maine.gov) as shown in Figure 11 or phone, 24 hours a day and 7 days a week. The 511 website hosts a traveler information map containing information on speeds along the corridor. While motorists aren't explicitly given travel time information, in a rural setting the posted variable speed limit may help to identify areas where delays exist and implicitly advise motorists to consider other routes. Data Collection The addition of the radar units on the back of the VSL signs allows MaineDOT to measure average Interstate segment speeds, which can be used to detect delays and estimate travel times to key junction points. The agency uses this information to manage the corridor and reduce impacts to travel caused by incidents or weather, with information being updated to the traveler information map. 3.2.2 Implementation and ManagementSensor Locations The systems are installed at the end of interchange on-ramps on both the northbound and southbound side of I-95 and I-295 and controlled via cell modem from MaineDOT's central radio room. There are 75 signs installed from Portland to Houlton covering a distance of approximate 260 miles. The distance between the interchanges ranges from 2 miles to 10 miles apart. The VSL signs allow the Department to measure average Interstate segment speeds, which can be used to detect delays and allow motorists to estimate travel durations to key junction points. MaineDOT is also using Bluetooth technology through TrafficCast to monitor real-time travel data for several other routes.System Architecture and Processes The VSL system is not part of an integrated system, but it uses a tiered approach that involves the radar, camera, and dispatcher information to verify incidents on the corridor and reinforce decisions for the route. Analysis of the data is automated, but it involves direct review, analysis, and decision making by MaineDOT dispatchers. MaineDOT built this into their process to give a sense of ownership to the dispatchers. The dispatchers have three main roles: 1) monitor the two-way radio communications; 2) address public inquiries; and 3) maintain the data entry of the information posted on the 511 website and traveler information map. The dispatchers oversee the communications to the signs. This is accomplished through the use of a cellular modem, which is sampled every 15 minutes. Speed and occupancy data are sent to a server and processed through an algorithm analysis. A threshold speed of 40 mph initiates an alert that is emailed to a dispatcher. The dispatcher reviews the data, which are displayed in a spreadsheet. Based on the data presented, the dispatcher will program the VSL sign(s) to reflect an appropriate speed for the current road conditions. If available, the dispatcher will use a camera feed to verify the roadway condition, and issue a situational alert for public and operations posting. 3.2.3 Future ConsiderationsMobile Applications MaineDOT is considering evaluating mobile applications used by smartphones to collect traveler information that the user agrees to send. One example of a social application is Waze, a community-based traffic and navigation application for real-time traffic and road information. The data from the Waze application may be used in the future to build value on top of data currently available to MaineDOT and can supplement information being collected by the agency. This information may eventually help to explicitly communicate travel times to motorists who are without access to mobile devices. To consider integrating mobile applications into the traffic management process, MaineDOT is working on a request for information (RFI) to solicit other application vendors to come forward and be evaluated. Costs Costs for this basic but informative way to share travel information are much less than deployment of DMS and associated hardware, software, and technology packages. The total MaineDOT VSL project cost was $776,849.54. The replacement cost for a VSL sign is estimated at approximately $10,000. To add a radar unit to each sign costs approximately $500 and each camera costs approximately $1,500. The combined cost for cameras and radar units was approximately $66,000. In comparison, deploying this type of system costs approximately one-tenth of traditional travel time communication devices such as DMS. 3.3 Various Statewide Routes, WisconsinWisconsin DOT (WisDOT) has implemented travel time data collection systems on rural roads as part of its Traffic Operations Implementation Plan (TOIP), which guides efforts in transportation planning and improvement, and allows ITS to be implemented in major roadway projects at a cost that is considered incidental to the project (i.e., less than 10 percent of project cost). The TOIP encourages ITS deployment to be considered in the construction process, to be used to mitigate construction-related congestion, and helps to distribute ITS deployments where they are most needed.
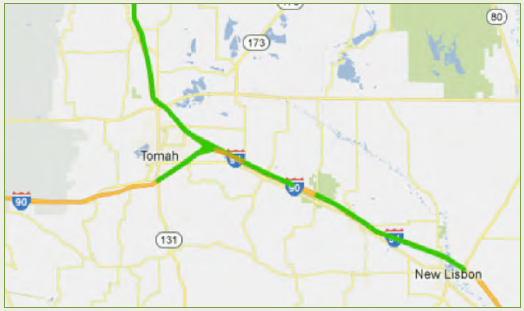
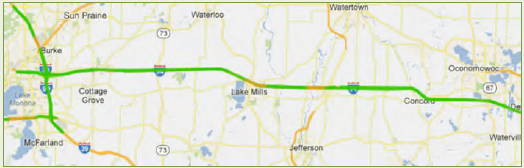
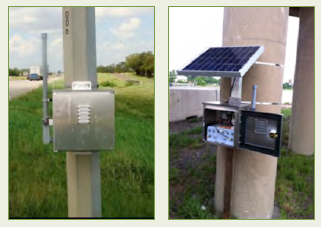
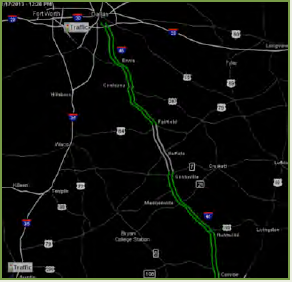
On rural freeways, WisDOT captures travel time data using sidefire microwave detectors. RTT coverage is provided in the vicinity of the I-90/I-94 split near Tomah, WI (see Figure 12) on the I-94 corridor between Milwaukee and Madison (see Figure 12), and a portion of US-41 between Milwaukee and Green Bay. WisDOT has been implementing these travel time deployments for about 7 years. Prior to sidefire radar, WisDOT used loop detectors as its primary source of travel time data, then shifted to microwave detection. Microwave detection was preferred over loop detectors and eventually became standard practice because it was easier to maintain and replace, with the particular benefit of not requiring lane closures and invasive pavement work. WisDOT experience shows that rural travel times vary infrequently unless there is a traffic incident. The RTT system, however, is not intended specifically for use as an incident detection system and does not include any features for automatic incident detection; WisDOT generally learns of incidents first from police reports. WisDOT provides DMS showing travel times on some rural routes. In a non-scientific survey, about 80 percent of drivers stated a preference for messages that show both travel time and distances to destinations. In rural areas, travel time sign destinations may be relatively far away and destination names might not be meaningful in and of themselves to drivers, so providing distance allows drivers who are unfamiliar with the area to calculate travel times for themselves. In the future, WisDOT anticipates that travel time data collection technologies may transition to Bluetooth probe technologies due to the lower cost of installation and maintenance, or the agency may opt to purchase third-party travel time data. WisDOT is also interested in the possibilities of connected vehicle technology for travel time data. It is possible that the future role of WisDOT and other DOTs will not be in collecting travel time data themselves, but validating data from third-party sources. 3.4 I-45 from Houston to Dallas, TexasThe I-45 corridor is a rural Interstate of approximately 230 miles that connects Houston and Dallas and serves as a hurricane evacuation route. In recent years, major hurricanes threatened the Gulf Coast and have brought attention to the need for effective hurricane evacuation management. Transportation officials needed the ability to monitor traffic conditions along the evacuation route and to determine whether to deploy contraflow (Texas Transportation Researcher, June 2010). In 2009 Bluetooth detectors were installed along 225 miles of I-45 to collect the necessary traffic information. Two examples of pole-mounted Bluetooth units are shown in Figure 13. Detector spacing ranges from 5 miles to 20 miles, but sensors are typically between 5 and 8 miles apart. Bluetooth was selected for use primarily because it was significantly less expensive than the toll tag reader technology that has been used in earlier implementations. Before the implementation began, Houston TranStar, a partnership of government agencies responsible for providing transportation and emergency management services to the Greater Houston Region, conducted feasibility testing to ensure that Bluetooth captured sufficient data and reported accurate travel times. Testing showed that Bluetooth performed comparably to Houston's more established toll tag reader technology (Puckett, 2011). In addition to aiding with evacuation planning, the travel time system is intended to provide useful information to motorists and TranStar staff regarding current traffic conditions. Color coded real-time travel times are displayed on a map on the Houston TranStar website (see Figure 14).
3.5 Various Routes in Oregon, Frontier Travel Time ProjectIn 2000, the Frontier Project Technical Advisory Committee (TAC), which includes representatives from eight State DOTs, selected an RTT estimation system for demonstration on rural highways near the Oregon coast (Wright, Shi, & Lee, 2005). Congestion and incidents are common on this corridor, and the TAC intended for the demonstration project to be capable of providing travel times and incident information to Oregon DOT (ODOT) and to motorists. The TAC distributed system requirements to interested vendors and vetted bids based on price, previous success with travel time deployments, and timeliness. The TAC chose an infrared ALPR technology. The system read license plates, encrypted the license plate numbers, and sent them via telephone communications to a central server, where vehicle matches were made and travel times were calculated. The entire travel time system consisted of a total of six license plate recognition cameras mounted on cantilevers above the road. Each installation consists of two cameras, one for each direction. One road segment was 3.15 miles long and the other road segment was 22.25 miles long. The TAC cooperated closely with the vendor to ensure that the system was installed as specified. The system operated as intended for the first 2 months in 2001, but then a series of software and equipment failures ended the initial effort, and the system remained dysfunctional until 2004. The most significant problem was a faulty power supply module, which was not replaced by the vendor for almost 1 year. Once the replacement part was available, it took another year for ODOT staff to fully repair the system because there was a significant backlog of maintenance work elsewhere, and the travel time system was considered non-critical to safe operation of the roadway network. Upon restoration of the system, the quality of the system's data was evaluated. Analyses showed that when the system was functional, it provided accurate travel times, though an insufficient amount of data were available under congested conditions to evaluate system accuracy when traffic is heavy. Segment length had a significant effect on vehicle match rates: for the long 22-mile segment, match rates were under 5 percent of traffic, whereas for the short 3-mile segment, match rates were above 15 percent. The system also could be used for incident detection, but ODOT found that cell phone calls from motorists and other communication means were generally faster and more reliable. Despite this success, the system was discontinued due to ongoing operational and maintenance issues; ODOT was not willing to rely on the data or disseminate it given that the system was prone to failure. Lessons learned in this demonstration project include:
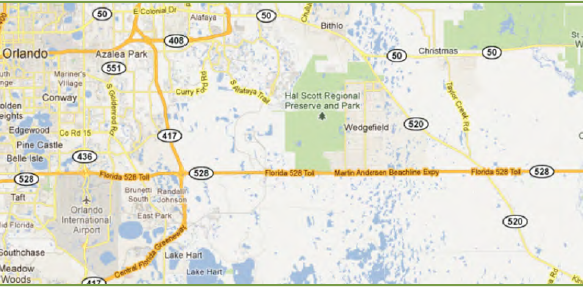
3.6 State Route 520 in Orange County, FLThe Orlando-Orange County Expressway Authority (OOCEA) manages one DMS, located in the eastern part of Orange County, between Orlando and the Atlantic coast. The sign was installed in 2008 on northbound SR-520, about 0.5 miles before reaching SR-528. This sign is in a largely undeveloped, rural area. Figure 15. Orange County Road Network This DMS was originally intended to assist with coastal evacuations: in such scenarios, the SR-520 northbound to SR-528 westbound route would be heavily utilized (see Figure 15). However, at this junction drivers headed toward Orlando have the choice of either remaining on SR-520 or switching to SR-528; both routes are viable options to reach much of the Orlando area. To aid drivers, travel times for westbound SR-528 are shown on this DMS. SR-528 is a toll road that is heavily used by commuters to Orlando and travelers headed to or from Orlando International Airport. Although travel times are not shown for SR-520, drivers can use the SR-528 travel time to help determine which route would be best for them. For example, an unusually long travel time on SR-528 might suggest that SR-520 would be a faster route. As an added incentive, there is no toll on SR-520.
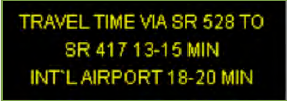
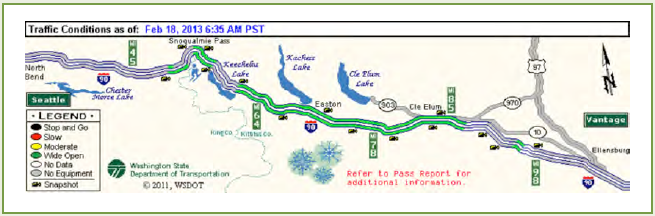
Travel times are calculated from vehicles' on-board toll transponders, used for toll collection on SR-528. Travel times are calculated each minute. However, 10 vehicles matched between 2 locations are needed to develop an average. When there are fewer than 10 matches every minute, the sign displays the travel time as calculated from the most recent 10 reads. The sign is normally formatted as displayed in Figure 16. The destinations displayed are always Orlando International Airport and SR-417. However, if the travel time to either of these destinations is a certain percentage (e.g., 50-100 percent) above the normal or expected travel time, there is instead another display. (Expected travel time is calculated from the mean travel time at that time of day, as recorded over the past 4 weeks.) The banner "TRAVEL TIME VIA SR 528 TO" is then replaced by "TRAVEL TIME ALERT." The word "ALERT" flashes, as do the destination(s) for which the travel time is elevated. The travel times also flash. In the case of a travel time alert, the DMS is two-phased and alternates with an incident-related message (i.e. CRASH AHEAD). Although travel times are not shown for the alternate route (SR-520), drivers can use the SR-528 traffic conditions as a basis for route choice. The sign operates 24 hours a day. 3.7 I-90, Snoqualmie Pass in WashingtonI-90 is a major freeway connecting Seattle with inland Washington State, though much of the route is situated in a rural setting. About 50 miles from Seattle, I-90 traverses Snoqualmie Pass, a mountain pass at 3,000 feet elevation. According to Washington State DOT (WSDOT), the Pass carries more than 10 million travelers per year. Due to the pass's unique climate, it receives huge amounts of precipitation, including an average of more than 400 inches of snow per year. The extreme weather conditions can make the Pass unsafe to drive, occasionally required road closures due to unsafe conditions or avalanche risk. In recent winters, crash-related closure of the Pass has averaged fewer than 20 hours per winter. Avalanche closures are more varied, ranging from fewer than 10 hours in 2009-2010 up to more than 100 hours in 2007-2008 and 2008-2009. In addition to winter weather issues, Snoqualmie Pass can experience congestion on summer weekends and holidays, and a long-term construction project is expected to add to delays (Rick Gifford, personal communication, February 2013). Due to unpredictable mountain pass conditions, in 2011 WSDOT began providing information to drivers on its website, smartphone app, and on travel time signs on I-90. The website (www.wsdot.com/traffic/passes/snoqualmie/) provides travel times for the 74-mile stretch of mountainous terrain as well as a color coded traffic map with live traffic cameras (see Figure 17), and additional information on current weather and road conditions, forecast, and travel restrictions. Three travel time signs (one eastbound and two westbound) provide drivers with travel times and distances to the Pass (see Figure 18). The travel times are currently calculated using data from the third-party data provider INRIX. However, WSDOT is currently installing nearly 30 radar detectors along the 74 miles surrounding the Pass that will ultimately be used to calculate travel times in place of the INRIX data. Figure 17. Snoqualmie Pass Traffic
Map Advantages of radar over INRIX data for WSDOT include data ownership, a more compatible costing structure (i.e., easier to obtain funding for purchases than ongoing payments), and overall cost savings (Rick Gifford, personal communication, February 2013). The combination of radar and probe data provides WSDOT with more precise speed data, and adds traffic volume data. According to WSDOT, "This work was funded by $800,000 of electrical preservation funds, as well as $500,000 from the I-90 Snoqualmie Pass East corridor project. The $1.3 million project replaces a 20-year-old communications system and includes the online [traffic] flow maps, travel time signs that were activated earlier this summer, and provides real-time information to drivers and our Traffic Management Center." Figure 18. Travel Time Sign Approaching Snoqualmie Pass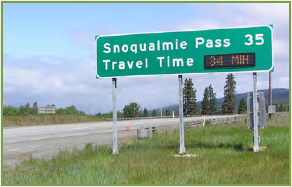 Source: wsdotblog.blogspot.com | |||||||
|
United States Department of Transportation - Federal Highway Administration |
||