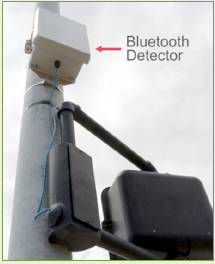
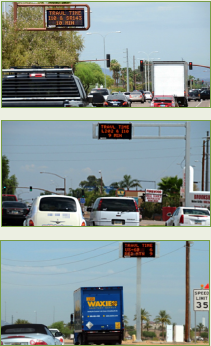
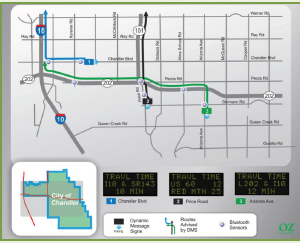
Travel Time on Arterials and Rural Highways: State-of-the-Practice Synthesis on Arterial Data Collection Technology3. Implementations of Arterial Travel Time Data CollectionThis section provides summaries of ATT data collection implementations in the United States and abroad. The implementations described were selected to represent a broad range of implementation objectives, methods, and technologies. Emphasis is placed on implementations that collect travel time data that can be leveraged in real time. Note that the first two ATT implementations addressed in this section (Chandler, AZ and St. Louis, MO) are described as detailed case studies, whereas the following implementations are described more briefly. 3.1 Case Study: Chandler, AZ3.1.1 Background and PlanningBackground The City of Chandler, Arizona has a unique implementation of ATT in which DMS on arterials approaching freeways display travel times that combine the ATT to the freeway and the freeway travel time to one or more destinations. In other words, each travel time estimate includes both the travel time to get to the freeway plus the travel time on the freeway to reach the destination. Defined Need Chandler is a city in the southeast corner of the greater Phoenix metropolitan area. Many Chandler residents commute to the adjacent cities of Phoenix, Tempe, and Mesa using a combination of arterial and freeway routes. When the City of Chandler received Federal funding to deploy DMS, the city chose to develop a travel time system that would allow the signs to provide useful information to drivers at most times of the day rather than leaving them blank most of the time. The travel time information was expected to aid drivers' en-route decision making, especially during the morning and evening rush hours. Congestion is rare at other times. Technology Selection Bluetooth detection was selected for ATT data collection largely due to the relatively low price and ease of deployment. The project was also undertaken on a compressed schedule of three months to develop and deploy equipment, and Bluetooth was seen as more feasible to deploy than other technologies, particularly given the time constraints. Before the bid process began, the city acquired one Bluetooth detection unit for testing and specification development. Preliminary testing showed that with detectors about 0.5 to 1 mile apart, match rates of about 5 to 10 percent of traffic could be achieved, which was expected to be sufficient for accurate travel time estimates during the daytime hours when traffic congestion was most likely (Ben McCawley, personal communication, January 2013). The City put out a request for quotes for a Bluetooth detection system and received three quotes. Chandler selected TPA North America, a distributor of Traffax's BluFAX system. In addition to the system's successful history of use, a major factor in this choice was long-term price: BluFAX had no recurring costs after purchase other than as-needed equipment maintenance. The system was completed and began operation in June 2011. The entire project had a budget of $400,000, including $50,000 for seven Bluetooth detectors and $40,000 for data integration. 3.1.2 Implementation and ManagementLocation Seven Bluetooth detectors were acquired and installed in traffic signal cabinets or on light poles where power and communications were available (see Figure 7), and two additional "floating" detectors were acquired that could be dynamically deployed at different locations. The Bluetooth detector locations were selected to provide travel times for three major arterial commute routes. Chandler installed three DMS on those same routes to provide arterial/ freeway travel times, each located between about one and two miles from a freeway entrance ramp. The signs are positioned to allow drivers to make route choices before entering the freeway. Each sign shows travel times from the current location to one or two destinations on the freeway. Figure 8 shows each sign in context with its default travel time message. Figure 9 shows the route covered by each DMS, as well as the default message format for each sign. Data Collection The Bluetooth detectors capture raw MAC address data, which are transmitted over City of Chandler's fiber communications network and over a secured internet connection to the BluFAX server hosted by the vendor. (The initial plan called for data to be housed on the vendor's server for the first six months after deployment so that algorithms could be refined to ideally suit the data. However, the data continue to be housed by the vendor so that the City of Chandler and TPA North America can continue to refine the algorithms.) TPA North America processes the data and raw travel times are generated and sent to the City of Chandler, where the data are encrypted and MAC addresses are replaced by random identifiers. The data are then combined with the freeway travel time data (from Arizona Department of Transportation). The travel time data are then used to update the travel time signs in near real-time, and the data are also archived by the City of Chandler in support of planning and performance monitoring. Multi-source Data and Data-sharing between Agencies A particularly interesting feature of City of Chandler's travel time system is the use of data from multiple sources. One of the three travel time signs receives all of its arterial and freeway travel time data from Bluetooth detectors. The other two signs, however, receive ATT data from Bluetooth and freeway data from loop detectors. The freeway speed and travel time data are collected by Arizona DOT as part of the Freeway Management System, whereas the arterial data are collected by the City of Chandler. Interagency cooperation has allowed Arizona DOT and the City of Chandler to share data using the Regional Archive Data System (RADS) developed by OZ Engineering. RADS is a regional ITS database system created by AZTech, an ITS consortium involving all regional agencies led by the Maricopa County Department of Transportation (MCDOT). The data can be accessed via FTP connection by a variety of regional transportation agencies and private sector companies. For this project, a system named Chandler Automated Travel Time System (CHATTS) was developed to process and fuse Bluetooth travel time with RADS freeway travel time for posting on DMS. Travel Time Calculations and Messaging The data are then merged in the Intelligent Roadway Information System (IRIS), which was also used to control DMS message display. IRIS is an open source advanced traffic management system software package originally developed by Minnesota Department of Transportation, and is made available to other organizations through the Open Source Consortium. It is available for general public use and open-source development, making it an inexpensive and customizable tool for transportation agency use. Once the arterial and freeway travel times are merged in IRIS, travel time calculations basically involve simple addition of ATT and freeway travel time to create a combined travel time. The calculations and message generation are performed automatically, though operators have the ability to override default travel time messages with custom messages. ATT messages are shown on the signs from 6:00 am to 7:00 pm, Monday through Saturday. The signs typically show only travel times, but in the case of an incident, the signs can be phased to alternate between travel times and incident information. When traffic volumes are especially light, the signs will default to show a free-flow travel time value representing segment travel time at the speed limit. Engineers initially planned for each sign to be able to show travel time information for multiple routes, but pilot testing showed that travel information for multiple freeway routes could not be easily communicated in an understandable way on DMS. Public Involvement The City of Chandler released a press release when sign construction began and another when the signs were activated. A web-based survey found that public reaction to the signs has been largely positive. Seventy-six percent of respondents agreed that the travel time information is helpful, 86% found the information easy to understand, and 88% found the travel time estimates to be accurate (City of Chandler & Oz Engineering, 2011). The survey findings suggest that even though the ATT signs do not specifically state what route the travel times are calculated for, respondents generally understood them. The accuracy of travel time estimates provided by the system has been validated only anecdotally to date. System Maintenance The City of Chandler reported that the Bluetooth detection system has been virtually maintenance free for 2 years. No Bluetooth units have failed or required maintenance, and as a result, there has been no need to implement a maintenance plan. The system is also capable of automatically alerting operators by email or text message if there is a failure or if other triggers are activated (e.g., travel time for a segment exceeds a threshold value, indicating the possibility of an incident).
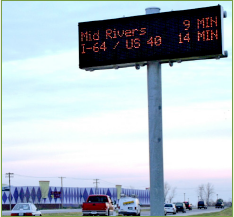
Public Relations When it was first unveiled, the Bluetooth detection system was referred to by some media outlets as a motorist tracking system. This description initially caused some public concern, but these issues were short-lived. Future PlansThe City of Chandler is seeking funding to add additional Bluetooth detection coverage. The adjacent City of Mesa is in the process of procuring Bluetooth detection for a citywide implementation that will include the use of six DMS. Pending the completion of the Mesa project, Chandler may consider its own citywide installation, which could provide seamless travel time data for both cities. 3.1.3 Lessons LearnedAdvantages of Open-source Software The City of Chandler opted to use the open source IRIS software as part of the system for automatic posting of travel times on the DMS. The project team found that this approach provided many benefits. First, it saved two to three months of software development time, which led to significant cost savings. Second, features can be customized without the need for advanced coding skills, allowing implementers to adapt the software to their needs rather than being tied to a software package provided by a product vendor. Finally, in the case of IRIS, the software is well documented and was developed and maintained by a reputable agency (Guerra, 2012). Conduct Preliminary Tests with the Preferred Technology For the City of Chandler, preliminary testing was invaluable in understanding how Bluetooth detection works and what the key implementation considerations are. This testing helped Chandler to better understand the capabilities and limitations of the technology and allowed the City to clearly specify functional requirements in its request for quote (RFQ) and vet responses to the RFQ. Weigh Options Provided by Multiple Product Vendors In the case of Bluetooth detection, there are multiple vendors whose detector packages provide similar capabilities. However, there are notable differences in aspects of services offered and pricing. Some vendors charge ongoing fees for data provision while others charge only an initial outlay for equipment. Vendors also offer different software for data processing and visualization, as well as different degrees of customization and cooperation. Bluetooth Travel Time is an Inexpensive Way to Add Value to Existing DMS The City of Chandler estimates that the cost of a Bluetooth detector is about 5 percent of the cost of a typical arterial DMS. Therefore, Bluetooth travel time systems can be a relatively inexpensive way to generate useful information to present to drivers on DMS. Limit Exposure to System Failures Chandler's travel time data are currently processed by the product vendor on servers far from the Chandler region. If the vendor's servers were to go down due to power loss or other failures, Chandler's travel time system would not be able to function properly. Ben McCawley at the City of Chandler notes that it would be hard to explain to the public in Chandler that the travel time system is down because of a major storm on the east coast. By keeping data processing local or by having backup servers, agencies can limit their exposure to system failure. Consider Additional Uses of Data Bluetooth detectors provide data that can be used for many purposes other than generating travel times. The City of Chandler intends to use historical data to understand travel trends, including the effects of seasonal residency in the region. Chandler also intends to use the data for origin-destination study, and may expand its Bluetooth coverage in the city to provide a more complete picture of traffic patterns. Make Data Easily Available to Partners Chandler makes its travel time data available to public and private entities that want to use it. By eliminating barriers to sharing, Chandler's travel time data can be made available to travelers via a wider variety of outlets. Engage Media Outlets When the Bluetooth detection system was unveiled in Chandler, some media outlets referred to it as a "tracking" system, which caused some public concern. By engaging with media outlets early and describing the system and privacy controls, an agency can minimize the likelihood of misleading media stories. 3.2 Case Study: St. Louis, MO3.2.1 Background and PlanningDefined Need By 2009, Missouri Department of Transportation (MoDOT) had completed instrumenting urban freeways in the St. Louis area for travel time using sidefire radar and felt that the next logical step was to expand travel time coverage to arterial roads. Travel time technology in the area serves two primary purposes: travel time dissemination to the public and data collection for internal purposes (e.g., volume, speed, and occupancy). Technology Selection MoDOT contracted Sensys Networks to provide its travel time data using its in-pavement magnetometer technology (see Section 2.3). At the time, Bluetooth device saturation rates were not considered to be sufficiently high and MoDOT was not convinced of its efficacy for an arterial network under these conditions. The Sensys system, however, provided nearly 100 percent detection rates and a high vehicle match rate of about 30 to 40 percent. MoDOT's investigation of available technologies convinced them that the magnetometer system was the best technology for their needs, so the project was sole sourced to Sensys without soliciting other bids. The Sensys system was more expensive than alternatives such as Bluetooth, but the system was considered a "fairly deluxe solution" that offered benefits in terms of high vehicle detection and match rates that allowed the system to work well with in the arterial environment, along with the ability to collect a full range of data (volume, spot speed, occupancy, and classification). The relatively high cost of the Sensys system is attributed to the technology itself (i.e., five sensors per travel time array, sensors for data collection, repeaters, and access points) system integration costs, and the ongoing services provided by Sensys. 3.2.2 Implementation and ManagementLocation The MoDOT ATT system provides coverage on 15 arterial corridors, with a total of more than 130 instrumented miles of roadway. MoDOT considers its Sensys deployment virtually complete because the only uninstrumented arterial corridors are too minor to justify sensor deployment. Installation Sensys sensors are installed in the pavement in arrays of five "pucks" aligned perpendicular to the direction of travel. Although installation requires lane closures and a truck-mounted core drill, installation is relatively quick; an array can be installed in 30 minutes. Sensys initially expected that each array would require only three sensors per array, but revised their practice when a new processing algorithm was implemented. This change came late in the design phase and nearly derailed the project due to the extra cost and labor involved, though MoDOT ultimately was able to accommodate the change by cutting back on other costs. Because each array of five sensors is tasked towards the sole purpose of vehicle identification, MoDOT uses additional sensors placed near the travel time arrays to collect other data (volume, speed, occupancy). This approach provides a more complete picture of traffic conditions to MoDOT than travel time alone, and allows data to be more effectively used to study travel patterns for a variety of purposes. Raw data from the wireless sensors are collected by an "access point." At sites where the access point cannot be installed within wireless range, additional repeaters are required. From the access point, data are sent to the Sensys server at the MoDOT TMC, which uses vehicle matches to generate travel times. The refined data are then streamed to MoDOT's ATMS for live travel time display and data collection/reporting. Sensor Locations Sensor arrays were installed approximately every 1 to 1.25 miles at most arterial locations, though some were placed closer together near busy interchanges where complicated traffic patterns could potentially reduce match rates. Arrays were only installed in the far left-hand lane because the left lane carries the highest proportion of through traffic and is least influenced by the effects of vehicles entering and exiting the road. Installation locations were selected by Sensys based on their experience in setting up travel time systems.
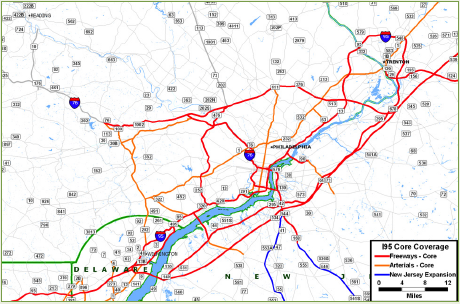
Data Integration MoDOT currently uses sidefire radar as its primary means of collecting freeway travel time data, with Bluetooth sensors soon to enhance travel time reporting through freeway interchanges. Because MoDOT is responsible for both freeways and most major arterials in the St. Louis area, the process of data integration is simplified due to a lack of institutional barriers, and all travel time data can be integrated in MoDOT's advanced traffic management system (ATMS). Data Visualization and Dissemination With the refined data, MoDOT is able to visualize travel time data as a layer on a Google Map and send the data out for display on an arterial DMS. Although the travel time data provided by Sensys are sufficient for dissemination, the usefulness of the data in its basic output format requires additional manipulation to serve other purposes. For example, to compare one arterial corridor to another, MoDOT uses its own ATMS to sort through the Sensys data and reformat it to better suit their needs. Arterial DMS Practice ATT displays are positioned before key diversion routes and are intended to help drivers decide whether to travel on the freeway or take an arterial route. To avoid any problems that might arise from drivers trying to read the DMS rather than focusing on a traffic light, signs were installed at least 500 feet from signalized intersections. They were also positioned to allow a 750 foot sight distance. Most of the ATT signs display only arterial travel times. Some mix freeway and ATT information. Others display only freeway travel times because, near the terminus of some arterial roads, few destinations besides the freeway are available. Most signs are capable of displaying three lines of text and are formatted as in Figure 10. Figure 11 shows an ATT sign along an arterial road. During peak hours, travel time is updated approximately once every minute. When there is less traffic during off-peak hours, travel time is updated less frequently, with a maximum of once every 5 minutes. The signs are operated from 5 am to 10 pm. The signs are turned off overnight to prevent drivers from becoming desensitized to the information due to exposure at times when congestion does not occur. By not disseminating travel times during the overnight hours, MoDOT also limits concerns about insufficient traffic volumes leading to incomplete travel time data. Because some signs are within view of residential areas, it was also seen as a courtesy to residents to turn the signs off outside of peak hours. Responsibilities of Vendor MoDOT left most of the travel time system design decisions up to Sensys because they had the expertise and experience. Once the system was online and producing data, MoDOT still had many questions for Sensys and requested changes to the data processing algorithms as unusual outputs were detected. MoDOT had to continuously work with Sensys to modify and adjust algorithms to account for lower than expected speeds. System Maintenance This installation does not lend itself to extensive maintenance. In the words of one MoDOT representative, "There is no field work to be done other than plopping the sensors into the pavement." The wireless sensors, however, do need to be replaced every 7-8 years when the batteries run out of power. The system also presents issues if the roadway needs to be repaved. If any of the arterial corridors were simply repaved (without removing the sensors first), MoDOT would lose the ability to find the sensors later. If repaving is necessary, MoDOT recommends first removing the wireless sensors and filling the resulting holes with epoxy. To re-install the wireless sensors, the same process would need to be repeated: the holes would be re-drilled and the sensors placed in those holes and again secured with epoxy. Future Plans MoDOT has provided nearly complete coverage on its urban freeways and major arterial roads, and does not foresee any significant changes to this implementation in the near future. The current focus is on expanding freeway coverage on Interstates. MoDOT does not yet have any plans for when the Sensys sensors reach the end of their battery life, which could begin to occur in about 6 years. 3.2.3 Lessons LearnedIf possible, deploy the travel time system slowly. Although it took years for MoDOT to deploy its entire ATT system, portions of the system were often instrumented and brought online quickly, as funding became available. In retrospect, MoDOT suggests deploying the travel time more incrementally to allow time to identify issues and "fine-tune" the system (Gregory Owens, personal communication, October, 2012) Use Observation and Experience to Verify the Travel Times Provided As mentioned above, MoDOT noticed some oddities and below-average speeds in its arterial data. MoDOT has had to work with Sensys to tweak the processing algorithms on an ongoing basis. Keep Accurate, Up-To-Date Records MoDOT did not keep detailed records of sensor deployments, in part because the ITS project expanded so quickly. These records are especially important so that MoDOT does not lose sensors to repaving or other construction efforts. Although Sensys Networks does have a log of the exact location of each sensor, this data has to be made available to MoDOT. Seamless Integration Offers Significant Benefits MoDOT is responsible for "major roadways" in Missouri, including freeways and most of the major arterials. For this reason, the integration of arterial and freeway travel time deployments and other systems was seamless, without any institutional barriers. Involve the Public in Issues Relevant to Them MoDOT received some complaints from the public due to dissatisfaction with DMS located near residential neighborhoods being seen as eyesores, especially due to their height and bright lights after dark (Tyson King, personal communication, October 2011). Public involvement early in the process could have helped to place DMS in more acceptable locations. 3.3 I-95 Corridor CoalitionThe I-95 Corridor Coalition is a multi-State and multi-jurisdictional organization that functions to improve transportation system performance through coordinated effort. The Coalition serves I-95, which runs from Maine to Florida, passing through 16 States along the east coast. Its members include State and local transportation authorities, toll authorities, and various other organizations (e.g., Amtrak). In 2008, the Coalition launched its Vehicle Probe Project, a public-private partnership with the University of Maryland and INRIX. The purpose of the project was to create a traffic monitoring system that could be shared amongst members, seamlessly, and at low cost. Using third-party data from INRIX, the project provides travel time and speed data on a network of freeways and arterials along the I-95 corridor. INRIX "fuses" data from a variety of travel information sources including GPS probe data and traffic sensors using their proprietary software and algorithms to generate travel time data. Arterial coverage was included in the project primarily for support purposes. The covered arterials link major freeways and metropolitan areas, and they may serve as alternate routes in the case of significant freeway congestion. Although the original contract detailed plans for data on 1500 centerline miles of freeways and roughly 1000 miles of arterials, the project has since been expanded. Table 4 shows the project's current coverage by State. This data has been used for the dissemination of travel information on 511 phone lines and websites, as well as on DMS (in Maryland, Virginia, and South Carolina only). According to information on the project's webpage, "The network includes full coverage of freeways and major arterials in North Carolina and the Tidewater area of Virginia, full or nearly full coverage of limited access roads in New Jersey, Maryland and South Carolina and the northern and eastern portions of Florida." Figure 12 shows the freeway and arterial coverage (as built) in Philadelphia, PA.
Early evaluations of the INRIX data revealed the following distinct challenges of collecting travel time data on arterial roads (Young, 2010): Defining and Observing Congestion Whereas freeway conditions can be fairly easily determined by travel speed, each arterial segment is likely to have a different "free flow" speed depending on signal timing and intersection operations, which can also vary through the day. As a result, congestion is relatively difficult to identify. Variations in Flow Within Arterials As a result of traffic signal operations, arterial roads are likely to exhibit high variation in travel times between vehicles. These variations often express themselves as bi-modal travel time distributions, where two different travel time clusters appear as a result of vehicle platoons spending different amounts of time stopped at traffic signals. Temporal Reporting Requirements The highly variable travel times on arterials, in addition to relatively low traffic volumes, makes average travel time more difficult to characterize over a short period of time. Longer time periods of 10 to 15 minutes may be needed to characterize average travel time on arterials, whereas 5-minute periods are sufficient for freeway travel times. Figure 12. Freeway and Arterial Coverage
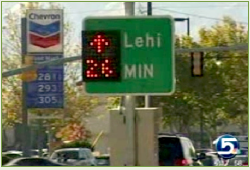
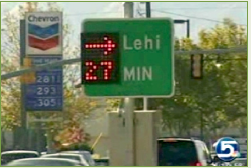
(as Built) in Philadelphia, PA 3.4 Utah County, UT, I-15I-15 is the major north-south interstate in Utah, passing through Salt Lake City and Provo. As Utah DOT prepared to begin a major 2-year expansion of 24 miles of I-15 (the I-15 CORE project) in Utah County, solutions were sought to help ease the congestion expected as a result of the road work. The construction contractor partnered with TransCore to develop a system to provide travel time signs on arterial roads informing drivers of the travel times on I-15 as well as the travel times on a parallel arterial road, allowing drivers to choose the route that is best for them. TransCore developed a system using in-pavement magnetic sensors from Sensys (see Section 2.3). Sensors were installed in Utah County on State Street, a major arterial road that runs parallel to I-15. The sensors provide updated travel times every 2 minutes to TransCore's data analysis software, and updated travel times are displayed every 6 minutes on arterial-located travel time signs. Data are also automatically routed to the Utah CommuterLink website so that travelers can use the information for trip planning (TransCore, 2011). Although the system was developed to ease construction-related traffic, it was also intended to remain in place after construction was completed. Eight ATT signs were installed on westbound approaches to State Street so drivers can see the travel time information, then choose whether continue straight toward I-15 or turn right to drive north on State Street instead. The signs, known as trailblazers, are static signs with a dynamic component on the left side of the sign. The static portion of the sign states the destination (i.e., the city of Lehi, which is a northbound destination). The dynamic portion of the sign is a two phased element that shows travel times to the destination via two routes: Remain on current westbound route toward I-15 North (arrow points up) or turn right to take State Street north (arrow points right). Each phase of the sign is shown for 3 seconds. An example of trailblazer sign operation is shown in Figure 13. According to Sensys, the design, construction, and software development for the system took 6 months and its implementation led to a significant decrease in delays, congestion, confusion, and collisions (Sensys, n.d.). Figure 13. Both Phases of a Trailblazer
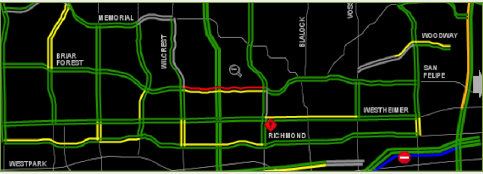
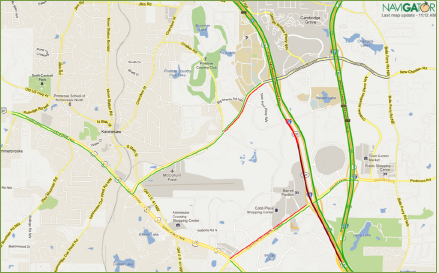
Sign 3.5 Houston, TX, Multiple RoutesHouston TranStar had used toll tag readers as a source of freeway travel time for a number of years, but switched to Bluetooth detectors for a 2011 arterial implementation due to the relative cost savings: Bluetooth detection was estimated to cost nearly half the price of toll tag readers (City of Houston, 2011). Initial investigations found that, on a freeway, Bluetooth detectors and toll tag readers achieved comparable detection and matching rates (Texas Transportation Institute, n.d.). The City of Houston initially installed six Bluetooth detectors at major intersections using funding for demonstration of ITS technology. This arrangement allowed travel times to be calculated on seven roadway segments spread across five roads, covering a total of 16 directional miles (Puckett & Vickich, 2010). This demonstration showed that ATT could be successfully captured on an urban arterial network. Following this successful deployment, additional Bluetooth detectors were deployed in the area, bringing the total to approximately 50 Bluetooth detectors in a 62-square mile section of West Houston that carries an estimated 12.7 million vehicle miles per day. Detectors were placed at major intersections with distances between sensors ranging from about 0.5 mile to 1 mile (0.8 to 1.6 kilometers). Houston TranStar communicates traffic information via an online map, which can be viewed at: traffic.houstontranstar.org/layers/layers.aspx?mapname=houston_west&inc=true&rc=true. A screenshot of the section of the map showing the arterial traffic conditions is shown in Figure 14. In addition to seeing color coded traffic speeds, users can click on a road segment to see the current average speed for that segment, view incident reports, and view live traffic cameras. The City of Houston expects to expand the Bluetooth detection system to include pan-tilt-zoom cameras and DMS, and to include other areas of Houston.
3.6 Flagstaff, AZ, US-180US-180 near Flagstaff, AZ, is a major route to area ski resorts and was experiencing significant congestion from traffic going to and from the resort areas. The Flagstaff Metropolitan Planning Organization (FMPO) considered a variety of approaches to ease congestion. One of the potential approaches was developing a traveler information system that could provide travel times and other information (e.g., alternate route guidance) to motorists. To explore the feasibility of this approach, 16 Bluetooth detection units were deployed along a six-mile length of US-180 and alternate routes. The units used for this evaluation were portable suitcase-type devices powered by internal batteries provided by Traffax, which was selected by Flagstaff in a noncompetitive process. Each sensor included a cellular modem to upload data to the vendor. Data were processed by Traffax servers and then made available to the project team in Arizona via a Traffax web portal. Travel time data were not made available to the public during the feasibility study. The study found that travel times were generated successfully for most segments at most times, but that for any given 15-minute period of time, data for the entire instrumented length of road had at least one segment for which data were missing or spurious. Low traffic volumes and low match rates led to an . additional difficulty related to filtering outlier data. With few matches in each 15-minute period, the system could not establish a statistically adequate median travel time to be capable of effectively identifying and filtering outlier data. This problem is especially significant in an arterial environment where many vehicles may leave the flow of traffic (e.g., stop at a shopping center) between Bluetooth detection locations. When the system was not effectively filtering outliers, it also made it more difficult to use to travel time data for incident detection, because spuriously long travel time estimates were occasionally recorded. The results suggested a need to select Bluetooth sensor locations that would allow high match rates and implement travel time algorithms that can accommodate low match rates (e.g., by applying more site-specific filtering and using free-flow speed as a plug value when data are inadequate). In retrospect, the implementing agency felt that more thorough planning before deployment, testing detectors in situ in advance to ensure adequate match rates, and more direct control over travel time algorithms (including outlier filtering) could have led to a more successful implementation (Edward Smaglik, personal communication, October 2012). Another lesson learned was related to the sensors themselves. Because the sensors were portable, they relied on cellular communications for data upload. Cellular signal for the selected carrier was unreliable in the study area, so the sensors' cellular modems were often searching for signal, and as a result, sensor battery life was significantly shorter than anticipated (Edward Smaglik, personal communication, October 2012). 3.7 Atlanta Area, GACobb County is a suburban county northwest of Atlanta. I-75 is a major Interstate passing through Cobb County to Atlanta. The I-75 corridor often experiences congestion as a result of commuter traffic going to and from the Atlanta area. When I-75 experiences heavy congestion, surrounding arterials often experience congestion as drivers seek alternate routes. Since 2003, Georgia DOT (GDOT) has provided I-75 travel times to the public on freeway DMS and its traffic website (www.511ga.org). There are also four arterial DMS showing I-75 travel times on approaches to I-75 to allow drivers to determine whether to take I-75 or an arterial route. As part of an integrated corridor management initiative, GDOT has recently expanded its travel time system to include travel times for arterial routes themselves. As of July 2012, Bluetooth detection was implemented on select routes in Cobb County (pictured in Figure 15) and Fulton County. Using TrafficCast's BlueTOAD system, 19 sensors were deployed on arterials in Cobb County; 12 sensors were deployed on arterials in Fulton County, and an additional 4 sensors were deployed in the City of Alpharetta (ARCADIS, 2012). GDOT uses the ATT data to monitor the roadway network for incidents and to determine the effects of heavy I-75 congestion on surrounding arterials. Historical data from the sensors has also helped GDOT to evaluate the performance of its adaptive signal system (TrafficCast, 2012). The arterial travel conditions are shown on a color coded map on GDOT's website, but not on DMS, though GDOT has considered developing DMS signs to present ATT to motorists.
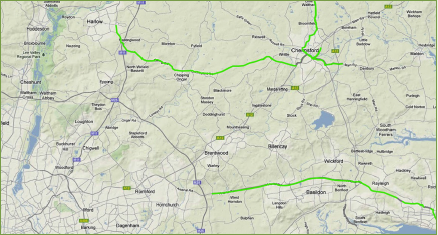
3.8 Essex County, United KingdomThe county of Essex is located to the northeast of London and is within the "London Commuter Belt." Within Essex, travel time data are collected on two interurban arterial routes: from Chelmsford to Harlow and the M11 motorway (A414) and from Basildon and Southend-on-Sea (A127) to the M25 motorway (see Figure 16). Both motorways are used to commute to London.
To collect travel time data on these two inter-urban routes, the Essex Traffic Control Centre (TCC) uses ALPR, as part of the Comet system provided by Siemens. ALPR is a very well known technology in the area; a huge implementation of ALPR is used in London to conduct automatic tolling and perform security tasks. In Essex, more than 80 ALPR cameras are installed on the arterial roads. One of the most significant challenges reported by the Essex TCC was balancing the need to position cameras to achieve high point-to-point vehicle match rates, while also minimizing overall camera deployment to keep program costs down. Experience showed that achieving high match rates was relatively easy on the interurban arterials because most traffic stays on the road for the full interurban segment. However, matches were much harder to achieve on urban arterials due to the more complex traffic patterns. Where traffic patterns are predictable and match rates are high, ALPR generally only monitors one lane of traffic. Where traffic patterns are less predictable or match rates are low, cameras may observe multiple lanes. The single-lane monitoring approach, however, tended to bias travel time estimates on interurban arterials because heavy trucks were overrepresented in the monitored lane, causing travel times to reflect relatively slow truck speeds. The Essex TCC notes that even with this bias, incidents and congestion can still be easily detected. As noted on the previous page, travel times were more difficult to calculate on urban arterials than on interurban arterials due to complex traffic patterns. These challenges were compounded by the sites selected for ALPR camera installation. Sites were selected largely on the basis of convenience (e.g., where space and power were available), but were not compatible with drivers' actual traffic patterns. As a result, about one-third of segments provided accurate travel times, one-third provided acceptable data only at peak traffic volume times, and one-third provided no useable data.Travel times from the Essex deployment are available to the public through the Essex Traveler Information website (emerge.essexcc.gov.uk), in both map and text format, and on area DMS. Authorities are considering expanding the travel time coverage to other roadways and providing comparative travel times via multiple routes. Lessons learned in this implementation include:
| |||||||||||||||||||||||||||||||||||||||||||||||||||||||||||||||||||||||
|
United States Department of Transportation - Federal Highway Administration |
||