Traffic Analysis Toolbox Volume XIV: Guidebook on the Utilization of Dynamic Traffic Assignment in Modeling
5.0 Data Requirements
Data requirements for DTA modeling are similar to data needs for microsimulation modeling. Traffic Analysis Toolbox Volume III is a good resource for data requirements. As described in Volume III, three types of data are required for network development: Geometric Data, Control Data, and Demand Data. Additionally, data are needed for both calibration and validation, including travel times and queue length observations data. For more information on calibration and validation data refer to Chapters 7 and 8 of this document.
Other data considerations in DTA modeling include an increased emphasis on collecting data over multiple days and collecting travel time information over optional routes.
Collecting data over multiple days. Data collected over a number of days will help identify variability in the system. Without multiple days of data, there is no meaningful way to evaluate the results of a DTA model. Figure 5.1 illustrates the variability in speed data. (Note: the median values are shown for illustrative purposes and for assisting in identifying a typical day. It is not recommended that averaged data be modeled.)
Figure 5.1 Variability in Spot Speeds at a Freeway Location
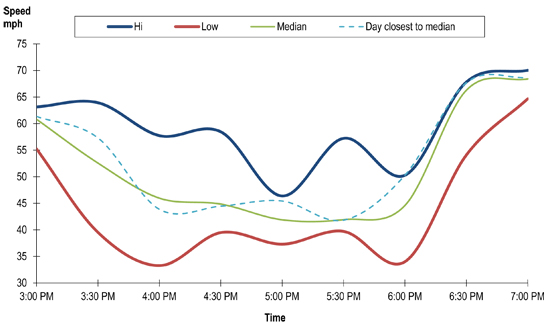
Source: MNDOT TMC detector surveillance from data extract program.
Collecting Travel Time Information. Collecting travel times via probe vehicle data provides important information for understanding route choice decisions within DTA models. Calibrating the model and ensuring the route choices make sense is at the core of DTA. Field data for possible and likely alternative routes should be collected. Figure 5.2 is an illustration of a corridor where the traveler has three viable routes to the same destination. Travel time data on these three routes can help establish whether model links are congested, which in turn affects the travel time of one or more paths, which in turn affects route choice.
Figure 5.2 Route Choice Data
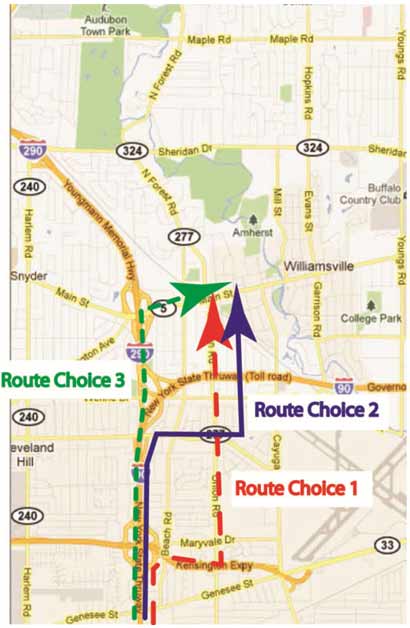
Source: Cambridge Systematics, Inc., ©2012 Google.
5.1 Data For Network Development
Geometric Data
The transportation network is a major component of any transportation model, and it must be accurately portrayed as it exists in the field. While the exact nature of these data may vary depending on the modeling platform being used, the model must include basic information about the facilities themselves and how they operate. Such data can include roadway geometrics (basic alignment and curvatures), number of lanes, turning bay locations and lengths, lane alignments and turning lane configurations at intersections and interchanges, acceleration and deceleration lanes, lengths of on- and off-ramps, free-flow operating speeds, grades, vehicle specific lane usage (e.g., transit-only or HOV lanes), and other such information.
Other dynamic network elements also may need to be coded into the model, including time-of-day changes to available travel lanes (such as reversible lanes or peak hour parking bans), time-of-day turn bans, or time-of-day lane restrictions (e.g., bus lanes), depending on the time periods the model will be built to simulate.
Several sources are available for the collection of geometric information, as outlined in the remainder of this section. Often, field visits are needed to fill in the gaps in the data from existing sources.
- GIS Databases. Existing GIS databases may be leveraged to build the base structure of the network if none exists. While many public agencies have GIS databases of roadway networks maintained to a high level of geographic accuracy, their utility in developing a transportation model network may be an issue, as these databases were not constructed with transportation as a focus. In such non-transportation-oriented GIS databases, roadway segments are often not coded to the beginning and end of an intersection, and sometimes the connectivity is incorrect. In addition, many requisite attributes, such as operating speed or even number of lanes, are not included in such databases. Alternatively, commercial databases may be used to build the basis of the roadway network, and other attributes can be added as needed.
- Existing Models. Existing regional Travel Demand Models are a common source for developing the network for a DTA model. These demand models often lack the details required to create a successful DTA model (e.g., “stick” networks without interchange ramp details, missing intersection details, lower classification roadways omitted), however. Also, existing operations models or analyses (either microsimulation models or operational studies) may be used to get details for building the DTA model network.
- Aerial and Ground-Level Photography. Whether purchased, acquired from public agencies, or obtained free on-line, aerial photography is a good resource in developing the network for a DTA model. While varying levels of detail are available in different geographic locations, often imagery is clear enough to see lane-level details that are needed in a DTA model network. Examining the pavement on detailed aerial photography will provide additional information regarding vehicle behavior and typical movements at that location (e.g., uneven wear on paint, oil stain patterns). Ground-level photography is another good resource for quickly taking a “virtual field visit” to verify lanes, turn configurations, signal operations, and roadway signage. When using either aerial or ground-level photography, especially that obtained from free on-line resources, care should be taken regarding the date on which the image was taken versus the date the other data was collected.
Control Data
A required data component that is often difficult to acquire for DTA models is traffic control data. As traffic signals are often the bottleneck points on an arterial roadway, signal plans are essential in properly modeling the arterial. Locations of stop signs and yield signs are also needed. If present, the location of ramp meters also must be determined, along with the details of the metering (e.g., HOV/transit bypass lanes, number of metered lanes, metering rate or algorithm, etc.).
For signal-controlled intersections, the level of detail required varies by model platform, but the full phasing and timing plans are often needed, including any time-of-day changes and actuation details. Incorporating signal coordination is critical to DTA modeling to ensure proper simulation of capacity and travel time on arterial roadways. Finally, any impacts of advanced signal controller technologies (transit signal priority, adaptive signal controls or algorithms) on the operations of the signals should be assessed and incorporated in the DTA model as appropriate.
Data sources to gather control data are often limited to the agency or jurisdiction operating the control devices. Sometimes agencies will have an electronic database of signal control data that can be read and reformatted into the format required by the DTA modeling platform. Often, however, the data will not be in a usable electronic format, and it may need to be manually coded into the model.
Sometimes the data is outdated or missing from any database. Missing control data can be recreated through field observations or local knowledge or synthesized using software. Such software typically examines the functional class of the intersecting roadways and applies a phasing template; it may then use traffic counts or simulated flows to estimate timing splits between the phases. Whether control data are estimated by the analysis team or by using software, the resulting operations of the roadways (including turn capacity, simulated speeds, travel times, and/or queues on the roadways) should be compared to available data and field observations to ensure the realism of the assumed control plans.
Demand Data
For DTA modeling, estimating the demand is of critical importance. This includes estimating not only the origin and destination patterns, but also the temporal distribution of the demand data. One common method for gathering O-D data is to collect point-based volume data and apply an estimate of the origin and destination data from models or surveys.
Volumes
Robust traffic volume data is an essential input to the development of any transportation model. While the fidelity of different types of DTA can affect the fidelity of the volume data needed, the general assumption is that the volume data collected should be as disaggregated as the model outputs to which they will be compared. Usually this threshold is set at the 15-minute level. Using larger time periods of volume data (e.g., peak-period or AADT volumes) is not recommended, as the potential for error is introduced in the development of disaggregation factors. If possible, data also should be collected by vehicle class and by vehicle occupancy, especially if trucks or HOV vehicles have different route choice options, such as truck restrictions or HOV lanes. Ultimately, the project scope and analysis of historical data should be used to determine the temporal resolution for volume data.
Collecting traffic counts over a number of days is an important component as well. In addition to basic counts, it is important to identify a number of qualifiers to the data to allow the impact and influence of inclement weather or incidents to be included. Being aware of the actual conditions in the field for the period when the data were collected is necessary in order to assess the impacts on route choice as modeled by the DTA model.
In addition to the disaggregate nature of the volume data needed, the variability of the volume data must be addressed. Enough data should be collected to show the variability of volume under different circumstances (incident conditions, inclement weather, day-to-day or seasonal demand fluctuations, etc.). This is especially important if the model is expected to be used to help analyze atypical conditions, such as incident scenarios.
Sources for the collection of volume data ideally will include existing permanent count stations or instrumented roadways which allow for the comparison of multiple days of data across multiple points in the network. Such collection allows the comparison of weeks, months, or an entire year of data, and the data can be filtered against days known to have inclement weather, major incident impacts, or unusual demand days, seasonal impacts, or special events. This also allows for the compilation of a single “typical” day’s volume for the model calibration from all count locations.
It is good practice to develop a data collection plan prior to collecting the required data. The plan should include multiple days of data. Determining the number of days for data collection will require statistical analysis of historical data. Considerations of the actual range in data values and the targeted confidence that is desired for the project should factor into the analysis.
Since it may not be possible to have all the desired data collected at one time for all locations, it may be necessary to synthesize counts into one data set. Consistency between data from different days must be considered.
After the data are collected and assembled, the consistency of the data should be reviewed. Major discrepancies that cannot be explained by queued vehicles on the roadway, or traffic sources and sinks such as connecting roadways, parking lots, or driveways between the count locations, should be identified, then investigated for error and addressed through volume balancing or suspect count exclusion. These discrepancies and the methods utilized to resolve them should be documented.
Origin-Destination Data
O-D data are impossible to observe for an entire population or large study area, and instead must be sampled and estimated. Given the complexities of estimating the O-Ds, the DTA model will usually need to rely on the estimates of the O-D data or subarea analysis using a regional Travel Demand Model for a validated base year. In such cases, the temporal limits must be determined and the appropriate “time-slicing factors” developed to split the peak-period demands into the individual 5-minute or 15-minute periods required by the DTA model. While these factors may be developed from counts, care should be taken to estimate the true demand by time slice and not the capacity constrained throughput measured by volumes in congested conditions.
Other data sources for estimating or sampling O-D data may be useful for the calibration of the DTA model. These include random roadside probe vehicle methods (license plate recognition studies, Bluetooth readers, electronic toll collection transponder readers, etc.) Alternative methods include aerial surveillance (usually only practical for smaller areas) or the purchase of such data from wireless phone providers or other commercial vendors.
Transit Demand
Transit demand information can be collected from transit providers. The typical types of information are published bus routes, stops, and time tables. This information can typically be obtained in printed or electronic form from the transit provider. Also required is boarding and alighting information from stops.
5.2 Data For Model Calibration
Data required for model calibration include measures of effectiveness that can be quantified in the field and produced from model outputs. This type of data includes the following:
- Travel times;
- Travel speeds;
- Traffic counts (including temporal peaking);
- Lane utilization;
- Probe vehicle data;
- Number of queued vehicles;
- Number of stops;
- Observed congestion locations and extent of congestion; and
- Transit operations.
5.3 Preparing a Data Collection Plan
A good practice in conducting any modeling project is the preparation of a Data Collection Plan. The following discussion outlines an approach and work steps in collecting data. Specific steps in the development of the Data Collection Plan include the following:
- Research and Identify Available Data for the Study Area. Existing data sources and data requirements should be researched to identify the quantity and quality of available data for the analysis area. The Data Collection Plan also should identify those individuals/stakeholders responsible for compiling the data. The analysis manager should work closely with stakeholders in compiling the data. If possible, the analysis manager should obtain samples of the datasets prior to full collection to view the content and format of the data and adjust collection plans as necessary.
- Establish Sample Size Requirements. Information regarding the variability of historic data should be used to establish the maximum sampling error to be tolerated by the analysis.
- Identify Gaps and Recommend an Approach to Filling Them. Once available data sources have been investigated and dataset samples reviewed, the analysis manager should assess the appropriateness of the available data for use in the analysis and identify any critical gaps in data availability. Potential approaches to filling data gaps should be investigated and recommended approaches should be documented in the Data Collection Plan.
- Identify Data Management Strategies. In this step, procedures for conducting data quality control and project data archiving should be identified. Any required thresholds for minimum data quality should be identified, as should high-level descriptions of processes for addressing data shortcomings. Plans for archiving the data also should be identified. Responsibilities for data quality testing and data archiving should be clearly defined.
- Develop Data Collection Plan. The Data Collection Plan is a document that outlines the types of data needed, the sources of available data, and the methods for collecting any additional data. This plan, typically prepared for an agency and stakeholders to approve, should contain budget and schedule estimates.
Once the Data Collection Plan is developed, the required data should be collected in accordance with the plan. Generally, implementing the plan will involve the following activities:
- Assemble/Collect Data on Physical Infrastructure and Geometrics. Much of these data are likely to be available in existing models and regional geographic information systems (GIS).
- Assemble/Collect Existing Traffic Performance Data within the Study Area.
- Gather Available Information from Existing Studies. These studies include those currently underway as well as those that have been recently completed. Example studies include existing conditions analyses, environmental impact studies, and lists of projects and strategies that have been planned or programmed.
- Conduct Field Reviews within the Study Area.
- Collect New Data as Specified in the Data Collection Plan. All data collected in this effort should be analyzed and archived according to the data management procedures documented in the Data Collection Plan. Any identified problems with data quality or the successful archiving of data should be immediately communicated to the analysis managers.
The Integrated Corridor Management Analysis Modeling and Simulation Guide postulates that 10 to 20 percent of the overall study budget should be allocated to developing the data collection plan and to assembling/collecting data.
You may need the Adobe® Reader® to view the PDFs on this page.