Measuring Border Delay and Crossing Times at the US–Mexico Border
Final Report
Automated Crossing and Wait Time Measurement
CHAPTER 6: BOTA CROSSING AND WAIT TIME DATA ANALYSIS
Data Collection and Analysis Period
This information will be presented in two sections: (1) unmatched tag reads with analysis, and (2) matched tag reads with analysis. Unmatched tag reads are the total number of tag IDs detected by a RFID reader station within a certain period (e.g., a day or month of operation), regardless of whether they were detected by other reader stations in the system during that same period. For measuring US-bound truck crossing time on this project, there were two reader stations initially: R1 on the Mexico side and R3 on the US side. On April 13, 2012, installation of three additional RFID readers (designated as R2A, R2B, and R2C) was completed to collect wait time data from readings at the CBP primary inspection lanes. Graphs for data collected by each reader location are portrayed as Mexico side or US side. Some tags were not readable for various reasons, which resulted in a smaller number of unmatched tag readings for either side of the border compared to the total volume of truck crossings for the same period reported by government POE operators.
For crossing time measurement, matched tag reads for the system at BOTA are the total number of tag IDs that were detected at R3 after having been previously detected at R1 within a certain buffer period. This period, which was generally set at 120 minutes, is adjustable. The buffer period is necessary so that trucks detained in secondary inspection for a long time and trucks that make multiple trips in which they are missed by a reader during a trip, do not cause the average crossing time to be longer than is representative of the operation. The matched tag read numbers are also known as the sample size.
The number of matched tag reads during a certain period will typically be lower than the unmatched tag reads for either side of the border. That is because of factors such as trucks that divert and do not cross the border after crossing R1 and trucks held in the Mexican Export Lot or CBP secondary inspection or BSIF for long periods before crossing R3. The capture rate in this report is a term expressed as a percentage in two different ways. In the data it is based on the following: (1) the number of matched tags divided by the total number of tags read on the US side, and (2) the number of matched tags divided by the total US-bound traffic volume as reported by a government source.
Events both external and internal to the system occurred during this pilot implementation that affected the tag reads. The analysis includes an explanation of what root causes were known to have brought about an anomaly, or if not conclusively proven, speculation as to the root cause.
Unmatched Tag Reads
A central database server housed at an El Paso office receives tag identification data from the field RFID readers. In addition to the algorithms used to measure crossing times, the database contains a separate table to store highly detailed information from which the number of transponders read each day on both sides of the border can be retrieved.
One key objective in analyzing the daily transponder count is to understand the trend of commercial vehicle traffic flow during normal times, planned, and unplanned events that might impact the demand at the port of entry. Another key objective is to keep a log of when hardware failure occurred, for how long, and why.
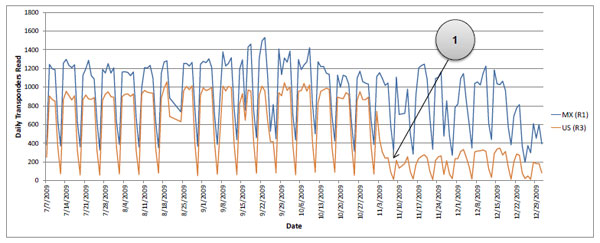
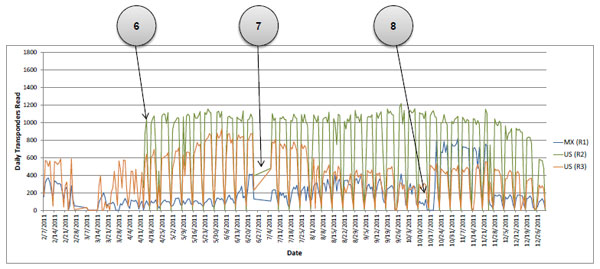
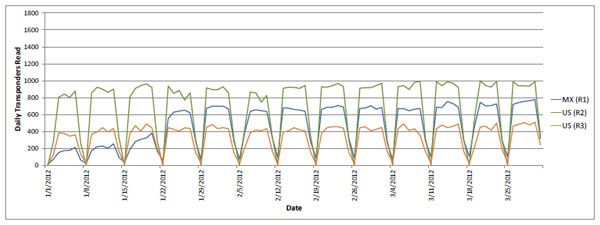
A series of graphs has been developed that are based on the daily count of transponders, read per calendar month by RFID readers on both the Mexican and US sides of the border, that are not matched. These graphs are shown by figure 42 through figure 45. These data are meant to complement the project’s information that is based on data from transponder reads that are matched (i.e., the same transponder identification number is detected passing the reader upon exiting the BSIF on the US side shortly after it was detected passing the initial reader on the Mexico side). Along with the graphs, explanations for observed discrepancies or speculation as to their causes are included. The discrepancy is numbered in the chart sequentially and then explained in following sections.
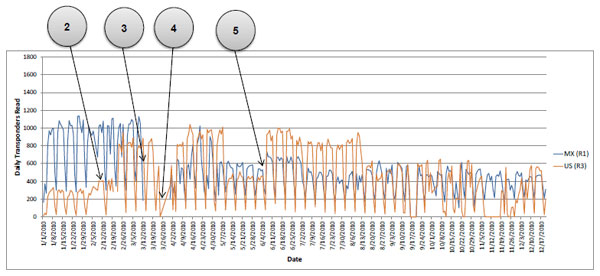
The graphs in figure 42 through figure 45 show the unmatched transponder read information by calendar year from July 2009 through March 2012. The figures are also annotated to explain or speculate on the cause of any anomalies experienced during a month. The labels on the charts represent specific anomalies, which are described as follows:
- 1 = Number of tags ready by the RFID station on the US side dropped, possibly due to frequency interference from the nearby RFID equipment deployed by TxDOT/DPS.
- 2 = Frequency of the RFID station on the US side was changed on February 19, 2009. The new frequency was set to 902.5 MHz while the original setting was 915 MHz. This change increased the number tags read by that RFID reader station.
- 3 = Roadway construction on the Mexico side started closing several lanes near the RFID station. The exact date of the road closure and number of lanes closed is not available. This reduced the number of tags read by the RFID reader on the Mexico side, while the number of tags read by the reader on the US side maintained its original level.
- 4 = Virtual private network (VPN) connection to the project’s server at an El Paso office went down due to unknown reasons. Hence, data were lost for one week in March 2010.
- 5 = CBP closed several northbound commercial lanes at BOTA between May 10, 2010 and June 6, 2010 for construction.
- 6 = RFID reader installed at the CBP primary inspection booths to measure wait times of US-bound trucks.
- 7 = Due to Internet failure at El Paso office, several days of data were lost.
- 8 = RFID equipment on the Mexican side was relocated, which resulted in increase in transponder reads.
Matched Tag Reads
Monthly Performance of Border Crossing
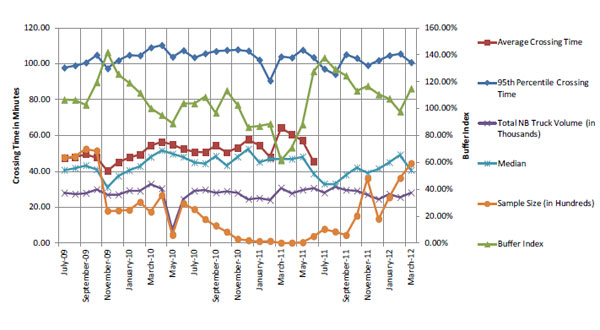
Monthly performance of the BOTA border crossing includes average crossing times of trucks observed in that month, buffer index, and sample size (total number of individual crossing times). Table 8 portrays in different ways the monthly average US-bound truck crossing times of trucks. A buffer index measures the reliability of travel service and is calculated as the ratio between the difference of the 95th percentile travel time and the average travel time, divided by the average travel time. The buffer index is the “extra time” required to cross the border above the usual (average) time and indicates reliability of the service. From an operational perspective, it would be interesting to understand why the reliability of truck crossing time increased so much during the month of November. An increase in the volume of trucks crossing the border during the month of November might explain the high buffer index.
The sample size (last column in table 8) after November 2009 dropped significantly. The number of tags read on the Mexico side appear to have continued at a consistent level (not shown in table 8), but the number of tags read on the US side dropped off. It was suspected (though not proven) that the RFID reader on the US side was reading significantly fewer tags due to frequency interference from another RFID reader installed nearby. The frequency of the project’s reader was lowered, and the numbers of its readings subsequently returned to previous rates at the later months.
The highly variable crossing times seen on this project were due to factors such as the reality that some trucks go through secondary inspection, some are part of the expedited FAST program, and some have trailers that are empty; those have very different crossing times from trucks not in those categories. When the mean crossing time was calculated, it did not distinguish among the crossing times of these trucks; all crossing times are used in calculating the mean. This results in a very high standard deviation and thus high co-efficient of variation, which is the ratio of standard deviation and the mean.
| Month-Year | Average Crossing Time
(1)
|
95th Percentile Crossing Time
(2)
|
95th - Average
(3) = (2)-(1)
|
Buffer Index
(4)=(3)/(1)
|
Median
(5)
|
Sample Size
(6)
|
|---|---|---|---|---|---|---|
| July-09 | 47.29 | 97.65 | 50.36 | 106.49% | 40.71 | 4768 |
| August-09 | 47.94 | 98.85 | 50.91 | 106.20% | 41.78 | 4821 |
| September-09 | 49.56 | 100.46 | 50.90 | 102.69% | 43.24 | 5244 |
| October-09 | 47.75 | 104.75 | 57.00 | 119.35% | 41.03 | 5146 |
| November-09 | 40.21 | 97.19 | 56.98 | 141.71% | 31.08 | 1791 |
| December-09 | 45.07 | 101.68 | 56.61 | 125.60% | 37.35 | 1814 |
| January-10 | 47.78 | 104.69 | 56.91 | 119.11% | 40.43 | 1842 |
| February-10 | 49.36 | 104.42 | 55.07 | 111.57% | 42.77 | 2282 |
| March-10 | 54.41 | 108.90 | 54.49 | 100.13% | 47.88 | 1741 |
| April-10 | 56.48 | 110.19 | 53.71 | 95.10% | 51.59 | 2658 |
| May-10 | 54.90 | 103.67 | 48.77 | 88.83% | 49.65 | 440 |
| June-10 | 52.59 | 107.25 | 54.66 | 103.95% | 48.07 | 2201 |
| July-10 | 50.81 | 103.42 | 52.61 | 103.54% | 44.93 | 1881 |
| August-10 | 50.63 | 105.53 | 54.90 | 108.45% | 44.33 | 1324 |
| September-10 | 54.32 | 106.82 | 52.50 | 96.66% | 48.48 | 969 |
| October-10 | 50.39 | 107.47 | 57.08 | 113.27% | 43.23 | 622 |
| November-10 | 53.14 | 107.75 | 54.60 | 102.75% | 48.01 | 222 |
| December-10 | 57.54 | 107.04 | 49.49 | 86.01% | 52.42 | 147 |
| January-11 | 54.60 | 102.02 | 47.43 | 86.87% | 45.18 | 99 |
| February-11 | 47.93 | 90.41 | 42.47 | 88.62% | 46.82 | 109 |
| March-11 | 64.30 | 103.81 | 39.51 | 61.45% | 47.03 | 10 |
| April-11 | 60.43 | 103.26 | 42.83 | 70.87% | 46.88 | 13 |
| May-11 | 57.21 | 107.51 | 50.30 | 87.92% | 48.13 | 34 |
| June-11 | 45.47 | 103.43 | 57.96 | 127.48% | 38.67 | 375 |
| July-11 | 40.83 | 97.00 | 56.17 | 137.59% | 33.00 | 779 |
| August-11 | 41.02 | 94.00 | 52.98 | 129.17% | 33.00 | 636 |
| September-11 | 46.82 | 105.00 | 58.18 | 124.28% | 38.00 | 438 |
| October-11 | 48.37 | 103.00 | 54.63 | 112.95% | 42.00 | 1513 |
| November-11 | 45.69 | 99.00 | 53.31 | 116.66% | 39.00 | 3600 |
| December-11 | 48.36 | 101.75 | 53.39 | 110.41% | 41.50 | 1346 |
| January-12 | 50.42 | 104.52 | 54.10 | 107.28% | 44.93 | 2541 |
| February-12 | 53.33 | 105.40 | 52.07 | 97.64% | 49.27 | 3616 |
| March-12 | 46.85 | 100.62 | 53.77 | 114.78% | 40.67 | 4437 |
In figure 46, the information in Table 8 is graphed. The vertical axis on the left represents crossing time in minutes, and the axis on the right represents the buffer index (as a percent). Also included in the chart are the 95th percentile crossing time, average crossing time, total US-bound truck volume, and RFID sample size.
Histogram of Crossing Times of Trucks
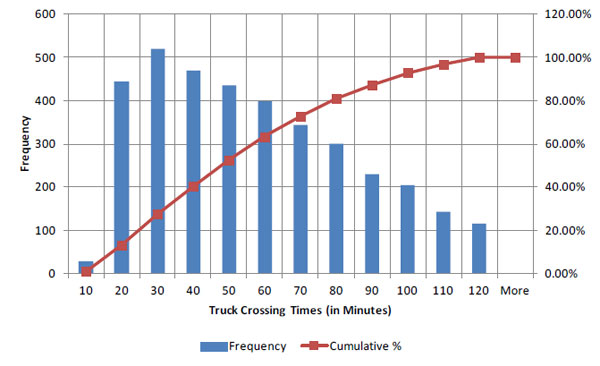
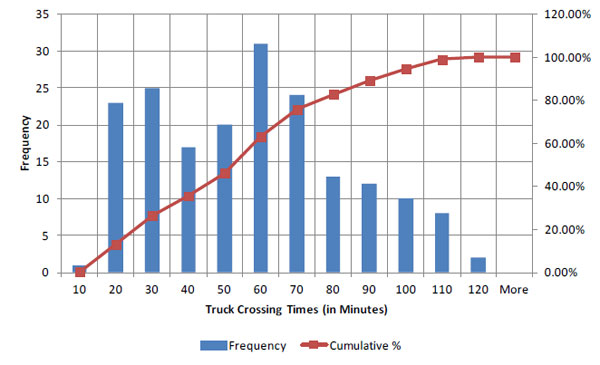
Figure 47 is a histogram of raw crossing times over a 29-day period (February 2012). It shows that the 95th percentile of trucks takes approximately 100 minutes or less to cross the border, and the 50th percentile of trucks requires approximately 50 minutes or less to cross the border. It should be noted that this histogram is based on the crossing time records with less than 120 threshold minutes to exclude outliers such as from the secondary inspection or mismatched RFID tags due to the random reader errors.
From the figure 47 histogram of raw truck crossing time for the month of February 2012, a histogram for a single weekday (February 15, 2012) was prepared and appears as figure 48. That histogram shows that the 95th percentile of trucks takes approximately 100 minutes or less to cross the border, and the 50th percentile of trucks requires approximately 50 minutes or less to cross the border. It also illustrates highly variable crossing times during different times of day. As previously noted, empty trucks require less crossing time than non-empty trucks, and trucks enrolled in the FAST program require less crossing time than trucks not enrolled in the FAST program. Being able to distinguish the type of trucks (empty versus loaded) and FAST versus Non-FAST by additional RFID readers will provide a better way of distinguishing crossing times of different types of trucks.
Hourly and Daily Variation of Average Crossing Times of Trucks
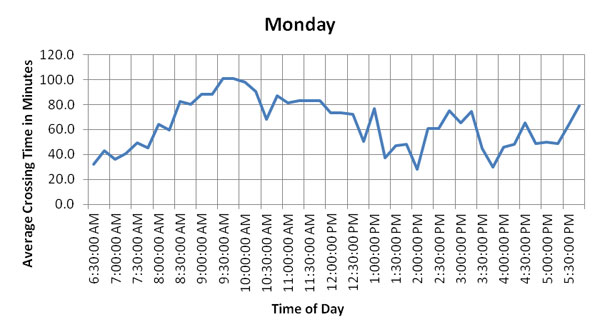
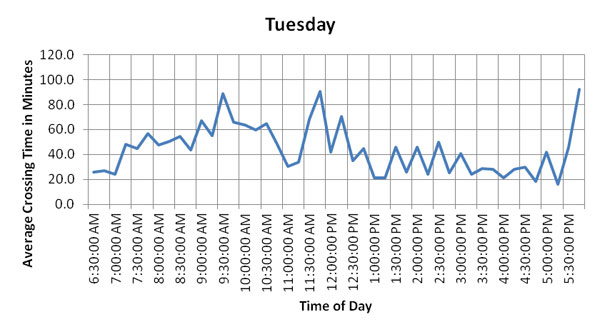
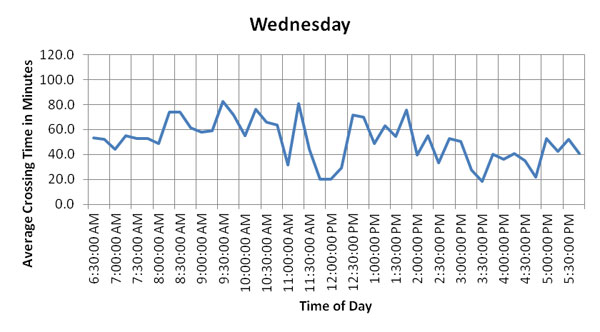
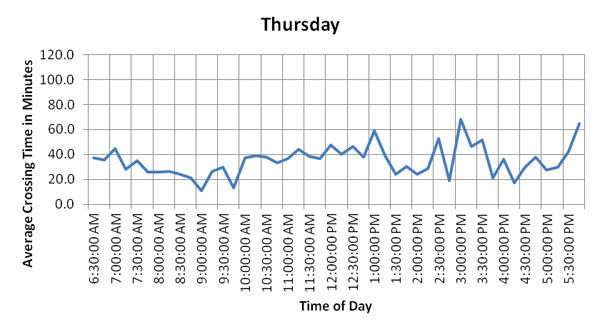
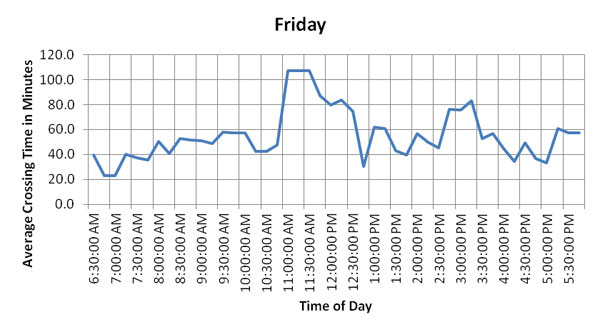
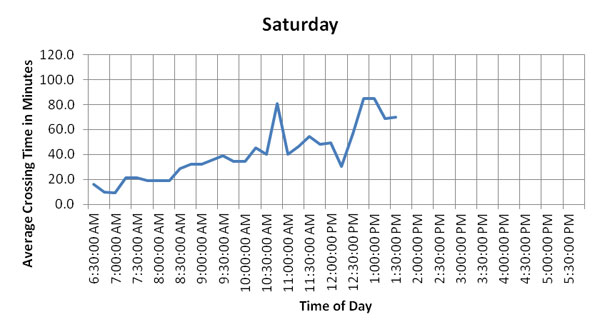
Individual crossing times of trucks were aggregated into hourly and daily averages to understand the temporal variations of crossing times. Figure 49 is a snapshot of hourly and daily variation of average crossing times of US-bound commercial vehicles at BOTA for Monday through Saturday, the week of February 13, 2012. Since the bridge remains closed for commercial traffic during Sundays, there is no chart available for that day. Also, the bridge closes at 3:00 PM on Saturdays, after which there would be no data (and on the Saturday shown, there are no data after approximately 1:40 PM). These graphs show that average crossing times are lower on Thursday and Saturdays. Crossing times on Monday and Friday are higher, as Friday is normally the busiest day at the bridge. This increase in crossing times on Fridays most likely occurs because shippers rush to close out the week’s sales by getting as many orders off their docks as possible, which causes US-bound truck traffic at BOTA to increase. Monday and Tuesday peak crossing times occur during the mid-morning hours, while Friday peak crossing times occur during the late-morning/early afternoon hours. Since the graphs only capture one week of February, the patterns could be different on the other weeks or months and need to be analyzed further for any possible seasonal or month-to-month trends.
Histogram of Wait Times of Trucks
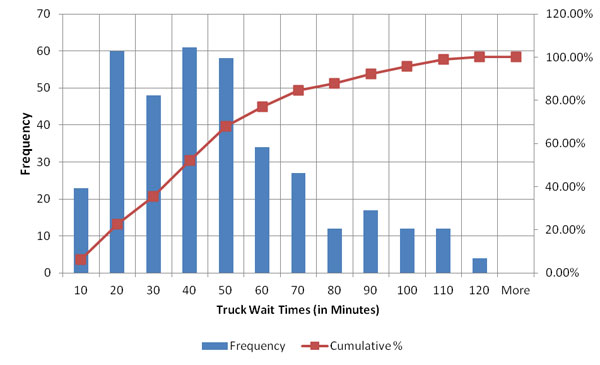
Figure 50 is a histogram of raw wait times over a 29-day period (February 2012). It shows that the 95th percentile of trucks takes approximately 80 minutes or less to wait at the border, and the 50th percentile of trucks requires approximately 40 minutes or less to cross the border. Notice that this histogram is based on the wait time records with less than 120 threshold minutes to exclude outliers such as from the secondary inspection or miss matched RFID tags due to the random reader errors.
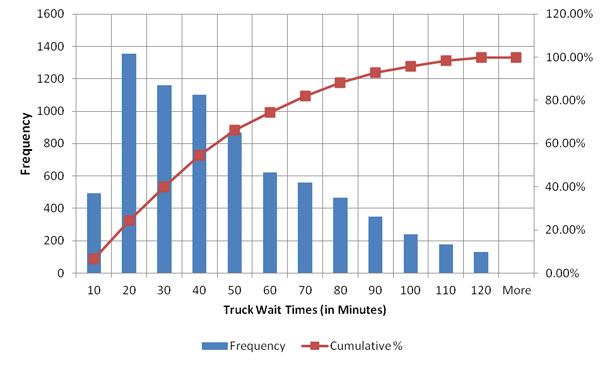
Figure 51 shows histogram of raw truck wait time for the a single weekday (February 15, 2012). It shows that the 95th percentile of trucks requires approximately 90 minutes or less to wait at the border, and the 50th percentile of trucks requires approximately 50 minutes or less to wait at the border.
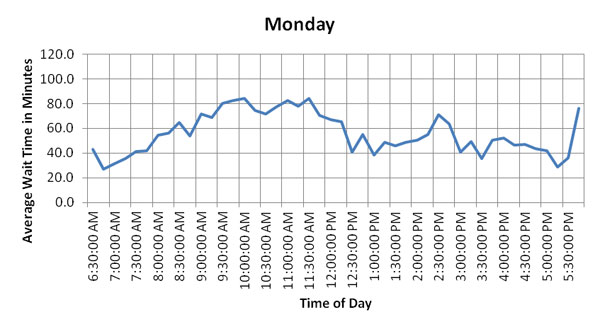
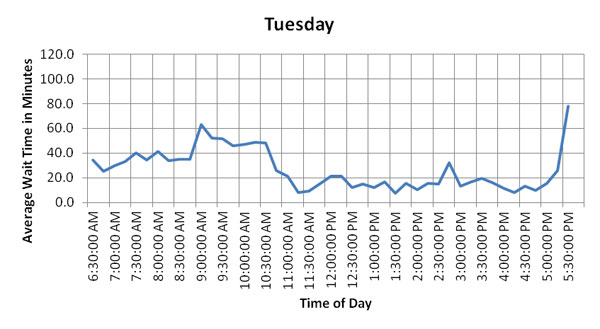
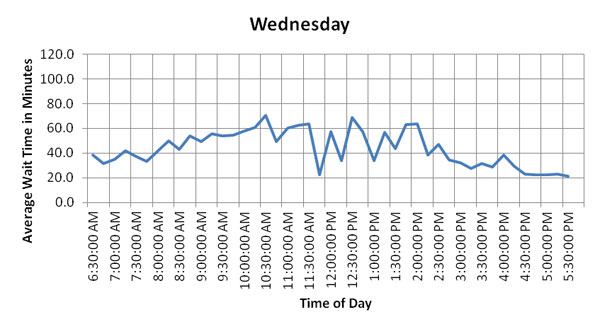
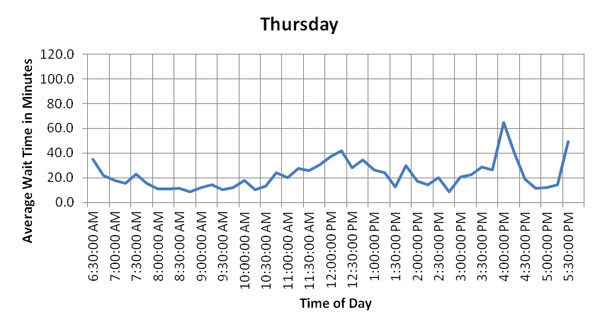
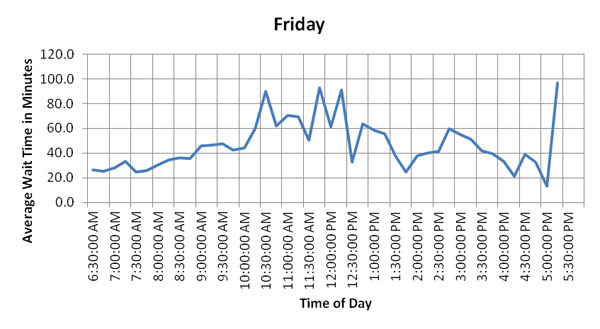
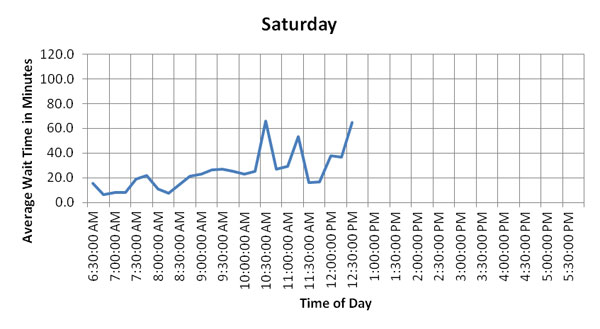
Hourly and Daily Variation of Average Wait Times of Trucks
Figure 52 illustrates the average crossing times for US-bound commercial vehicles at BOTA by day during the week of February 13, 2009. The wait time is calculated from the matched RFID tags between the reader in Mexico and at the CBP primary inspection facility. The average wait times are lower on Tuesday, Thursday, and Saturdays while Monday and Friday have overall higher wait times. Monday wait times are steadily increased to the peak time around 10:00 AM and maintain the plateau until 11:30 AM. Friday shows multiple peaks between 10:30 AM and 12:30 PM.