Measuring Border Delay and Crossing Times at the US–Mexico Border
Final Report
Automated Crossing and Wait Time Measurement
CHAPTER 5: DATA COLLECTION, PROCESSING, AND DISPLAY
This chapter highlights some of the key findings of the data collection and analysis portion of the project. This includes crossing time data at BOTA for the period of July 8, 2009, through March 30, 2012 and wait time data for the period of April 15, 2011 through March 30, 2012. The chapter also highlights wait time data collected at Pharr-Reynosa border crossing for the period of March 25, 2011 through March 30, 2012.
Data Collection and Wireless Transmission
Each RFID reader station has an antenna located over each lane at the location. The antenna positioning is such that 85 percent or more of the vehicles passing underneath that have readable tags and pass under both reader stations should receive a tag match. The location of each reader was chosen to limit the number of antennas required for site coverage. The antenna connects with a traditional tolling-quality RFID tag reader (although these readers are not used for tolling) that can reliably read the protocol of a variety of tags carried by trucks crossing the border. The tag reader continually scans for a passing tag. (It should be noted that it is important for the tag to be correctly positioned under the truck’s windshield glass for best readability results.)
As a tag passes the reader’s antenna, a unique code is recovered from the tag via an exchange of radio frequency energy. The code is converted into a digital message and forwarded to the RFID station’s onsite data logging component. The reader’s data communication protocol is such that few or no “handshakes” and additional transactions are required during normal operation (tag read mode). The conceptual design does not currently include any additional processor or computer platform to manage the RFID reader at the local level.
The onsite logger is used to capture, time-stamp, and store all tag messages (tag reads with vehicle identification code) from the reader and can also be accessed either remotely or locally if a problem in communication interrupts data flow from the site. The logger can be considered a backup to secure the vital data needed to accomplish the main goals of the project in the event of communication failure. The logger then passes data moving both from the RFID reader and toward the reader. All data coming from the reader (tag data) are time-stamped and logged.
The tag read messages are routed out of the field site and toward a central server at an office in El Paso, Texas in near real-time. A communication solution was implemented for each field location. The communication setup included data transmission between the RFID station and the central server via cellular data.
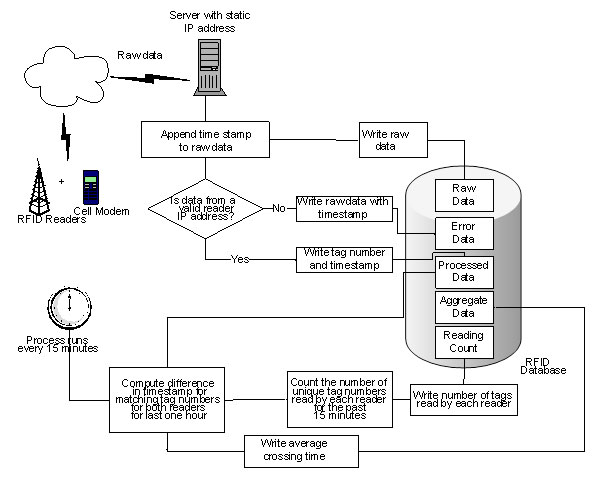
RFID readers send data to the fixed Internet Protocol (IP) address on a fixed User Datagram Protocol (UDP) port number using a cell modem. The UDP listener on the central server monitors the UDP port for any incoming data packets. When the UDP listener detects any data packets on the incoming port, it reads the data packets, associates a time-stamp with the data read, and invokes a stored procedure on the database. This stored procedure then inserts the data read into the raw data table. A trigger fires whenever any new data are inserted into the raw data table. This trigger verifies whether the data are coming from a valid combination of reader ID and IP address. If a valid combination is detected, then the tag number is parsed out of raw data, and the tag number and associated time-stamp are inserted in the processed data table. If the combination is not valid, then the raw data and time-stamp are inserted into the error data table.
The entire data transmission and archiving process is illustrated in figure 37.
Filtering Raw Data
Depending on the characteristics of border crossings, a significant number of trucks could be part of drayage or other operations that result in their crossing the border several times in a day. Hence, it is imperative that a process to filter raw data be able to distinguish individual one-way trips inbound to the United States. This can be achieved by using a fixed time window. This is the minimum value a truck needs before the truck can join the queue again for making subsequent trips across the border. For example, if this time window is 120 minutes, it is assumed that a truck typically takes more than that amount before returning to join the queue to cross the border again. However, this value needs to be reflective of the crossing time at the POE and thus needs to be much higher than crossing time of trucks even if some of them go through secondary inspection. It should be noted that the current filtering technique most likely filters out secondary inspection. Also, the value must not be so high that it is possible that trucks can cross the border again within that time period.
The individual transponder data are matched between RFID stations to obtain wait and crossing times. Prior to matching transponders, following filtering is performed:
- To avoid multiple tag reads from stalled vehicles.
- Once the transponder tags are read by a RFID reader, the same tag cannot be read again by the same station for the next one hour.
- To filter tags that were missed by one of the RFID readers.
- If a transponder tag is missed by next reader in the trip, then its excluded by the system from average crossing time and wait time calculations for that particular time interval.
- To filter trucks with multiple tags.
- If the multiple tags read by the system have similar time timestamps (separated by a couple of seconds) for a couple of readers, then only one of those tags is used for average travel time computations.
Automated Estimation of Current Wait and Crossing Times
Following the filtering process described in earlier section, individual wait and crossing times of trucks are determined. Individual wait and crossing times that are over 120 minutes are discarded. Then after, using automated processes in the database individual wait and crossing times are aggregated in different temporal granularities.
First, average wait and crossing times are determined at a predefined frequency (e.g., every 15 minutes). For example, determine average crossing and wait times at 7:00 AM, 7:15 AM, and so on. This technique requires using a block of raw data, the span of which could be a fixed time window (e.g., 120 minutes), to calculate the average crossing and wait times. In addition to average values, standard deviation can also be part of the calculation. Average values reported every 15 minutes can be used to monitor trends within a day or week or within a predefined time period. They can also be used to identify peak and off-peak periods.
Second, average wait and crossing times data for aggregated for an hour, entire day, week, and month. This technique is useful in monitoring long-term trends of border crossing performance but dampens the peaks and off-peak values of crossing and wait times. The average truck wait and crossing time determined by the above-mentioned procedure is also used to update XML data files, which are shared via the RSS process. Using RSS, external users can obtain the most recent truck wait and crossing time via the Internet.
Toward the end of the project, discussions between CBP and FHWA led to general agreement that CBP would evaluate the wait time estimation algorithms implemented in this project so that it would make a determination to use wait times of trucks resulting from an RFID-based system. Because of the on-going evaluation process, a separate initiative is modifying the algorithm to fulfill CBP’s requirements. The initiative is also addressing CBP’s concerns regarding overestimation of wait time at certain POEs during low volume conditions and providing the wait time more frequently than 15 minutes (e.g., measure every 10 minutes but display information every 5 minutes).
Automated Archiving of Wait and Crossing Time Data
The central database server maintained at an El Paso, Texas office includes several database tables where raw and processed data are archived. Raw data include data packets obtained from the RFID reader stations and includes transponder identification number and timestamp along with the name of the reader station. The database server includes built in programs that determine wait and crossing times of individual trucks with transponders and store them in different table. The individual wait and crossing time data are then aggregated into different parameters (e.g., 15 minute/60 minute/daily average wait and crossing time) and are stored in different tables. Archived data is available to stakeholders via prototype web tool described later in this chapter.
A copy of the archived RFID data in a compact disk (CD) has been provided to the FHWA along with this report. The archived data is in Microsoft Excel 2002-2003 format. The file includes individual truck crossing times data from July 2009 through March 2012 and April 2011 through March 2012 for BOTA. The file also and includes wait times data from March 2011 through March 2012 for Pharr-Reynosa.
In the database server, raw and aggregated wait and crossing time data is stored in eight different tables, definitions of which are described in table 7.
| Table Name | Description | Field Names |
|---|---|---|
| RawData | This table includes raw data received from the RFID readers. |
|
| TransponderCount15Minutes | This table includes total number of transponders read by individual readers at 15 minute time intervals. |
|
| TransponderCount60Minutes | This table includes total number of transponders read by individual readers at 60 minute time intervals. |
|
| RawTravelTimeData | This table includes travel times of individual transponders re-identified by both RFID readers. |
|
| AvgTravelTimeData15Min | This table includes average travel times calculated every 15 minute using 120 minutes as the time window. |
|
| AvgTravelTimeData60Min | This table includes average travel times calculated every 60 minute using 120 minutes as the time window. |
|
| DailyDelayStatistics | This table stores delay statistics on a daily basis |
|
| MonthlyDelayStatistics | This table stores delay statistics on a monthly basis |
|
Dissemination and Accessibility of Data
A prototype web tool was developed to provide an effective and efficient web-based platform for dissemination of real-time traveler information and archived border-crossing related data to stakeholders on the US–Mexico border. Real-time traveler information includes current border wait times and crossing times obtained from the RFID deployments. Archived data include historic wait times and crossing times of trucks. Presentation of historic data includes trends shown in different temporal and spatial granularities, summarized and aggregated data, and simple summary statistics.
RFID systems deployed at the BOTA and Pharr-Reynosa International Bridge POEs are the focal points/sites; however the prototype web tool was developed to be scalable to accommodate other ports of entry on the US–Mexico border.
The prototype web tool was designed so that it acts as a “human interface” and “single window” to access border crossing-related archived data and real-time traveler information on the US– Mexico border. The tool is fully web-based in a client server architecture in which all data processing requests from the clients or users are performed in one or more servers. This allows faster transfer of results to the users and does not force the users to have extremely high-speed, powerful computers or mobile devices.
The prototype web tool is fully web-based and available to users via the Internet. At a minimum, a user should have access to the Internet and have a web browser such as Microsoft Internet Explorer®, Google Chrome®, Apple Safari®, and Mozilla Firefox®. The prototype web tool does not require third party software to be downloaded and installed in the computer or the mobile phone.
Accessing Real-Time Information
Stakeholders specifically indicated a need for efficient methods to access and retrieve traveler information as crossing and wait times of trucks at international land border crossings. There are several methods through which travel information can be pushed to travelers, upon their request, before leaving their point of origin and while en route to a destination. This provides travelers with capabilities to choose between border crossings, where possible, to reduce their overall trip time. While en route, travelers typically obtain information regarding travel condition at border crossings from local radio stations and, in the case of freight carriers, from their own dispatchers.
The prototype web tool includes methods by which traveler information can be “pushed” to freight carriers through personal mobile devices, or alternatively the carriers can “pull” the information from the web tool at their convenience. While this report recognizes the potential of mobile devices for expanding traveler information, it is emphasized that motorists must abide by current and future rules and regulations and safety recommendations regarding distracted driving; i.e., driver inattention due to use of cell phones or other electronic devices.
In terms of real-time information, the prototype web tool has following capabilities:
- Disseminates border crossing times and wait times of US-bound trucks.
- Provides a capability to support requests from the local media for real-time border travel time data (as long as data are from a public source that does not require any external agreements).
- Provides access to real-time data, which are used by external applications developers (e.g., for mobile devices or in-vehicle navigation devices) to access current border travel time information.
- Provides an alternate traveler information page compliant with Section 508 of the Rehabilitation Act and the Access Board Standards.
- Disseminates customized crossing and wait time information to travelers upon request.
- Provides the capability to exchange information with another traveler information service, such as State- and city-managed traffic management centers and 511 systems.
Stakeholder agencies can incorporate the real-time information into their website either by integrating the web page into a separate frame in the agency website and/or could use the RSS feed to read the data and present the data in appropriate format. Similarly, regional traffic management centers (TMCs) can use the RSS feed provided by whoever maintains the RFID system and display the crossing time information to their Dynamic Message Signs (DMS), Highway Advisory Radio (HAR), and the Internet.
Another option for the TMCs would be to use an autonomous/standalone application that receives period data from the RFID stations. The application would calculate the average crossing time periodically, and the TMC’s core application can read the average crossing time and display over field devices such as DMS and HAR. This application could be distributed to regional TMCs wanting access to the crossing time information. However, there may be limitations as to how many TMCs can concurrently receive the RFID data.
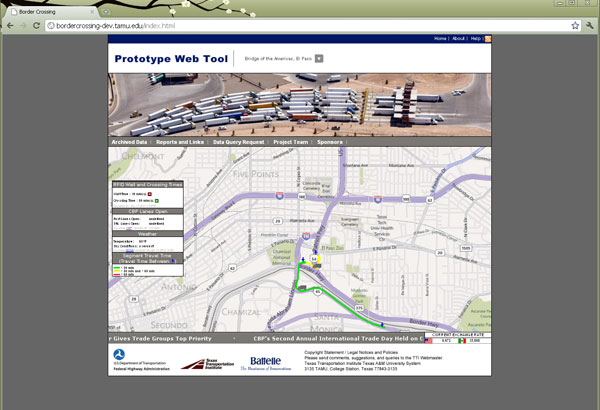
The web address or uniform record locator (URL) to access the main page of the prototype web tool using a desktop web browser is http://bordercrossing-dev.tamu.edu/index.html. The main page (home page) of the prototype web tool shows the real-time information (most recent truck wait and crossing times) in map background, as shown in figure 38.
Users can receive real-time information consisting of most recent average crossing times and wait times of US-bound trucks via Real Simple Syndicate (RSS) feeds in XML file format. Using RSS feeds, individual users can receive the most up-to-date information automatically in their web browsers, e-mail client (e.g., Microsoft Outlook), and mobile devices. With RSS, users do not have to visit the prototype web tool website to obtain the latest real-time information; with RSS, real-time information is delivered to the users. System users such as 511 systems, TMCs, traffic information providers, and navigation data providers can also receive the information, since RSS feeds are stored in non-proprietary XML format.
The RSS feeds also include geographical (e.g., latitude, longitude) data of lines representing the truck path between RFID stations, along with color-coding of the lines depending on the pre-determined value range. Users can also incorporate the real-time information into their Internet and Intranet sites by integrating the prototype web page into a separate frame in the agency website where the data can be presented in appropriate format. Another option for TMCs is to use an autonomous/stand-alone application that receives periodic data from the RSS feeds. This application is distributed to regional TMCs wanting access to the crossing time and wait time information.
One of the advantages of subscribing to an RSS Feed versus signing up for an e-mail newsletter or mailing list is that the subscriber does not provide name, e-mail address, or other personal information. The prototype web tool has no way of knowing the user’s personal information.
Internet browsers such as the latest versions of Microsoft Internet Explorer®, Google Chrome®, Apple Safari®, and Mozilla Firefox® have RSS readers built in. If a user has a browser that does not currently support RSS, there is a variety of RSS readers available online. In addition, search engines such as Google and Yahoo! allow users to add RSS feed information to their e-mail client and personalized home pages. Users can also subscribe to RSS feeds on mobile devices using the appropriate software.
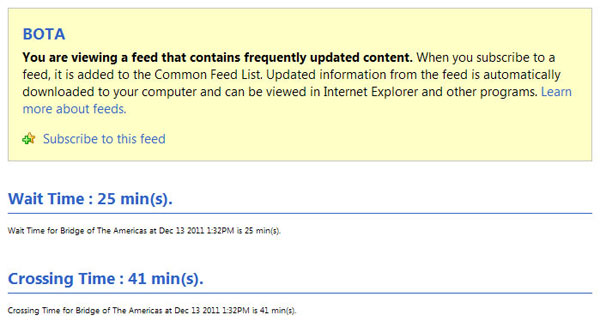
The prototype web tool currently includes two RSS feeds to relay average crossing times and wait times of US-bound trucks, one each for the BOTA and Pharr-Reynosa International Bridge POEs.
The prototype web tool currently includes two RSS feeds to relay average crossing times and wait times of US-bound trucks, one each for the Bridge of the Americas and Pharr-Reynosa International Bridge.
The URL for the RSS feed for the Bridge of the Americas is http://bordercrossing-dev.tamu.edu/rss/trucktraveltimebota.xml.
The URL for the RSS feed for Pharr-Reynosa is http://bordercrossing-dev.tamu.edu/rss/trucktraveltimepharr.xml.
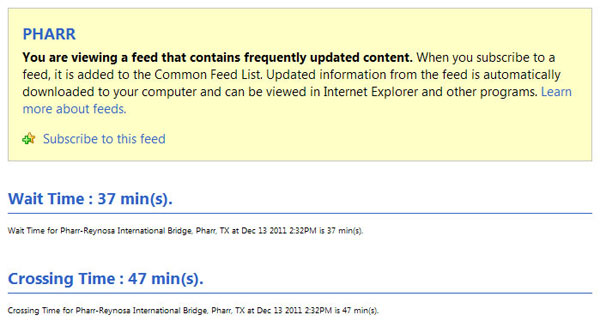
Figure 39 and figure 40 show snapshots of RSS feeds in XML file format used at the BOTA and Pharr-Reynosa International Bridge POEs, respectively.
Accessing Archived Information
Archived border crossing data are used by private and public agencies that have responsibilities to plan, operate, and manage border crossing infrastructure. Archived data are used by agencies such as MPOs, city agencies, CBP, and GSA to plan future infrastructure improvements and manage resources in order to operate border crossings efficiently.
There is a strong need for a centralized repository of archived data and an efficient web-based interface to access the data. Hence, the objective of this prototype web tool is to provide user-friendly access to the archived freight border crossing and wait time data resulting from various ITS and non-ITS data sources. Through the prototype web tool, stakeholders will be able to not only access the data, but also to take action such as retrieve data, perform queries on data, and monitor trends and performance involving border-crossing flows.
Data are received from multiple RFID readers filtered, aggregated, summarized, and fed into a centralized database. Archived data not only provide a granular view of the border crossing data but also a single view of the system in the form of summarized or aggregated data. The data warehouse concept is built upon the need to provide a granular as well as a single view or image of the data, typically by using data extracted from disparate and potentially incompatible sources.
Data archived in the data warehouse are time-variant, which means that every record in the data warehouse represents a moment in time. In the prototype web tool, every record in a table is time-stamped. For example, raw data records are stamped with the time when the data were generated. Aggregated or summarized data are stamped with the time-period the data represent.
In terms of archived information, the prototype web tool has following capabilities:
- Collect and maintain data and data catalogs from one or more data sources and include quality checks, error notification, and archive coordination.
- Provide advanced data analysis and mining features to support discovery of information, patterns, and correlations in large archives.
- Provide ways for users to retrieve data and information through the Internet and mass media storage devices (consistent with Distracted Driver rules and regulations and related safety information).
- Provide pre-coded or standardized queries.
- Provide ad hoc queries and data searches.
- Provide data structured so they are readily available in ways that typical users may want to review, such as by time periods, geographic and political boundaries.
- Provide a catalog of the data and other information that are available, with the ability to request the desired format and data.
- Provide capability to execute summarizations, aggregations, and statistical analysis on the archive data.
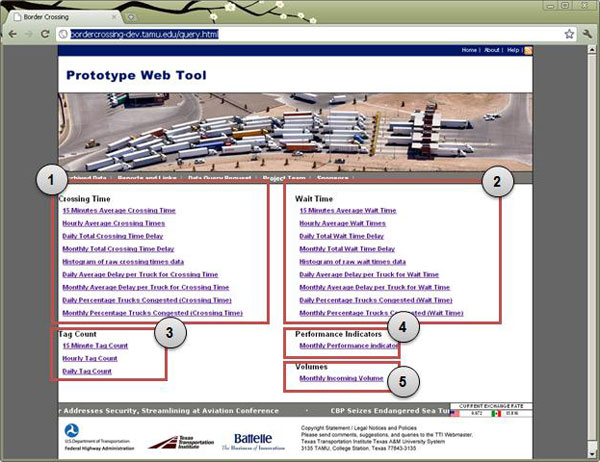
To retrieve archived information, enter http://bordercrossing-dev.tamu.edu/query.html in a web browser, which brings up an archived information page as shown in figure 41. The webpage has been divided into five sections labeled 1 through 5 in figure 41 are as following:
- Crossing time-related information for user-selected POE and date range.
- Wait time-related information for user-selected POE and date range.
- Transponder count at user-selected RFID station, POE, and date range
- Monthly performance indicators for user-selected POE and date range.
- Monthly truck volume from the Bureau of Transportation Statistics (BTS).