| Skip to content |
|
Traffic Incident Management Cost Management and Cost Recovery PrimerIntroductionThis publication provides mid-level managers at transportation and other stakeholder agencies with the resources they need to explain the benefits of traffic incident management (TIM) and TIM cost management and cost recovery to executive leadership. It also provides the same mid-level managers with information that will help them implement TIM cost management and cost recovery techniques. This document focuses on "recoverable costs" related to TIM, as there are costs associated with TIM that cannot accurately be measured or replaced; however, costs related to responder and motorist injury, disability, fatality, and the related medical and societal costs are not addressed here as those issues are addressed in a variety of ways in the existing literature. Costs are classified as being recovered when the program receives full or partial reimbursement from sources outside of the budget. Once costs are recovered, they can pay back the originator or be reinvested for future activity. Costs can be recovered from responsible parties (e.g., insurers, property owners), from associated or interested third parties (e.g., government grants for specific activities), or in the form of payment for service (e.g., incentives based on time or effort). Through numerous discussions with local and State TIM practitioners and a global scan of the issues impacting effective TIM operations throughout the Nation, the Federal Highway Administration (FHWA) recently identified TIM cost management and cost recovery as emerging issues for transportation, law enforcement, and fire agencies engaged in planning for and implementing TIM operations in their communities and regions. As transportation operations, and more specifically TIM, become a more mature part of transportation agency services, jurisdictions must understand the true cost of responding to traffic incidents and identify ways to offset or recoup these recurring costs. FHWA presents this document as a contribution to the sparse body of knowledge on the topic and provides a vision towards which transportation agencies can begin to work as TIM programs become a transportation agency mainstay. The scope of this document is limited to costs directly associated with incident mitigation. Costs associated with responder injuries and long-term health care needs due to traffic incidents are not considered. The September 2010 FHWA publication "Best Practices in Traffic Incident Management" described TIM as "a planned and coordinated program to detect and remove incidents and restore traffic capacity as safely and as quickly as possible."1 When discussing what strategies can be employed by agencies to manage costs related to TIM, planning is a key aspect. It is the factor that makes it possible for agencies to identify opportunities to recover a portion of the total cost of providing TIM services. But before one can understand how the costs associated with TIM affect an agency, one must be familiar with both the fundamentals of what constitutes a TIM program as well as the more intricate details of what makes a TIM program effective. For those readers lacking a comprehensive understanding of the elements of a successful TIM program, the following documents provide useful background information for both TIM and cost management/cost recovery:
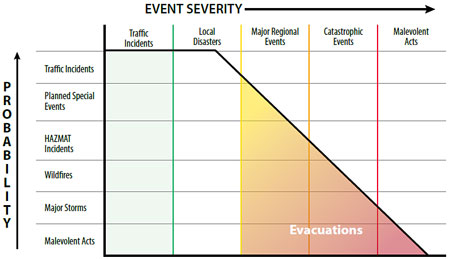
As this document examines the TIM cost elements that may be managed and recovered, the reader should be comfortable with the premise that traffic incident management is a new public safety discipline wherein traditional first responders work with transportation elements to respond on the Nation's roadways. Moreover, TIM is one of a series of emergency transportation operations (ETO) events. This linkage is important because, as the National Response Framework (NRF) indicates, a traffic incident can escalate into a disaster, a widespread emergency, or other significant event.2 As Figure 1 shows, a traffic incident is the most probable and most frequent ETO event that occurs. Compared with the other events the chart depicts, traffic incidents tend to be the least severe.
It is important to recognize that a TIM event is an ETO event because as more events occur that require coordinated response and recovery efforts, exercising and planning for TIM can become a way of preparing responders for larger ETO events, and this practice can extend to managing and recovering the associated costs. This document does not suggest that the capability of an agency either to manage or recover costs associated with TIM should be an indicator of whether the service is beneficial, but rather that a better understanding will help mid-level managers at transportation agencies understand the effect that TIM is having on the agency and help them demonstrate the effectiveness of their programs. Planning for operations provides a foundation for explicitly developing TIM goals, objectives, strategies, processes, and opportunities for integration with broader regional operations and safety initiatives. Through these activities planners and operators will have a better starting point for estimating and evaluating TIM cost implication (capital, operational, and support) and revenue options. Cost management and recovery for planned special events is addressed under separate cover in the Planned Special Events: Cost Management and Cost Recovery Primer, May 2009 on the FHWA Office of Operations website at https://ops.fhwa.dot.gov/publications/publications.htm. OrganizationThe arrangement of this document provides the reader with a clear understanding of what must be done to manage and recover costs associated with TIM. Chapter 1 presents and summarizes the fundamentals of TIM so that the affects that costs have on these activities can be linked. As discussed on the previous page, this publication is not intended to re-create the content from previous publications; however, some explanation is necessary for the reader to understand the context in which the document addresses TIM costs. Chapter 1 - Presents and summarizes the fundamentals of TIM so that the effects that costs have on these activities can be linked. As discussed on the previous page, this publication is not intended to re-create the content from previous publications; however, some explanation is necessary for the reader to understand the context in which the document addresses TIM costs operations. Chapter 2 - Contains information about the fundamentals of cost management and cost recovery. Many types of businesses use these fundamentals, and by examining some of them the reader may begin to identify TIM implementation strategies. Chapter 3 - Defines the state of the practice and shows that, for the most part, the cost aspects of TIM that are managed and recovered are tactical. Chapters 4 and 5 - Shows the reader how to take advantage of opportunities to manage and recover TIM costs. Chapter 6 - Examines the topic of planning for operations. Understanding the role that TIM plays in planning for operations is important because reinforcing this link is a primary objective of mainstreaming transportation operations as a whole. The goal of this chapter is to provide information that will allow TIM cost management and recovery to move beyond the tactical level. The information provided will provide mid-level managers with the knowledge needed to define a process within their own agencies that demonstrates a more complete return on investment in transportation operations, including TIM. It will also allow them to identify ways to offset the costs of TIM by understanding the costs for strategic and support activities associated with TIM. Chapter 7 - Recognizes that the conversation on how to pay for the recurring costs of TIM and transportation operations is just beginning. This chapter provides additional topics that should be discussed and researched to take the next step in TIM cost management and cost recovery. Challenges/IssuesTransportation and TIM responder agencies can face many challenges in responding to incidents and crashes on our Nation's roadways, most notably shrinking budgets and the need to maintain an aging infrastructure. Traffic incidents are a significant issue affecting both safety and mobility on our roadways; while quantifying the total impact to society is not possible given current data availability, we may be able to draw some conclusions on the scope of the problem extrapolating smaller datasets. Economic future shrinking budgetsThe United States struggles with an economy that is only now coming out of a recession, and its future remains uncertain. According to the National Association of State Budget Officers, general fund spending among the States remains $18.7 billion, or 2.7 percent below peak fiscal 2008 levels.3 Fiscal Year 2011 general fund spending saw a decline of 6.3 percent from peak 2008 levels. Balanced budget laws, in effect in most States, require State agencies to cut programs and services to offset decreased revenues and funding. As a result, State and local programs will come under increased scrutiny, and program managers will need to justify funding for each program through performance measurement data and cost-benefit analyses. While this document does not provide a cost-benefit analysis process for TIM, it does begin to address the need to institutionalize the way TIM costs are tracked. Only after a method and data are in place will cost-benefit analyses be possible. State budget cuts affect all first response agencies and entities, which in turn are likely to limit responders' ability to provide an appropriate level of response to traffic incidents across the Nation. Cost-benefit analyses, when complete and appropriate, may be used effectively to help address the realities of the battle for sustained, increased, or new funding for TIM efforts. TIM continues to be an issue that impacts livability in communitiesAccording the National Highway Traffic Safety Administration's (NHTSA) General Estimates System (GES), the number of Reported Motor Vehicle Crashes in 2010 totaled 5,419,000. While many sources suggest that only half of all motor vehicle crashes are reported, typically only those crashes that are reported require a coordinated response and, therefore, result in the expenditure of responder agency resources. Of reported crashes in 2010, 30,196 resulted in fatalities and 1,542,000 included injuries. Each of these fatal and injury crashes resulted in a major incident on the roadway that required a significant level of response—at a minimum police, fire/rescue, and likely towing. But crashes account for only part of the problem. Breakdowns, debris, and other on-road events create a need for on-scene response to return the roadway to normal operations. Calculating the number of non-crash incidents across the United States or for any particular State is not feasible with the current data collection systems and priorities. Table 1 shows the result of the extrapolation of the crash to disabled vehicle ratio applied to estimated crash rates from 2005 to 2010. As a substitute for actual data, a sample set of data from the Maryland Coordinated Highway Action Response Team (CHART) program was used to extrapolate an estimate of non crash related incidents per year. For example in 2010 the CHART program recorded 19,309 emergency response incidents, or crashes; CHART data also indicated 29,699 disabled vehicle responses. The ratio between these data points (1/1.538) was applied to the GES crash estimates for the entire nation, resulting in 8,334,915 disabled vehicle responses and 13,753,915 total incidents needing response across the country in 2010. This extrapolation was also performed for the years 2005 through 2009, with results indicated below. Many incidents and disabled vehicles go unreported, therefore this estimate is likely below the actual number of incidents occurring on roadways each year. It is important to note that while there may not be cost recovery opportunities for all disabled vehicle incidents, that there is a real cost in any response necessary. The intent of the table below is to quantify the scope of the TIM issue on a national level.
Sources: National Highway Traffic Safety Administration, General Estimate System (Crashes); CHART 2010 Data (Disabled Vehicles extrapolated to national estimates). The Cost of Traffic IncidentsIf TIM cost management and cost recovery are to become important to an agency, then it is important to understand exactly what the costs associated with TIM are. The full spectrum of TIM costs also include strategic and support costs that need to be considered during cost management and recovery. Items such as medical costs, court costs and fines, increased insurance costs, and societal costs due to lost time and revenue due to delay impact the overall cost equation. Those types of costs are important to acknowledge as the focus shifts from cost management and cost recovery to developing benefit-cost ratios. In addition to incorporating the full range of tactical costs, strategic and support costs must also be added to realize the full cost of TIM. Collecting all information across the full cost spectrum shown in Figure 2 will allow agencies to understand the cost of TIM and, ultimately, allow for the partial or whole recovery of costs.
|
|||||||||||||||||||||||||||||
|
United States Department of Transportation - Federal Highway Administration |
||