| Skip to content |
|
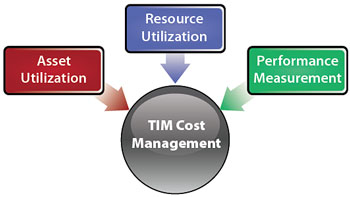
Traffic Incident Management Cost Management and Cost Recovery PrimerChapter 4. Translating Cost Management Principles into TIM PracticeBased on the survey responses, it is evident that there is no widespread practice of managing and recovering TIM costs. With State transportation funding uncertain due to current economic conditions, agency budget authorities and elected officials are likely to continue to examine closely those services that transportation agencies provide. Since capacity-enhancing projects will likely continue to decrease in frequency, good TIM practices are likely to replace that void. As a result, a good TIM program that incorporates the NUG is very likely to become more crucial to transportation agencies that are striving to maintain their capabilities. The following roadmap presents a good approach to shifting toward a managed TIM cost approach. A plan for managing and recovering TIM costs must address how agencies can maintain a service that has become a necessity in a time of limited staffing and financial constraints. Roadmap for Managing TIM CostsTo prepare for this eventual future, good TIM cost management will be necessary and will entail a shift in agency preparedness over the next few years. While the components of cost planning, tracking, analysis and evaluation, and decision discussed in Chapter 2 represent the mechanics of TIM cost management, three primary elements also need to be managed: asset utilization, resource utilization, and performance measurement. It is true that some of the broad TIM cost management components shown in Figure 11 below can overlap with other parts of the broad definition of transportation operations, but that makes them no less important. The three primary elements are defined as follows:
Through the application of each of these aspects, it is important not to lose sight of the importance of visualization. Political leaders and the public need to be provided with graphical representations of information that is easy to understand and interpret. For this reason, it is useful to pre-plan what message will be well received by the target audience as agencies execute this roadmap (Table 6) to TIM cost management.
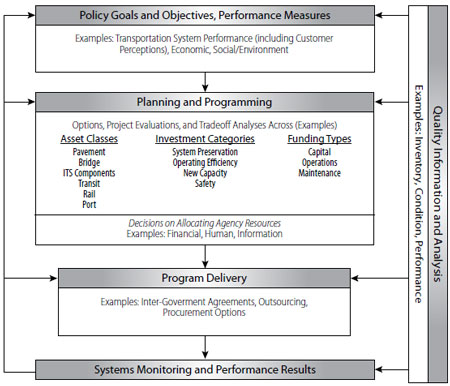
Asset UtilizationAssets are defined as quantifiable physical objects, and resources are defined as people and time. The reason for making the distinction for TIM is that TIM assets often fall into the tactical and supporting categories, while TIM resources are present in all TIM categories. Asset management is a decisionmaking framework focused on the purchase, construction, maintenance, replacement, and retirement of fixed assets. Asset management covers an extended time horizon and draws from economics as well as engineering. Asset management incorporates the economic assessment of trade-offs between alternative investment options, both at the project level and at the network or system level, and uses this information to help make cost-effective investment decisions. The American Association of State Highway and Transportation Officials hosts a website on transportation asset management (http://www.nhi.fhwa.dot.gov/default.aspx) and has published a guide to asset management (http://downloads.transportation.org/AMGuide.pdf). The examples in the guide are predominantly oriented toward pavement and bridges, but the guide explicitly includes all transportation assets, including ITS assets. Figure 12 shows an example of the process to allocate resources for asset management.
The U.S. DOT Intelligent Transportation Systems Joint Program Office maintains an online knowledgebase of links to summaries that detail the benefits and costs of deploying various types of ITS, including those deployed for incident management. The web page also contains links to summaries of lessons learned and lists ITS deployments by type. The knowledgebase is available at http://www.itskrs.its.dot.gov/its/itsbcllwebpage.nsf/krhomepage#. In addition, the FHWA also houses its own Office of Asset Management, which has three key responsibilities:
The FHWA Office of Asset Management maintains an asset management website, which is available at https://www.fhwa.dot.gov/infrastructure/asstmgmt/asstfact.cfm. Resource UtilizationA complicating factor in TIM cost management is the fact that incident management is a multi-party function, typically involving, at a minimum, the State transportation agency, local police, and local fire fighters/EMS. The FHWA publication Traffic Incident Management Resource Management17 demonstrates the methods and benefits of adopting a multi-disciplinary approach to managing the resources for TIM. The document describes how the efficient and effective management of TIM resources relies on four key guidelines for resource utilization:
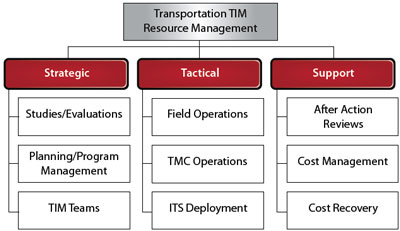
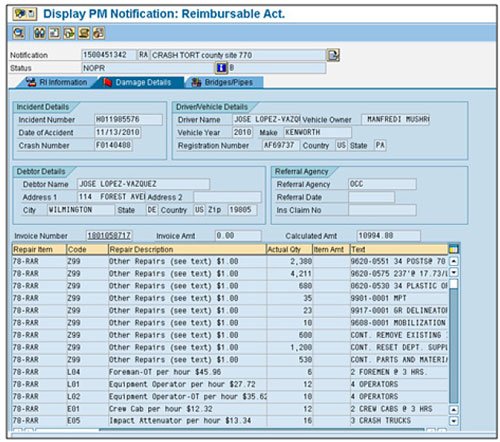
Moving towards a multi-disciplinary approach to TIM resource utilization may lower overall costs, but can increase costs for one or more agencies. Several options for cost-sharing arrangements to address this disparity exist. The Traffic Incident Management Resource Management guidebook explores these options in some depth, noting that, at present, most examples of multi-agency cost-sharing are limited to those in related domains outside of TIM, such as emergency management. The best examples that relate to TIM are the jointly managed traffic management centers (TMC) that exist in numerous metropolitan areas across the country. For many transportation agencies, providing stand-by personnel who are ready to respond to an incident at a moment's notice is difficult. Resource utilization is based on the amount of time that active resources are dedicated to a specific task, the number of times that stand-by resources have to be activated, and the duration of their activation period. Use Cost Center AccountingUse of the multi-disciplinary approach to TIM resource utilization would create a need to track costs closely, especially with transportation agencies. For this reason, implementing a "cost center" accounting practice is appropriate. This type of accounting can begin to be integrated into transportation agencies for capturing TIM costs from different divisions within the agency. This type of cost accounting will also be applicable as multi-disciplinary TIM resource utilization occurs. A cost center is defined as an area, machine, or person to whom direct and indirect costs are allocated. Each cost center is a distinctly identifiable department, division, or unit of an organization whose managers are responsible for all associated costs and for ensuring adherence to its budgets.19 Dividing an organization into cost centers helps the agency determine where its costs are incurred within the organization. Furthermore, if costs are planned at the cost center level, cost efficiency can be checked at the point where costs are incurred.20 Figure 13 breaks down transportation resource management into the Strategic (Planning and Preparedness), Tactical (Response), and Support (Recovery) Activities categories, with Cost Management and Cost Recovery opportunities housed under the Support category. Many examples of effective cost management exist, and, although several focus only on managing tactical costs, some current systems are capable of supporting cost center accounting practices. One example is from Pennsylvania. The Pennsylvania Department of Transportation (PennDOT) captures all reimbursable activities in their cost accounting system. PennDOT maintenance personnel who respond to crashes that involve damage to department property are required to fill out a form that describes the damage, the people liable for the damage, and an estimate of how much it will cost to restore the affected area to its previous condition.
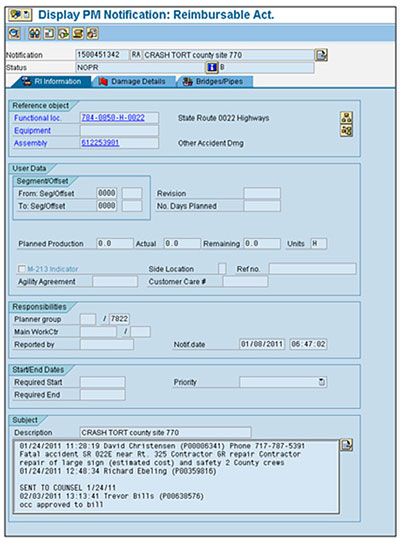
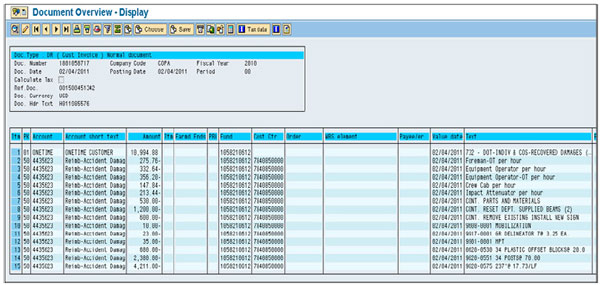
The forms shown here are used to capture the information filled out by maintenance personnel. Figure 14 shows the location data, identifies who is responsible for the follow-up work, and provides a description of what took place. Figure 15 shows which internal tracking number has been assigned to the event, when it occurred, information about the liable party, and a detailed estimate of what the needed repairs will involve. Costs are not shown as part of this screen because the prevailing rates for each pay item will be used at the time cost recovery action and/or litigation is pursued. Finally, Figure 16 shows a document overview of how the incident is tracked. Of particular interest in Figure 16 is the information shown in the box at the top of the screen. This shows that there are extensive electronic systems in place to manage the costs associated with repairing public property after a crash occurs. The money that is collected is deposited into the State's general fund account.
Performance MeasurementIn the future, performance measurement will be a fundamental aspect of doing business for any organization that receives funding from the Federal government in the years ahead. In addition, identifying opportunities to recover costs in the wake of reduced funding will help organizations make better informed decisions about how services can be provided. While not strictly "cost management," developing performance measures and making comparisons to TIM costs provide useful information to TIM managers and, perhaps more importantly, help to "sell" TIM to the public and those making funding allocation decisions. As with most transportation agency efforts, TIM must be able to show what benefit is being realized when compared to the cost being incurred. Performance measurement is a key component to being able to demonstrate the benefit of money spent. Understanding the costs of TIM through a cost management process that is linked to the performance result will ultimately become one of the key factors of cost-benefit analysis. An FHWA program called the "TIM Performance Measures Focus States Initiative" convened incident management professionals from 15 States to develop a set of commonly defined performance measures.21 The initiative identified and defined the following three core performance measures:
Producing these measures can be hampered by the need to share data across responder agencies, including law enforcement and fire protection; however, these performance measures are informative by themselves as stand-alone measures. They also can be combined with cost information to yield cost-effectiveness measures such as labor cost per minute reduction in roadway clearance time. FHWA's TIM Performance Measurement Knowledgebase is a highly usable, online reference that provides transportation professionals the knowledge and tools they need, including sample documents and models from other states, to encourage the successful implementation of program-level TIM performance measures in their state. The Knowledgebase can be found at https://ops.fhwa.dot.gov/eto_tim_pse/preparedness/tim/knowledgebase/ Beyond the cost-effectiveness analysis is the cost-benefit analysis, which compares the costs of a TIM program to a monetary valuation of its benefits. A number of agencies have produced cost-benefit analyses for an aspect of their TIM program, most commonly for service patrols. The calculated cost-benefit ratios have uniformly been greater than 1, indicating benefits exceed costs. The examples below show how monetized benefits include fuel cost savings and the value of travel-time savings. Measured benefits often include savings in costs (damages) related to secondary crashes and reduced pollutant emissions. "The California Life-Cycle Benefit/Cost Analysis Model (Cal-B/C) is an Excel workbook-based tool for preparing economic evaluations on prospective highway and transit improvement projects within the State of California. An extension to the model added the ability to evaluate certain ITS projects, include an incident management component. The ITS evaluation module uses the IDAS (ITS Deployment Analysis System) model, developed for the U.S. FHWA. IDAS is an ITS sketch-planning analysis tool that can be used to estimate the impacts, benefits and costs resulting from the deployment of ITS components. IDAS operates as a post-processor to travel demand models. The set of impacts evaluated by IDAS include changes in user mobility, travel time/speed, travel time reliability, fuel costs, operating costs, accident costs, emissions, and noise. The incident management component of IDAS is based on the application of a simplified set of benefits measures for three possible levels of incident management system deployment."22 "A vehicle queuing and traffic bottleneck analysis was applied to determine cumulative vehicle delays." The model is based on procedures provided in the Highway Capacity Manual and Traffic Incident Management Handbook (USDOT, 2000) and considers incident characteristics, roadway geometry, and traffic flow characteristics at the incident location to calculate the impact of each incident on vehicle queuing and delay. The results obtained from the model are then used to calculate cost of unproductive time, vehicle emissions, fuel consumption, and occurrence of secondary incidents attributable to analyzed primary incidents. The effects of the Maintenance Operations responding to incidents are calculated as a difference between the impacts of incidents with and without their response. The benefits of the response are therefore the differences in time, emissions, fuel consumption, and secondary incidents of the with-response versus without-response model results. The reduction in incident clearance time is modeled at levels ranging from one minute to 30 minutes. Applied over the 974 incidents in the study database, the one minute incident time savings translates into 16 hours of reduced incident time, with associated travel delay savings valued at over $555,000, plus an additional savings of $113,000 in fuel use, emissions, and accidents, for a total savings of over $668,000. The labor cost of using the maintenance operations staff to responds to these incidents was estimated at $510,000. The resulting benefit-cost ratio for a one-minute incident reduction time is thus 1.31."23 Contracting Emergency ServicesAnother approach to ensuring that TIM services are always available is for the transportation agency to contract with local emergency responder agencies for services as a cost-management strategy. By paying a retainer fee for services, performance can be guaranteed by contractual obligations and budgeting is clearer. An example would be the pre-positioning of contracted special equipment in advance of anticipated winter weather events or other weather-related scenarios. Freeway service patrols, when contracted, are also a cost-management strategy that has predictable costs for specific service periods. Use of these strategies can also help reduce the overall societal costs of TIM activities by improving incident response times and clearing lanes for operational reflow sooner.
|
|||||||||||||||||
|
United States Department of Transportation - Federal Highway Administration |
||