Traffic Incident Management Cost Management and Cost Recovery Primer
Chapter 2. Definitions
Cost Recovery
Costs are classified as being recovered when the program receives reimbursement from sources outside of the budget that is then used to fund the program. Understanding the difference between cost recovery and cost substitution is a key consideration. Cost substitution is simply replacing a portion of the budget used for incident response from another source within the same budget, for example moving funds between state agencies. Cost recovery would involve sources outside the Governors budget purview, such as costs recovered from federal grant sources, metropolitan planning organizations, or private interests.
Cost Management
Cost management allows us to view the cost-benefit relationship of various activities, setting the stage for more informed decisions. Cost management generally begins with an initial plan for costs, continues through cost tracking and analysis of the information collected, and includes evaluations and decisions based on information from the previous stages.
The four distinct stages described above are depicted in Figure 3. All of the stages are interdependent, and decisions in any stage will affect the system as a whole. The system is a closed loop, so the last stage leads back to the first stage. The four stages are described below.
- Cost Planning is simply estimating future costs and budgeting. Budgets are based on knowledge about historic costs that has been gained in large part from good tracking and analysis. Budgets for new activities or expansions may include detailed analysis of a capital purchase (e.g., equipment, software).
- Cost Tracking involves coding discrete activities and their associated costs or cost drivers, such as personnel time sheets, vehicle mileage logs, supplies purchases, and contract payments.
- Cost Analysis requires cost data processing to create cost information—information that will be useful in evaluation, decisionmaking, and planning. Analysis can produce any of a wide variety of measures across a number of dimensions, including time trends, percentages, and per-unit measures. Examples of static, per-unit measures include agency employee hours per incident and labor cost per incident. Examples of temporal analysis measures include trends in labor rates and trends in fuel costs. Examples of percentage measures include labor cost and fuel cost as a percentage of total operating costs.
- Evaluation and Decision. Cost information produced in the analysis stage is evaluated to support decisionmaking for future programming, resource allocations, and asset management; to support cost recovery mechanisms; and to support appeals to higher level decisionmakers for continued or enhanced funding. Subsequent chapters address these elements.
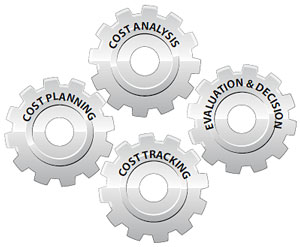
Figure 3 – Cost Management Fundamentals
A sound cost analysis approach can be a useful tool for performance management, revealing both ways to achieve a more cost-effect level of performance as well as opportunities to improve performance (e.g., incident clearance time) without increasing cost. Agencies may use a variety of cost analysis approaches, one of which is activity-based costing (ABC). ABC first became popular in the late 1980s in the manufacturing sector, eventually becoming of interest to financial and governmental sectors in the 1990s. ABC focuses on discrete processes (activities) and their specific costs, attempting to allocate both direct and indirect costs based on carefully determined process cost drivers. That is, ABC defines "cause and effect" relationships to assign costs objectively. The method can be particularly helpful in revealing "true" costs in instances where there is a great deal of indirect cost sharing (e.g., equipment with multiple uses).
The South Dakota Department of Transportation (SDDOT) implemented an ABC system as one component of a comprehensive management performance program known as "Collaborative Performance Management" (CPM). CPM helps the department run its operations "like a business." The agency credits CPM with significant improvements in performance, including millions of dollars of savings annually. One benefit of the CPM SDDOT managers have cost and other performance information at their fingertips. They use this business intelligence to reduce the cost of processes, lower the lifetime cost of ownership and operation of specific assets, monitor the effectiveness of the department's transportation services, maintain the knowledge base as senior staff retire, and prepare performance-based business plans and budgets. Says Roxanne Rice, Fiscal and Public Assistance Director of SDDOT, "We are able to show our stakeholders how we are doing, what we are doing, why we are doing it and what it costs the taxpayer."4
Identifying and Classifying Costs
Costs may be classified several ways. Costs can be either fixed, variable, or "mixed" ("semi-variable"). Another way to break down costs is into the "direct" or "indirect" categories. The classification scheme an agency uses will depend on the type of analysis, planning, or decisionmaking the agency is performing.
- Fixed costs are costs that typically do not change (in total) in response to changes in volume of activity. Examples include depreciation, supervisory salaries, and maintenance expenses. In reality, such cost elements may change with a change in the scale of the activity, although this would not typically occur in a 1-year analysis period. In microeconomics, a fixed cost (e.g., rent) is one that cannot be varied in the short run.
- Variable costs are costs that change in response to the changes in the volume of activity. We generally assume that the relationship between variable costs and activity is proportional. For example, if the volume of activity increases by 10 percent, then variable costs in total would be expected to rise by 10 percent. The labor cost of employees responding on the scene of an incident would be a variable cost that increases with the number of incidents.
- Mixed (or "semi-variable") costs are costs that contain both a variable cost element and a fixed cost element. An example is a vehicle rental that is billed at a base rate plus a per-mile charge.
The other common classification scheme for costs is direct versus indirect costs. Direct costs are costs that can be easily and readily linked to a specific activity, while indirect costs are those that cannot easily be linked to a single specific function or objective. The cost associated with setting up and operating a traffic management center is an example of indirect costs because the management center serves several functions, one of which is incident management. Other examples of indirect costs are the costs of supervisory staff, administrative support staff, and administrative support facilities.
Tracking direct costs is usually a straightforward process. It is in the tracking and allocation of indirect costs that agencies typically have most room for improvement. In some cases, indirect costs might not be allocated to some activities at all. In others, they may be allocated based on some rule of thumb that does not accurately capture the true linkages between the resource use and the activity. Proper tracking and allocation of direct and indirect costs is particularly important and difficult in the case where TIM functions are not housed in a dedicated department but rather are conducted and budgeted within a broader agency department or division, such as maintenance or ITS. In such situations, an ABC system offers the opportunity to provide improved cost information and promote more well-informed decisions about resource allocation.
In an activity-based cost system, the focus of interest is on the activities performed by a business or agency. For example, one activity associated with TIM is operating dynamic message boards. The ownership cost of the equipment (maintenance, communication costs and deprecation of the signs and the software) is a cost that should be divided among the various operations elements that use the signs, including construction and special events as well as incident management. In an ABC system, analysts first identify the cost driver for the activity. The cost driver is the unit of measure that most correlates with the resource cost of the activity. For dynamic message signing, the cost driver might be staff time at the traffic management center. In such a case, the indirect costs of the dynamic message signing activity would be allocated to the "cost objective" (i.e., incident management, construction work zone management, planned special events management) in proportion to the staff hours spent addressing each of these functions at the TMC. An alternative method of applying the cost driver is using the proportion of total time that the equipment is in use in the service of each of the activities' cost objectives. In the case of the signage, however, it may be more appropriate to keep the indirect costs broken down; software costs may correlate best with staff hours of application, while the signs themselves may correlate best with hours in use. In setting up an ABC system, designers will face the tradeoff of the costs of creating more detailed information like that described above to the benefits of better-informed decisionmaking. In fact, the chief criticism of ABC systems is that they can be costly to implement. In any case, managers may still improve cost management by applying some of the principles of activity-based costing, even if the agency does not choose to undertake the full implementation of an ABC system.
The U.S. Marine Corps implemented an Activity Based Costing system, using proprietary software from SAS, starting in 2000. Its aim was to determine the true costs of the services each based provided, to identify ways to increase efficiency and reduce costs. The ABC system saved the Marines about $89 million from 2000 to 2002, said Maj. Rod Brewster of the Marines' Center for Business Excellence at the Navy Annex in Arlington, Virginia. The Marine Corps' goal was ultimately to reduce the operating expenses of its bases by $634 million.5
Performance Measurement
Performance monitoring and measurement are critical in today's transportation agencies, and this monitoring extends to traffic incident management. A great deal of the focus of performance measurement for TIM is related to the incident timeline, as shown in Figure 4.

Figure 4 – Standard Incident Timeline for Performance Measurement
By examining the project delivery process as shown in Figure 12 of this document, an agency can make the connection between the timeline from Figure 4 to a TIM program.
With so much focus on implementing the NUG in TIM programs it is also useful to understand how each strategy from the NUG can be measured. The inputs, outputs, and outcome-based performance measures from the NUG are shown on the following pages.
It is important that the measurement of performance in each area of response activity is connected to the financial needs of any agency involved in that response. The study, implementation, and review of each activity have a cost. Some of the potential outcomes listed in Table 4 are associated with customer satisfaction and public perceptions and are therefore challenging to quantify. A more complete understanding of TIM activities from planning to preparedness to operation to measurement empowers analysts to make real budgetary decisions.
Table 4 – Input, Output, and Potential Outcome for a TIM Program by NUG Strategy
| NUG Strategy |
Input |
Output |
Potential Outcome for a TIM Program |
| TIM partners at the national, State, regional and local levels should work together to promote, develop, and sustain effective TIM Programs. |
- Written agreements
- Program definition
|
- Training requirements
- Meetings
|
- Customer satisfaction increased
- Negative public perception decreased
- Executive acceptance
|
| TIM responders should receive multi-disciplinary NIMS and TIM training. |
- Number of personnel to be trained
- Frequency of training
|
- Percentage of personnel trained
- Increased efficiency in incident verification
- Increased fiscal responsibility for dispatched services
|
- Improved communications and scene management
|
| TIM partners should work together to establish and implement performance goals at the State, regional and local levels for increasing the effectiveness of TIM, including methods for measuring and monitoring progress. |
- High level tasks
- Data-driven tasks
- Efficiency tasks
|
- Measures of performance at all levels of program
|
- Increased or decreased funding
- Improved data for analysis
- System, protocol, procedure needs, and verification
|
| TIM partners at the national, state, regional and local levels should work together for rapid and coordinated implementation of beneficial new technologies for TIM. |
- Concept of Operations
- Architectures
- Stakeholder needs
|
- Number of incidents responded to
- Efficiency of response
- Reduced incident response timeline
|
- Right-sized TMCs
- Increased efficiencies for interagency communication and coordination
- Increased funding
|
| TIM partners at the national, state, regional and local levels should join together to raise awareness regarding proposed policies and legislation that affect achievement of the NUG objectives of Responder Safety; Safe, Quick Clearance; and Prompt, Reliable Traffic Incident Communications. |
- Responder safety statistics
- Incident duration statistics
- Communication protocol architectures (human and system)
|
- Number of responders injured responding to traffic incidents
- Time to identify, verify, dispatch, clear, and return traveling conditions to normal
- Protocols for real-time communications
|
- Increased customer satisfaction
- Changes in responder safety protocols
- Memorandums of understanding
|
| Broad partnerships should be developed to promote public awareness and education regarding the public's role in safe, efficient resolution of incidents on the roadways. |
- Benchmark of customer satisfaction
|
- Percentage of customer satisfaction
- Increase in customer knowledge based on marketing principles
|
- Improved public perception of the DOT
- Reduced customer complaints
- Responder safety campaigns
- Quick clearance campaigns
|
| Recommended practices for TIM Responder Safety and for traffic control at incident scenes should be developed, and widely published, distributed and adopted. |
- Existing status of TIM responder practices
- National best practices
|
- Responder manuals
- Standard drawings for incident scenes
- Reduced infrastructure costs
- Reduced responder fatalities, injuries, and asset damage
|
- Benefits paid due to fatalities and injuries are reduced
|
| Drivers should be required to Move Over/ Slow Down when approaching traffic incident response vehicles and traffic incident responders on the roadway. |
- Laws
- Standards for delineation
|
- Reduced shoulder collisions
- Reduced rate of vehicle to responder collisions
|
- Improved safety of freeway service patrol and police responders
|
| Driver training and awareness programs should teach drivers how to react to emergencies on the roadway in order to prevent secondary incidents, including traffic incident responder injuries and deaths. |
- Revised driver training curriculum
- Secondary incident rates
|
- Reduction in incident durations
- Reduction in queues and back logs
|
- Increased driver awareness reducing program costs
|
| TIM partners at the state, regional and local levels should develop and adopt multidisciplinary procedures for coordination of TIM operations, based on national recommended practices and procedures. |
- Stakeholder agreements
- National bench marks
|
- More efficient coordination
- Meetings
|
- Cost sharing among agencies
- Better overall use of State resources
|
| TIM partners at the state, regional and local levels should commit to achievement of goals for traffic incident response and clearance times (as a component of broader goals for more effective TIM, see Strategy 3). |
- Incident timeline milestones and duration goals
- Stakeholder agreements
|
- Actual incident milestone durations
- Task durations
|
- Measured success and direct evidence of resources in use positive outcomes
|
| Traffic incident responders and resources should be available 24/7. |
- Hours of operations
- Resource types
|
- Money spent on resource availability
- Resource area of responsibility and coverage
|
- Increased customer satisfaction and reduced costs of mobility
- Determination of staffing and resource levels as they tie directly to customer service
|
| Traffic incident responders should develop and implement standardized multidisciplinary traffic incident communications practices and procedures. |
- Communication types
- Reliability
- Policies and procedures
|
- Training opportunities
- Enhanced protocols
- Communication inventories
|
- Systems and protocols that reduce the amount of lost time
- Maintaining current and efficient communication devices
|
| All traffic incident responders should receive prompt, reliable notification of incidents to which they are expected to respond. |
- Notification time latency
- Notification accuracy
- Stakeholder identification
|
- Percentage of time notification is beyond the notification goal
- Percentage of time notifications (inbound and outbound) are accurate
- Stakeholder satisfaction
|
- Systems and/or protocols to speed up notifications and enhance the accuracy of notifications
- Stakeholder relationships can be improved
- Resources can be used more efficiently
|
| State, regional and local TIM stakeholders should work together to develop interoperable voice and data networks. |
- Voice and data architectures from each stakeholder agency
|
- Multiagency voice and data architecture
|
- Appropriate technologies can be instituted to maintain or enhance communications
- Less lost time when new technologies are implemented
|
| National TIM stakeholders (working through the NTIMC) should work together to reduce the barriers to integrated broadband emergency communications systems development and integration (both wired and wireless). |
- Communication barriers
- Communication costs
- National comparisons
- Relationship with the NTIMC
|
- Communication plan
- Percentage of communications below national standards
- Gaps in communication
|
- Communication benchmarks
- Identification of overarching communication needs
- Implementation of communications to reduce lost time
|
| TIM partners should encourage development of more prompt and reliable traveler information systems that will enable drivers to make travel decisions to reduce the impacts of emergency incidents on traffic flow. |
- Customer satisfaction
- Traveler information portals
- Traveler information statistics
|
- Customer satisfaction with traveler information system and the aspects that support it
|
- Implementation of additional traveler information services and cancellations of ones that are not effective
- Refined protocols
|
| TIM partners should actively partner with news media and information service providers to provide prompt, reliable incident information to the public. |
- Stakeholder group identification
- Customer satisfaction
|
- Public-Private partnerships
|
- Favorable reporting by media partners
- Greater recognition of DOT Traffic Operations in promoting mobility
- Reduced recurring congestion levels
|
Previous |
Next