Operations Benefit/Cost Analysis Desk Reference
Chapter 2. Overview of B/C Analysis for Operations
What is B/C Analysis?
Benefit/Cost (B/C) Analysis is defined as a systematic process for calculating and comparing benefits and costs of a project for two purposes:
- To determine if it is a sound investment (justification/feasibility); and
- To see how it compares with alternate projects (ranking/priority assignment). (National Academies Transportation Research Board (TRB) Economics Committee.)
Benefit/Cost analysis is also commonly referred to as Cost-Benefit Analysis, CBA, Benefit/Cost Analysis, and BCA. The analysis is identical despite the naming differences. Benefit/costs analysis is one type of economic valuation – an analysis that assesses the relative value of a project in monetized estimates. As the name implies, benefit/cost analysis determines the value of a project by dividing the incremental monetized benefits related to a project by the incremental costs of that project. The result is called the Benefit/Cost Ratio and is often the primary output of the analysis process. This output may either be expressed as a ratio (2:1) or a resultant value (2). For example, a project producing $150,000 in benefits and costing $100,000 would result in a B/C ratio of 1.5:1 or 1.5 ($150,000 benefits/$100,000 costs). Projects determined to have B/C ratios greater than one are said to be Efficient investments; in that, each dollar invested in the project returns more than $1.00 in benefits. Projects determined to have a B/C ratio less than one are Inefficient investments since the costs of the project are greater than incremental benefits created by the project. Projects with a B/C ratio of exactly one – benefits are determined to be exactly the same as costs – are said to be At Cost Efficiency. (B/C ratios are nearly always positive, ranging from zero to 15 or higher for some TSM&O strategies. B/C ratios may be negative; however. A negative value indicates that the project is expected to generate greater disbenefits than actual benefits; meaning that on a net basis, the project would make conditions worse rather than better.)
Benefit/cost ratios can be used to compare the relative value of different projects. Various projects may be prioritized (in terms of economic efficiency), assessing each project individually and calculating the B/C ratio for each project. In comparing the various projects, those projects with the highest B/C ratio would be ranked as the most efficient.
A second common output measure from B/C analysis is a project Net Benefit. Net Benefit is determined by summing all benefits and subtracting the sum of all costs of a project. This output provides an absolute measure of benefits (total dollars), rather than the relative measures provided by B/C ratio. Net benefit can be useful in ranking projects with similar B/C ratios. Table 2-1 presents a hypothetical comparison of three projects showing the project monetized benefits, costs, B/C ratio, and net benefit. Based on B/C ratio in this example, Project 1 (having a B/C ratio of 4.0) would be ranked above Project 2 (B/C ratio of 1.5) and Project 3 (B/C ratio of 2.0). Although the relative comparison of B/C ratios shows that Project 1 is more efficient than Project 3, the absolute measure of net benefit is much higher for Project 3. Depending on the goals of the analysis (e.g., maximizing the efficiency of the investment or maximizing the total amount of the benefit), Project 1 or Project 3 could be ranked the highest.
Table 2-1 Comparison of Projects Using B/C Ratio and Net Benefit
 |
Project 1 |
Project 2 |
Project 3 |
| Benefits |
$200,000 |
$150,000 |
$400,000 |
| Costs |
$50,000 |
$100,000 |
$200,000 |
| B/C Ratio (Benefits/Costs) |
4.0 |
1.5 |
2.0 |
| Net Benefit (Benefits – Costs) |
$150,000 |
$50,000 |
$200,000 |
Benefits in a B/C analysis are calculated by estimating the incremental change in various MOEs and then applying an established value to the identified amount of change to monetize the benefit. MOEs can include a wide range of metrics depending on the anticipated impacts of the various projects being analyzed. The MOEs should be identified during the analysis set up, and should be sufficiently comprehensive to capture the full benefits (positive impacts) and disbenefits (negative impacts) of the identified projects. Chapter 3.0 provides additional detail on many of the traditional and nontraditional MOEs used in transportation operations benefit/cost analysis; however, typical measures often include:
- Travel time (and the reliability of travel time);
- Crashes;
- Fuel use;
- Nonfuel vehicle operating costs;
- Emissions/air quality; and
- Agency efficiency.
For many projects, there are often tradeoffs between positive impacts to some MOEs weighed against negative impacts to other MOEs. Both the benefits and disbenefits should be calculated and the total benefit for the project should represent the net effect. For example, a proposal to increase the speed limit on a roadway could result in a decrease in travel time for users (a benefit), but simultaneously could result in an increased crash risk (a disbenefit). The total benefit for the project should weigh both these impacts to fully capture the total project benefits.
Similarly, an individual MOE may be both positively and negatively impacted by a single project or strategy. For example, a project to implement a ramp metering systems along a corridor may be predicted to improve travel time along the mainline roadway; however, the travel times may be worsened on the actual on-ramp facilities due to the addition of the impedance of the ramp signal. The travel time benefit calculated for this project needs to take into account the net change in travel time between these off-setting impacts. Practitioners need to be careful in setting up their analysis to identify and fully capture all the network facilities impacted by the project in order to avoid overstating or understating benefits.
In selecting which MOEs to employ in an analysis, practitioners need to strive to capture the comprehensive impacts of their strategy; however, caution should also be applied to avoid double-counting particular benefits. The MOEs selected should be mutually exclusive. For example, if a project was predicted to reduce emissions, the analyst would not want to include both the benefit of the reduced emissions and the benefit of increased health for residents as a result of the emissions reduction. Presumably, the emissions benefits would already account for this health benefit; thus including both benefit measures would be double-counting.
Benefit/cost analysis for transportation projects is most typically forward looking, attempting to forecast the future changes in MOEs related to a potential project or collection of potential projects. Similar to many transportation-planning efforts, data needed to drive the future predictions of benefits are often obtained from travel demand or simulation models, or a variety of analysis tools capable of modeling changes in traffic performance. (Chapter 4 provides detailed discussion of many of the existing B/C analysis tools and methods currently in use.)
Although most typically predictive in nature, B/C analysis may also be backwards looking to quantify the benefits accruing from existing deployments. This evaluative B/C analysis is most often performed to estimate the relative benefit achieved through a prior deployment, often to provide additional justification for the value of continuing or expanding the project. These evaluations of existing projects typically rely on real-world data on the incremental impacts of the project, based on “before and after” comparisons of traffic performance both “with and without” the project, when available. Where empirical data is unavailable or unreliable, these evaluation B/C analyses may also rely on modeled data to fill critical information gaps. Chapter 5 provides additional discussion of the data needs and potential data sources related to B/C analysis of transportation operations projects.
Finally, depending on the particular needs of the assessment, B/C analysis may be conducted using a snapshot of traffic performance and project costs to estimate average annual benefits and costs. This average annual B/C is best used in situations where the relative benefits and costs are anticipated to be relatively stable over time. Other analysis may require the calculation of Net Present Value (NPV), which represents the sum of the stream of expected benefits and costs over a selected time horizon (e.g., 20 years). The stream of benefits and costs is discounted in future years to reflect the time cost of money (e.g., spending a dollar today is not the equivalent of spending a dollar five years from today). Chapter 5 presents an expanded discussion on the implications of the time horizon and of the time cost of money in generating NPV.
Once a B/C analysis is complete, the results may be displayed in many innovative ways. The format, structure, and content of the output display are determined by a number of factors, including the following:
- The purpose of the analysis (e.g., comparison of multiple projects or benefits estimation of a single project);
- The robustness of the analysis performed;
- The MOEs included;
- The desired output information;
- The intended audience (e.g., technical staff, policy-makers, public, media); and
- The needs of the project to be sensitive to other nonquantifiable benefits and issues.
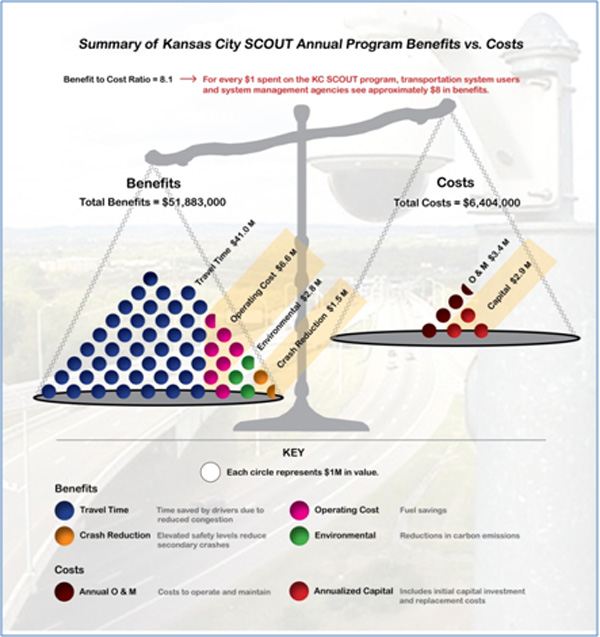
Figure 2-1 presents a sample display from a benefit/cost analysis conducted on the KC Scout program, which is the traffic operations system for the Kansas City metropolitan region. The display effectively presents the strong outcome of the analysis showing a B/C ratio of more than eight (or more than $8.00 in benefits for each $1.00 invested).
Figure 2-1. Sample Display of B/C Analysis Output
Subsequent discussions in this overview section provide additional introduction to benefit/cost analysis, including the following:
- Common terminology;
- How does B/C analysis differ from other economic impact analyses?
- What are considered “benefits”/what are considered “costs”?
- Who are the various stakeholders in B/C analysis?
Table 2-2 Common Terminology Used in the Desk Reference
| Term |
Definition |
| At Cost Efficiency |
A project determined to have exactly equal benefits and costs (B/C ratio equals precisely one). |
Benefit/Cost (B/C) Analysis
(Also known as Cost-Benefit Analysis, CBA, Benefit-Cost Analysis, or BCA) |
A systematic process for calculating and comparing benefits and costs of a project. |
| Benefit/Cost Ratio |
Measure calculated by dividing the incremental monetized benefits related to a project by the incremental costs of that project. May either be expressed as a ratio (2:1) or a resultant value (2). B/C ratios greater than one indicate that a project is efficient (benefits exceed costs). B/C ratios less than one indicate that a project is inefficient (costs exceed benefits). |
| Capital Costs |
The upfront costs of implementing a project or improvement, including planning, design, construction/installation, and equipment costs. |
Constant Dollars
(also known as Real Dollars) |
Presenting dollar value estimates of future costs and benefits that are expressed in terms of today’s (or a selected base year) prices. Constant dollars remove the effects of inflation over time to express constant prices compared with the selected base year. |
Current Dollars
(also known as Nominal Dollars) |
Presenting dollar value estimates of future costs and benefits in the year they will actually be incurred or received. Current year dollars will reflect price changes due to inflation over time. |
| Direct Benefits |
Those measurable benefits that may be directly attributed to the project investment. |
| Discount Rate |
The rate at which predicted cash expenditures (costs) or inflows (benefits) are reduced in future years to reflect the time cost of money. The purpose of the discount rate is to convert future values to present value. |
| Economic Impact Analysis |
The analysis of the comprehensive regional economic impact related to a project. More broadly considers multiplicative productivity, jobs, and income benefits caused by changes in transportation performance than considered in B/C analysis. |
| Efficient |
Projects determined to have benefits greater than their costs (B/C ratio greater than one). |
| End of Project Costs |
Costs necessary to close down temporary projects or any residual or salvage value of equipment at the end of the time horizon of the analysis. |
| Indirect Benefits |
Represent those regional production, employment, and income benefits attributable to the change in transportation system performance related to the project (considered in Economic Impact Analysis/not considered in B/C analysis). |
| Induced Benefits |
Represent those regional economic impacts related to increased regional income being re-spent in the local economy (considered in Economic Impact Analysis/not considered in B/C analysis). |
| Inefficient |
Projects determined to have benefits less than their costs (B/C ratio less than one). |
| Measure of Effectiveness (MOE) |
Metric used to evaluate the level of impact of a project. |
| Net Benefit |
The sum of a project benefits minus the sum of the project costs. |
| Net Present Value |
The sum of the discounted stream of expected benefits and costs over a selected time horizon. |
| Operations and Maintenance (O&M) Costs |
The continuing costs necessary to keep the project performing as planned, including items, such as power, communications, labor, and routine maintenance. |
| Replacement Costs |
The cost of replacing equipment that reaches the end of its useful life during the time horizon of the analysis. |
| Time Cost of Money |
The impact of time on the value of future benefits and costs. Money spent or earned today is more valuable than the same amount of money promised in a future year since the money earned today can be invested and earn additional revenue in the interim years. Therefore, benefits and costs accruing in later years of an analysis are often valued at a discounted rate. |
| Transfers |
Occur if one group or segment of the population enjoys a new benefit, but does so at the expense of a new disbenefit or additional cost accruing to another group. |
How does B/C Analysis Differ from Economic Impact Analyses?
Benefit/cost analysis is often confused with Economic Impact Analysis, which serves to identify and monetize the full potential regional or national level economic benefits of a project, including changes in regional productivity, employment, and income. B/C analysis is defined differently, however, as the benefits and MOEs selected for any given analysis should represent the benefits accruing to users of the project as well as benefits to society at large. The real difference between these types of analyses has to do with the measures on which they focus. B/C analysis focuses on a summary measure of net benefit to society. Economic Impact analysis focuses on measures of impact on economic indicators, such as aggregate employment or real GDP, none of which serve as a summary measure of societal benefit.
Direct benefits, considered in B/C analysis are those measurable benefits that may be directly attributed to the project investment. B/C analysis does not consider broader indirect and induced benefits to the regional or national economy. Indirect Benefits represent those regional production, employment, and income benefits attributable to the change in the direct impact. Induced Impacts are related to the multiplicative affects of the re-spending of new income within the region, resulting from increased regional production or employment. Indirect and induced impacts are considered in economic impact analysis, which considers these broader regional economic impacts as shown in Table 2-3.
Table 2-3 Comparing B/C Analysis with Economic Impact Analysis
| Type of Benefit |
Direct Benefit |
Indirect Benefit |
Induced Benefit |
| Example of Benefit |
Reduction in corridor travel times. |
New businesses are attracted to the corridor by the improved corridor performance. |
Employees of the new businesses spend their incomes at other regional businesses. |
| Considered in B/C Analysis |
Yes |
No |
No |
| Considered in Economic Impact Analysis |
Yes |
Yes |
Yes |
The subsequent section provides additional detail on the benefits and costs used in B/C analysis.
What are Considered “Benefits”/What are Considered “Costs”?
Benefits
Within B/C analysis of transportation Operations projects, the “benefits” represent the monetized estimates of the changes in the MOEs identified for the project that are directly attributable to the project investment. These benefits may accrue to the transportation system users (e.g., travel time savings, reduction in crash risk, decreased operating costs); the deploying agency (increased agency efficiency); or society at large (reductions in emissions). The benefits may be either positive (e.g., a net decrease in travel time) or negative (a net increase in travel time) in value. Negative benefits are known as disbenefits.
Some B/C analysts improperly assign negative benefits (e.g., an increase in the amount of emissions) to the cost half of the B/C equation (denominator); however, as discussed below, the cost measure should exclusively represent the investment necessary to implement and operate the improvement. All changes in MOEs should be valued and accounted for in the benefit (numerator) portion of the equation. This may include changes in agency efficiency (measured in reduced agency costs) or productivity as well. For example, if a transit agency deploys a transit vehicle Automatic Vehicle Location (AVL) system to track and record the real-time location of buses, the agency may predict an efficiency gain because it will no longer have the need to conduct some manual data collection activities. The cost savings associated with the elimination of the manual data collection should properly be treated as a change in benefits; not a change in costs, as it is a direct result of the project. Chapter 3 provides an expanded discussion of MOEs and benefits used in assessing transportation Operations projects.
Costs
For analyzing TSM&O projects, it is recommended that “Costs” or the denominator value in B/C analysis represents the life-cycle costs of implementing and operating the project. This is important for TSM&O projects since they typically incur a greater proportion of their costs in years after deployment to operate and maintain the system, and replace obsolete equipment, when compared to more traditional improvements. These life-cycle costs represent:
- The upfront Capital Costs of implementing the project or improvement, including planning, design, construction/installation, and equipment costs;
- The continuing O&M Costs necessary to keep the project operational, including items, such as power, communications, labor, and routine maintenance (excludes replacement costs);
- The Replacement Cost of equipment that reaches the end of its useful life during the time horizon of the analysis;
- The End of Project Costs necessary to close down temporary projects or any residual or salvage value of equipment at the end of the time horizon of the analysis.
These project life-cycle costs should include an accounting of all public-sector and private-sector costs, if applicable. Chapter 5 provides additional detail on identifying and estimating the costs associated with a project. In addition, the TOPS-BC application supporting this Desk Reference has the capability to estimate life-cycle costs associated with many types of TSM&O strategies. The use of these capabilities is discussed in the TOPS-BC User’s Manual.
Who are the Various Stakeholders in B/C Analysis?
There are three general categories of stakeholders to which project benefits and/or costs may accrue in a B/C analysis. These include:
- The direct users of the transportation system;
- Society at large; and
- The deploying agency or entity.
In many cases, benefits may impact more than one stakeholder group. For example, a project that results in a reduction in the number of fatality crashes would clearly be a benefit to the users of the project, as they would be able to directly reduce the risk of pain and suffering for themselves and their families. Society at large could also be expected to benefit, however, from the reduction in fatality crashes. Fatality crashes result in a loss of a productive member of the community; a loss of resources; and a loss of the community’s investment in the crash victim (e.g., investments in the individual’s public education). Therefore, there are broader societal benefits, in addition to the user benefit, that may accrue from a project that reduces the number of fatality crashes.
Project costs may also be shared by multiple stakeholder groups. For example, an automated toll payment collection system may require users to purchase an in-vehicle transponder in order to use the system. The private-sector cost of the transponder purchase may be included in the overall project cost value used in the B/C analysis.
Figure 2-2 presents a general summarization of the stakeholder groups and how the various benefits and costs most typically are distributed.
Figure 2-2. Typical Benefits and Costs Distribution among Stakeholder Groups
How is B/C Analysis Used in the Operations Planning Process?
B/C analysis provides several capabilities that are key in supporting different planning needs throughout the Operations planning process. B/C analysis is typically performed to provide one or both of the following capabilities:
- To determine if a project represents a sound investment (e.g., that the benefits of the project outweigh the costs – and to what degree); and
- To compare alternative projects to identify the most efficient projects for ranking/prioritization purposes.
These capabilities are invaluable in supporting planning activities throughout the entire cycle of the Operations planning process. As discussed in subsequent sections, the robustness of the B/C analysis may be scaled to fulfill different needs within the planning cycle. B/C analysis may be performed at a simple sketch-planning level to provide order of magnitude estimates of benefits and costs appropriate for early screening of projects, but also may be made much more rigorous to meet the more detailed analysis demands of later project prioritization or design activities.
Subsequent sections provide additional detail on the Operations Planning Process and the role of B/C analysis in supporting this process.
U.S. DOT Planning for Operations Initiative
Recently released guidance from the U.S. Department of Transportation (DOT), the FHWA Planning for Operations initiative introduces the Operations planning process as follows. (Advancing Metropolitan Planning for Operations: An Objectives-Driven, Performance-Based Approach – A Guidebook, 2010)
“Planning for operations” is a joint effort between planners and operators to support improved regional transportation system management and operations. This term encompasses a variety of activities that lead to improved transportation system operations, including the consideration of TSM&O strategies in the transportation planning process. Planning for operations also includes collaboration among transportation system operators, transit agencies, highway agencies, toll authorities, local governments, and others to facilitate improved transportation system operations and to ensure that transportation services are delivered in as safe, reliable, and secure a manner as possible. Often times, this collaboration is carried out in the context of a regional planning agency and is connected to the planning for operations process.
Planning for operations in the metropolitan transportation planning process means developing operations objectives to direct the consideration of operational performance during the planning process, and incorporating operations solutions into investment decisions that support the operations objectives. This approach ensures that operations needs are addressed in regional planning and investment decisions.
Operations managers are engaged in the planning process so that system performance concerns or challenges and potential operations strategies inform and influence the development of the metropolitan transportation plan. Operator involvement further ensures that operations informs and influences the planning process so that operations considerations are reflected in regional transportation plans. This results in a mix of operations and capital projects that optimizes transportation system performance.
Relationship of B/C Analysis to Objectives-Driven, Performance-Based Approach to Planning for Operations
In order to develop a planning for operations process that is objectives driven and performance based, the approach should include the following elements:
- Developing one or more goals within the Metropolitan Transportation Plan (MTP) that focus on the efficient management and operation of the transportation system;
- Developing regional operations objectives for the MTP – specific, measurable statements of performance that will lead to accomplishing the goal or goals;
- Implementing a systematic approach to developing performance measures, analyzing transportation performance issues, and recommending TSM&O strategies;
- Selecting M&O strategies (within fiscal constraints and to meet operations objectives) for inclusion in the MTP and transportation improvement program (TIP);
- Implementing M&O strategies, which may include investments and collaborative activities; and
- Monitoring and evaluating the effectiveness of implemented strategies and tracking progress toward meeting regional operations objectives.
The approach is iterative with monitoring and evaluation used to refine and adjust operations objectives over time. (Advancing Metropolitan Planning for Operations: An Objectives-Driven, Performance-Based Approach – A Guidebook, 2010) Figure 2-3 presents this process graphically.
Figure 2-3. Objectives-Driven Planning for Operations Approach
Source: Advancing Metropolitan Planning for Operations: An Objectives-Driven, Performance-Based Approach – A Guidebook, 2010.
The capabilities of B/C analysis are critical in supporting many of the steps in this objectives-driven approach. Guidance provided in Chapter 3 of the Desk Reference on the benefits of operational strategies may be useful in identifying suitable regional objectives and performance measures that may be used to assess the degree in which strategies meet these objectives.
As previously mentioned, the robustness of the B/C analysis may be scaled to fulfill different needs within the planning approach. The early screening and identification of TSM&O projects that meet the identified objectives may be performed using a simple sketch-planning-level B/C analysis to provide:
- Order of magnitude estimates of benefits and costs appropriate for early screening of projects; and
- A systematic process to winnow out the most promising projects to carry forward in the planning and analysis process.
As the planning process continues into project prioritization phases to rank projects for inclusion in the MTP, the B/C analysis methods may be enhanced to provide greater confidence in the outputs and the ranking of evaluated projects. This analysis may additionally provide benefit and cost information that can be used as justification for funding the TSM&O project in the TIP. These analysis methodologies may be further enhanced, introducing rigorous analysis and data from detailed microsimulation models and/or real-time archived data systems to support the needs of practitioners, as the prioritized projects enter the design process and implementation steps.
Finally, B/C analysis can support the monitoring and feedback needs within the planning cycle by allowing for the assessment of deployed strategies in order to provide justification for expansion of promising applications, as well as supplying enhanced data on project benefits that may be fed back into the approach and used in future analysis of similar projects.
B/C Analysis can be Used to Compare Operations Projects One With Another, or Provide a Level Playing Field to Compare Operations Projects with Other Travel Demand Management or Capacity Projects
One of the greatest strengths of B/C analysis is that it provides a level playing field for comparing projects that may be very dissimilar. The systematic process of B/C analysis, when performed correctly, allows for widely varying projects that impact different MOEs to be compared head-to-head on an apples-to-apples basis. The monetization of the benefits, compared with the total project costs, provides a common basis that allows for this even comparison of the effectiveness.
The capability of B/C analysis to provide this level playing field comparison is what allows for the comparison of widely varying project types, such as a roadway widening, a new transit line, a signal timing project, and an employer-based travel demand management program; all within the same analysis structure. All of these projects would be expected to impact the transportation system in different ways – some would serve to increase capacity, others would lessen demand, some may promote a mode shift, others would serve to smooth traffic flow – therefore, it would be difficult to select a single evaluation metric (e.g., travel time, safety, emissions, fuel use, etc.) to effectively compare and rank the projects. The comprehensive evaluation structure of B/C analysis includes the full range of potential impacts for all projects; and allows for the cross-comparison of the differing projects by monetizing the benefits, in terms of the value of the combined benefits to society and the agency, thus, providing a common reference for prioritizing the potential investments based on the relative efficiency of each project.
Of course, B/C analysis can also be used to compare and rank very similar projects. For example, an agency may have the need to evaluate several traffic signal coordination projects in order to determine which particular corridors would provide the greatest benefit. In this case, a relatively simple B/C analysis could be conducted by identifying those key measures most likely impacted by this type of deployment (e.g., travel time, travel time reliability, fuel use, and emissions); and then collecting data or modeling scenarios to estimate the impact of the strategy on the individual corridors. The changes to the MOEs would then be monetized for the various corridors by applying an established value to the incremental change. The monetized benefit would then be compared with the cost for each corridor, allowing for the identification of the most efficient corridors (highest B/C ratio).
Comparing different projects with different likely impacts may often be more complicated than comparing similar projects with similar impacts. For example, comparing a roadway-widening project with a freeway service patrol – traffic incident management program would provide some analysis challenges due to the significant differences between the two strategies, for example:
- The roadway widening project would add base capacity to the roadway and presumably serve to improve average or recurring conditions, perhaps mitigating a bottleneck location. The additional capacity could result in additional traffic being attracted to the facility, possibly impacting (positively or negatively) the number of crashes, emissions, and fuel use in the corridor. The improvement in baseline capacity provided by the roadway widening project would be available on a 24/7 basis.
- Meanwhile, the traffic incident management program would have a much less substantial impact on recurring, everyday conditions, but could have significant impacts during nonrecurring incident conditions. This would likely result in a greater impact on the reliability of travel time in the corridor, as opposed to the impact on average recurring travel times. Likewise, the traffic incident management program would be less likely to directly impact the number of crashes occurring in the corridor (outside of the possible reduction in secondary crashes occurring in incident-related traffic queues), but may help to reduce the severity of some crashes due to faster response times. The benefits provided by the incident management would only accrue when the strategy was being operated (perhaps only during peak weekday commute hours), and when incidents had occurred.
The wide variation in the types of benefits of these two projects, combined with when the benefits are incurred (during everyday recurring conditions or during unique nonrecurring conditions) adds significant complexity to the analysis.
Due to the current transportation improvement funding environment, transportation planners and Operations personnel need to make these types of comparisons between more traditional infrastructure projects and Operations-oriented strategies, since these different projects are often competing for the same funds. Therefore, it is often increasingly necessary to prioritize and rank widely varying project types. Fortunately, B/C analysis provides a framework that may be adapted to the challenges of this analysis need. In setting up these analyses comparing differing project types, more care and effort are often required in setting up the analysis in order to:
- Identify the comprehensive set of MOEs that may be impacted by the range of the varying projects. Not all varying projects may impact all of the MOEs, but it is critical to identify the full range of benefits in order to provide a meaningfully comprehensive analysis. Likewise, the identification of MOEs should not only consider measures that are likely to be positively impacted (e.g., reduction in the number of crashes), but also those measures that may be negatively impacted (e.g., increase in fuel consumption).
- Identify the sources of data necessary to support the estimation of impacts on the identified MOEs. Analysts should strive to identify sources of data that are equally applicable to all the different project types, wherever possible.
- Identify the analysis methods and/or modeling techniques/platforms that will be used to estimate the incremental impacts on the identified MOEs. Some traffic modeling methods may be appropriate for analyzing some types of projects, but not others. For example, travel demand models are intended to evaluate changes in travel demand and system capacity. As such, a travel demand model would be ideal for evaluating the roadway widening project example above; however, since most travel demand model’s analyses are based on an “average travel day” that is generally free of crashes and traffic incidents, it is less well suited to assess the impacts of the incident management program example. Whenever possible, a common analysis approach and tool should be utilized to avoid introducing bias caused by differing tool/methods.
- Establish the values (dollar amounts) that will be applied to the incremental change in MOEs in order to monetize the benefit. When using B/C to compare similar project types, it is less important to establish the values that are applied to the changes in MOEs, as all projects would be expected to impact the same MOEs, therefore, any change in a benefit valuation would create a relatively equal change in all the project analysis outcomes. When evaluating widely varying types of projects, however, it is much more critical to establish accurate and justified benefit valuations, since not all projects will impact all the different MOEs; thus, an over- or underestimation in one benefit valuation could greatly skew the output results for one or a few projects relative to others in the analysis.
All of these analysis requirements need to be carefully considered in order to provide an accurate comparison and avoid introducing bias into the B/C analysis. Subsequent sections of this Desk Reference provide additional detail to be considered when making these analysis set-up decisions. Chapter 3 provides a discussion of the impacts and MOEs associated with various types of TSM&O strategies. Chapter 4 provides an expanded discussion and comparison of various types of existing analysis tools and methods. Chapter 5 provides an expanded discussion of the benefit valuations that may be used in conducting B/C analysis for TSM&O strategies.
Case Study – Cincinnati Region ARTIMIS Study
The Ohio-Kentucky-Indiana (OKI) Regional Council of Governments, the Metropolitan Planning Organization (MPO) for the Cincinnati, Ohio region, recently had the need to assess the benefits of their regional traffic management and traveler information program, known as ARTIMIS. The ARTIMIS program is responsible for deploying and operating a number of TSM&O strategies in the region, including the following:
- Regional Traffic Operations Center;
- Traffic Surveillance (camera and loop detection);
- Incident Management and Freeway Service Patrols;
- Traveler Information (Regional 511); and
- DMS and HAR, among other applications.
Many ARTIMIS applications had been successfully applied to many of the key freeway corridors located within the region’s suburban beltway network by the earlier 2000’s; however, there was an increasing need to expand these capabilities’ key sections of the beltway and to remaining radial freeways. Figure 2-4 shows the ARTIMIS expansion plans. In order to complete this expansion, the ARTIMIS program would need to compete directly for scarce funding with many more traditional roadway capacity enhancement projects, and would need to provide additional justification to decision-makers on the benefits of the program in order to secure the necessary support and funds in the regional transportation plan (RTP) and TIP.
Figure 2-4. ARTIMIS Program Expansion Plans
In response to this need, OKI launched an evaluation project to estimate the benefits and costs of the ARTIMIS program; and to compare these relative to other more traditional capacity improvement projects proposed for the region. In order to provide comparable benefits and costs within the analysis, OKI carefully selected key MOEs to fully capture the benefits of the traditional and Operational projects. These measures included:
- Mobility (travel time and travel time reliability);
- Safety;
- Fuel Use; and
- Emissions.
The next step was to select the appropriate analysis tools and methods. OKI weighed several alternative methods, but eventually selected a combination of their regional travel demand model merged with the Intelligent Transportation Systems (ITS) Deployment Analysis System (IDAS) software. The linking of these methods provided the needed:
- Analysis consistency, since the basis for the analysis of both the traditional projects and Operations strategies was the traffic conditions data from the regional travel demand model; and
- Analysis rigor, since the IDAS tool enabled the estimation of additional MOEs (particularly travel time reliability and crashes) not available directly from their travel demand model.
The analysts next reviewed the default parameters used in the analysis for consistency with their local conditions. In particular, OKI made several adjustments in the model assumptions regarding:
- The projected reduction in incident clearance time was modified based on data gathered during a previous evaluation of the ARTIMIS incident management system;
- The assumed market penetration rates for their traveler information system were modified based on internal marketing surveys;
- The benefit valuations were modified to be consistent with standard values typically used for B/C analysis in the region; and
- Estimated costs in the model were replaced with actual costs based on procurement records.
The results of the B/C analysis showed the existing ARTIMIS program to be an extremely efficient investment returning a B/C ratio of 12:1, meaning that the program was generating $12 in benefits for every dollar invested. This finding itself provided strong justification for the regional investment in the program. The evaluation further compared the ARTIMIS program with several more traditional capacity expansion projects in order to provide a relative ranking of the projects. Table 2-4 shows selected measures, benefits, and costs of expanding the ARTIMIS program compared with a single corridor roadway widening project.
Table 2-4 Comparison of ARTIMIS Operational Projects with a Traditional Roadway Widening Project
| Selected Measure |
ARTIMIS |
Added Lane Project |
| Miles of improvements |
88 |
10 |
| Fatality accidents |
-3.2% |
+0.3% |
| Mobility (time savings) |
500 Hours |
800 Hours |
| Travel time reliability saving |
6,900 Hours |
5,800 Hours |
| Emissions |
-3.6% to -4.5% |
+0.3% to +1.4% |
| Estimated Annual Benefit |
$53 Million |
$35 Million |
| Total Project Cost |
$40 Million |
$800 Million |
| Benefit/Cost Ratio |
12:1 |
1.1:1 |
The benefit/cost information and project prioritization provided by the analysis were presented to decision-makers and the public through an outreach campaign. The results, made more relevant by the fact that they were generated through a valid and systematic process, were extremely valuable in making the case for investment in ARTIMIS in the region. The ARTIMIS expansion and enhancement project was identified as a high-priority project in the transportation plan and provided funding through the TIP process.
How can B/C Analysis for Operations Strategies be Integrated with B/C Analysis for Other More Traditional Strategies
B/C analysis has long been applied in the planning process to evaluate and prioritize investment in traditional capacity enhancing strategies, whether it be investments in highways, bus transit, rail transit, or other infrastructure element (e.g., bridges). More recently, the use of B/C analysis has been expanded at many agencies to examine the effectiveness of other less capital investment types of strategies, such as maintenance levels, replacement cycles, and various transportation programs and policies.
The use of B/C analysis for assessing TSM&O strategies is also a more recent addition as increased competition for funding and the accompanying need to provide greater justification for projects have driven the call for systematic processes that can be used to objectively weigh the relative benefits and costs of various projects, as well as provide meaningful analysis of projects that may differ greatly in their scope, intended outcomes, impacts on the transportation system, and costs.
Due to the long-time use of B/C analysis for more traditional infrastructure project assessment, many regions and states already have established procedures for conducting B/C analysis. These procedures may range from simple guidance on which MOEs to use, to detailed analysis frameworks, specified performance measures, and standardized benefit valuations to be applied. Therefore, except in situations where the analyst is only attempting to compare different TSM&O strategies with each other, care should be taken to be as consistent as possible with the established B/C analysis guidelines and procedures in order to provide for meaningful comparability of results. This consistency will ensure that the TSM&O strategies may be effectively and accurately compared and prioritized alongside more traditional infrastructure investments without risking the overstating or understating of benefits due to the analysis methodology itself.
The issue with maintaining this consistency with established B/C procedures designed for analysis of more traditional infrastructure projects is that the existing procedures may not be entirely appropriate for analysis of TSM&O projects. Analysts should be aware that existing agency procedures or guidelines may serve to limit the full, comprehensive assessment of the benefits of TSM&O strategies in one or more of the following ways:
- Existing MOEs may not be sensitive to the unique benefits of TSM&O strategies – Many established B/C frameworks, designed for more traditional capacity infrastructure projects, may not include assessment of some of the key benefit areas often provided by TSM&O strategies, such as improvements in travel time reliability or improved agency efficiency.
- Specified analysis data may be inappropriate for assessment of TSM&O benefits – Existing guidelines or procedures requiring the use of particular datasets (e.g., Highway Performance Monitoring System (HPMS) data, traffic counts, etc.) as inputs to the analysis may result in a bias against TSM&O strategies, unless the data is appropriate to the strategy being analyzed. For example, many traditional traffic count datasets only represent time periods free of incidents and inclement weather. Using this data as the basis for assessing the impacts of an incident management system or a weather information system would likely result in the severe underestimation of true benefits.
- Required analysis methods, tools, or models may not be capable of capturing the full benefits of the TSM&O strategies – For example, some regional B/C guidelines may specify that the established regional travel demand model be used as the basis for the traffic impact analysis. However, many regional travel demand models are focused on average traffic conditions, and may be inadequate for assessing TSM&O strategies focused on incident, construction work zone, or inclement weather conditions; or may not be sufficiently sensitive to travel costs to assess pricing options.
- Cost estimation parameters and framework may be inadequate – Many traditional infrastructure projects have large upfront capital costs required for construction and implementation, and then much smaller continuing O&M costs spread over a long project life (e.g., 30 years). Many TSM&O strategies, on the other hand, have much smaller capital outlays required for implementation, but proportionately higher continuing O&M costs. TSM&O strategies also typically utilize equipment with much shorter useful life cycles (e.g., sometimes as short as two to five years) than traditional infrastructure projects. The cost estimation framework in existing B/C analysis procedures designed around long-term capacity enhancements may not be sensitive to the quick equipment replacement cycles and continuing O&M costs associated with many TSM&O strategies.
While many regions and agencies have made significant efforts to enhance their existing regional B/C guidelines and policies in recent years to be more compatible with TSM&O analysis needs – including the incorporation of new MOEs (e.g., travel time reliability); updates to modeling and analysis tool capabilities; and the inclusion of automated archived data – Operations analysts should still be aware of these potential constraints of utilizing existing frameworks, datasets, modeling tools, and cost parameters.
The following are advantages of using the existing B/C analysis structure:
- Consistency with established procedures;
- Promotes the comparability of results; and
- Uses a vetted process that is familiar to planning staff and decision-makers.
Therefore, analysts looking to estimate the benefits and costs of TSM&O strategies should attempt to work within the existing structure and policies to the degree possible, but should remain flexible, when necessary, to avoid the understatement of TSM&O benefits due to an inadequate analysis structure. When these situations are encountered, the TSM&O analysts and managers should seek resolution through possible efforts, such as:
- Encouraging the regional adoption of objectives and performance measures that are sensitive to the unique benefits of TSM&O strategies.
- Identifying or developing new traffic datasets, or the development of systems to capture those data (e.g., archived data systems), that provide the needed input required for TSM&O strategies.
- Encouraging or developing enhancements to the existing regional modeling capabilities to better allow the analysis of the specific traffic impacts of TSM&O strategies, or encouraging the adoption of new modeling platforms and techniques to provide this analysis capability.
- Promoting changes to the existing regional analysis framework, parameters, and benefit valuations to be more applicable to TSM&O strategies; and improving the consistency and comparability of analysis results between TSM&O and more traditional infrastructure investment projects.
The sections below provide discussions of several specific phases of the planning process, where opportunities for comparing and prioritizing TSM&O strategies alongside more traditional strategies most often exist; and explore issues that the TSM&O analyst should be aware of when conducting these activities.
Project Screening
Project screening provides the initial assessment of the viability of various projects. Usually, this process is performed at an order of magnitude assessment level, not to specifically rank projects in any absolute order, but instead to provide a general categorization of projects (e.g., high, medium, or low priority) or winnow out projects likely to not be efficient, so that scarce planning resources can be focused in later phases on those projects more likely to provide the greatest benefit.
This analysis for TSM&O projects is often performed using sketch-planning analysis tools or readily available methods and data. The TOPS-BC tool, developed to support this Desk Reference, maintains the ability to conduct screening-level B/C analysis for many Operations strategies, and is described in the tool’s User’s Manual. Chapter 4 presents additional discussion of other sketch-planning tools and methods appropriate to the project screening task.
Analysts should take care in evaluating TSM&O strategies alongside more traditional improvements to ensure that the MOEs used in the analysis are appropriate to the strategy (see Chapter 3 for more information on the likely impacts of TSM&O strategies); and are consistent to the degree possible for the traditional and the TSM&O strategy. The input data and the tool/method used for analysis should also be made as consistent as possible to avoid introducing bias to the analysis.
Project Prioritization
The project prioritization process often requires more robust analysis than required during the preliminary project screening process. As such, project prioritization is more likely to include the analysis of project impacts using more rigorous and complex analysis tools and methods. Analysis of traditional infrastructure projects is often conducted using the regionally accepted travel demand model. As discussed above, however, regional travel demand models may present challenges to the assessment of any strategies designed to have greater impact during periods of incidents, inclement weather, or construction activity. Therefore, it is critical to be aware of these limitations and modify the travel demand model analysis to better incorporate these impacts (see Chapter 5 for additional discussion), or consider other compatible methods or combinations of methods that may better support the analysis. The analysis tools used will likely provide the majority of the data input into the actual B/C analysis framework for monetization of benefits and the comparison with project costs, so it is critical that the base analysis tools and methods used are compatible with the unique impacts of TSM&O strategies.
Similar to project screening, it is also critical that the MOEs selected and the data identified for input into the analysis are consistent with the needs of TSM&O analysis. Failure to properly consider these issues could result in an understatement of TSM&O strategies in comparison to more traditional capacity improvements.
Congestion Management Process
The congestion management process (CMP) is a systematic approach applied in a metropolitan region to identify congestion and its causes, propose mitigation strategies, and evaluate the effectiveness of implemented strategies. The CMP then recommends projects and strategies for the plan and transportation improvement program (TIP). In many metropolitan areas, the CMP is one of the primary avenues for planning for operations. In the CMP, system performance issues are systematically examined and management and operations strategies are often included in the set of solutions recommended to address congestion. The CMP, guided by specific objectives and integrated into the planning process, is an example of this systematic approach. In some regions, the objectives-driven, performance-based approach for integrating operations into the plan may be performed within the CMP. (Advancing Metropolitan Planning for Operations: An Objectives-Driven, Performance-Based Approach – A Guidebook, 2010)
For many regions, the CMP is the focus of activities designed to fully consider and integrate TSM&O strategies alongside more traditional transportation capacity projects. The TSM&O analysts and managers should strongly coordinate with the CMP process to ensure that TSM&O sensitive MOEs are considered, and that any analysis structure established within the CMP to assess and compare the relative effectiveness and efficiency of various strategies in mitigating the identified regional deficiencies.
Additionally, many times within the CMP process, the opportunity exists to move beyond the analysis of individual strategies and evaluate various combinations of strategies and their effectiveness in mitigating deficiencies and providing efficient management and operations of the transportation system. This opportunity may require the analysis of combinations of different types of TSM&O strategies, as well as the combination of TSM&O and more traditional strategies, to provide a synergistic effect. The combinations of strategies may present analysis complexities. While many traditional capacity enhancing strategies have been in use for years and their impacts are well documented, many TSM&O strategies have only been more recently deployed, and often have been deployed in limited applications. Therefore, it can be difficult to identify the likely impacts of combining different TSM&O strategies, particularly those that still represent emerging technologies.
Challenges and Limitations of B/C Analysis
Although B/C analysis provides a robust and comprehensive framework for comparing the relative efficiency of different projects, there are many challenges and limitations to its overall use, as well as specific challenges in assessing TSM&O projects. These challenges and limitations include:
- B/C analysis provides a key piece of information that may be used in analyzing and prioritizing projects, but it is not the only information that should be considered. The B/C ratio and net benefit information is a powerful element in the comparison of different investment opportunities; however, as discussed below, there are limitations to the analysis and many project considerations that may not be able to be captured within a B/C analysis. Hard-to-capture benefits, such as improvements in community livability, changes in housing values, or impacts to disadvantaged communities, may be difficult to fully assess in the analysis. Further, other project prioritization considerations such as political will and public acceptability will not be captured in the analysis, yet may still play a role in determining the eventual prioritization of the projects being considered for investment. Therefore, it is critical that the results of the B/C analysis be carefully combined with other nonquantifiable inputs in making final decisions regarding the relative effectiveness of various projects. Figure 2-5 shows a hypothetical analysis framework being used in an assessment of regional transportation projects in the San Francisco Bay Area as part of the Metropolitan Transportation Commission (MTC) update of their 2035 Transportation Plan. As can be noted in the figure, the B/C ratio makes up a critical, but only one of many eventual inputs to the investment decision-making process.
- Many TSM&O strategies have only been recently deployed or include emerging technologies, making it difficult to estimate the true impact of the strategies. While many traditional capacity-enhancing strategies have been in use for years and their impacts are well documented, many TSM&O strategies have only been more recently deployed, and often have been deployed in limited applications. Therefore, estimates of the likely impact TSM&O strategies, particularly those that still represent emerging technologies, may need to be based on limited empirical data of the actual benefits of the strategy within the analysis. Chapter 3 contains additional information about the impacts and benefits of various Operations strategies. Additionally, the TOPS-BC application maintains a number of look-up tables on the observed impacts of many TSM&O strategies related to a number of MOEs, as highlighted in Figure 2-6.
- Maintaining consistency in the analysis of TSM&O strategies and traditional capacity projects is frequently complex due to varying analysis tools and methods, different MOEs, different analysis data inputs and sources, and different cost structures that are typically used to assess the various projects. As discussed further in Chapter 2, the analysis of varying strategies needs to be carefully planned in order to provide comparable and consistent results.
- The quantification of benefits needs to be carefully planned and structured to avoid the double-counting of benefits. Double-counting can occur in situations where there are overlaps in different benefits, or when a change to one benefit results in a direct change to another benefit. For example, a project to replace or upgrade traditional traffic signals to more efficient light emitting diodes (LED) signal lighting may be expected to result in a cost savings of $150,000 in electricity costs to an agency. In conducting a benefit/cost analysis of this project, the analyst should be cautious in not accounting for this impact, both as a benefit (a $150,000 gain to the agency), as well as a cost (a reduction of $150,000 in operating costs). This would result in a doubling of the actual benefit.
Figure 2-5. Hypothetical Project Comparison Data – MTC San Francisco Bay Area 2035 Transportation Plan
Note: Figure 2.5 shows the sample results from an analysis of a completely hypothetical project. The estimated B/C ratio for this project is projected to be approximately 1.3. The pie chart displays the amount that different benefit categories comprise of the total benefit estimate. This display also presents information on the projects projected ability to impact various regional targets, such as reducing carbon dioxide (CO2) emissions, or improving housing availability. Many of these target assessments are qualitative yet still included in the B/C analysis structure. The display also includes an assessment of the equity of the benefits (e.g., which groups of residents receive the greatest benefits/disbenefits) from the project. Again, these equity issues are not assessed in the B/C ratio, but are an important additional consideration for the agency conducting the study.
Figure 2-6. Sample View of TOPS-BC Impact Lookup Function
- There may be difficulty in assessing hard-to-quantify impacts within the analysis. Although B/C analysis should strive to be as comprehensive as possible in the MOEs and benefits quantified in the analysis, there are often some measures and benefits that prove extremely hard to quantify. In some cases, these hard-to-quantify benefits may include emerging measures, where a firm consensus has yet to be reached regarding the relationship between a change in transportation system performance and the long-term monetized benefit amount. Many agencies struggling to include better assessment of global climate change within their B/C analysis have faced this challenge. In other cases, the measure or benefit may be somewhat esoteric, complicating efforts to place a value on the benefit. As a result, many times the B/C analysis is supported by a more qualitative analysis of other impacts seen as benefits or disbenefits in the region, such as impacts on community livability or urban sprawl.
- There are often challenges in weighing the analysis comprehensiveness against the available analysis resources. Like many other types of analyses, there are substantial tradeoffs between the comprehensiveness of the analysis with the resources necessary to achieve that comprehensiveness. Likewise, achieving a higher level of confidence in the accuracy of the results often requires additional resources be made available for the analysis. The analyst must make decisions early in the design and set up of the analysis to balance these competing needs. For preliminary screening purposes, it may be acceptable to simply consider a few key MOEs – presumably those measures likely to be most significantly impacted by the projects being compared – and assessed at an order of magnitude scale. For more detailed prioritization and design considerations, the analysis may need to be much more rigorous, involving multiple tools to support the assessment of many varying MOEs, and providing a high level of confidence in the analysis results. Chapter 4 of the Desk Reference provides a discussion of the tools and methods available for conducting B/C analysis, and previews the level of resources needed to conduct analysis using these methods.
- TSM&O strategies that are targeted at mitigating unique, nonrecurring conditions may require additional analysis beyond the “average day” analysis typically used for recurring congestion projects. TSM&O strategies, such as incident management systems, weather systems, evacuation strategies, and other strategies focused on nonrecurring or special events, may require special treatment in the analysis to assess the strategy’s impact during these conditions and the likely frequency in which those conditions will be observed in order to quantify the benefits of the strategy. This is a major departure from analysis of more traditional capacity projects that are generally assessed during a “typical” day or peak period, and the results are anticipated to be identical on all other days. Chapter 5 provides an enhanced discussion of how these strategies impacting nonrecurring conditions may be evaluated.
- It can be difficult in developing the B/C analysis framework to decide if particular impacts represent a new benefit (to users, society or the agency), or if the impacts represent a transfer of benefits from one group to another. In a B/C analysis, transfers can occur if one group or segment of the population enjoys a new benefit, but does so at the expense of a new disbenefit or additional cost accruing to another group. For example, a deployment of a HOT lane on a corridor could likely increase the amount of revenue that an agency receives. This should not be treated as a benefit in the B/C analysis, however, since the added revenue to the agency is directly offset by the additional cost paid by the HOT lane users. This impact would be considered a transfer; and since the impacts of the increased revenue and the increased costs cancel the other out in the analysis, they should not be included in the B/C framework.