Measuring Border Delay and Crossing Times at the U.S.–Mexico Border—Part II
Guidebook for Analysis and Dissemination of Border Crossing Time and Wait Time Data
Final Report
CREATING A FRAMEWORK
Key Steps for Developing a Framework
A general framework for analyzing and disseminating crossing time and wait time data at border crossings needs to start by defining the characteristics and scope of the raw data that are to be generated by the RFID-based border crossing time and wait time measurement system deployed by the implementing agency. The characteristics and scope of raw data also depend on how parameters such as crossing time and wait time are defined by the implementing agency and by the stakeholders. The characteristics of the raw data are also dependent on the characteristics of the POE where the RFID-based border crossing time and wait time measurement system is deployed. Each POE is different and has features unique to its setting. For example, some POEs may have separate lanes to process FAST-compliant trucks in addition to separate inspection booths for FAST processing, while others may not have separate lanes. This makes a difference if separate crossing times and wait times are being reported for FAST versus non-FAST trucks.
A critical need is obtaining stakeholder input as to what data and other information are most helpful in meeting their needs. As there are no existing standards for reporting this type of information, it is up to the implementing agency to develop its own policies and procedures. However, stakeholder input and agreement are critical.
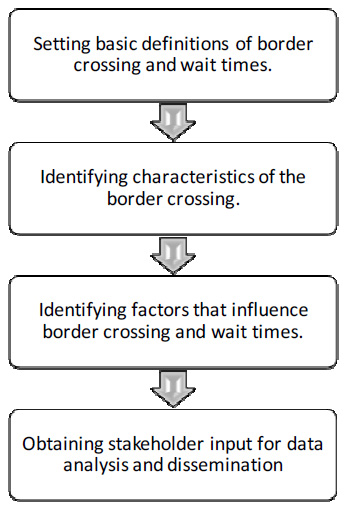
Key steps for developing a framework for data analysis and dissemination are illustrated in Figure 1.
Setting Basic Definitions of Border Crossing and Wait Times
The following generally accepted definitions of wait time and crossing time are used throughout this document. Wait time is defined as “the time it takes, in minutes, for a vehicle to reach the CBP’s primary inspection booth after arriving at the end of the queue.”1 This queue length is variable and depends on traffic volumes and processing times at each of the inspection facilities throughout the border crossing process. Crossing time has the same beginning point in the flow as wait time, but its terminus is the departure point from the last compound that a vehicle transits in the border crossing process. Time limit thresholds can be set so that an unusually long time spent by a vehicle in one part of the crossing process (e.g., vehicle mechanical breakdown or overnight stay in the inspection compound) can be discarded so that its crossing or wait time data do not skew aggregated average crossing or wait times. The Filtering Raw Data Section talks about a related concept: use of the fixed time window to filter out times of drayage truck crossings.
Identifying Characteristics of the Border Crossing
Characteristics and configuration of the border crossing where an RFID-based border crossing time and wait time measurement system is deployed need to be considered while performing data analysis and disseminating real-time and archived data because characteristics and configuration of the border crossing influence scope of crossing time and wait time data. For example, many POEs have designated booths for processing FAST-compliant trucks and shipments. However, some POEs allow non-FAST trucks to use the booth as well when heavy queuing is present. In such a situation, separating the wait times of FAST versus non-FAST trucks is not feasible. At some POEs, there are no dedicated lanes for FAST trucks, but there are separate booths for such vehicles. Thus, while it is desirable to separately measure crossing times and wait times of FAST and non-FAST trucks, infrastructure and/or operational practices at a POE may preclude the capability to accomplish that. Design documents and specifications for an RFID-based border crossing time and wait time measurement system need to address such issues.
Identifying Factors That Influence Border Crossing and Wait Times
Crossing and wait times of commercial vehicles are influenced by a wide variety of factors. Some factors are tied to operational changes related to Federal and State inspection processes, while others are external, such as approaching volume and major incidents around the border crossings. When interpreting crossing time and wait time data, a user needs to be informed of these influences and seek to correlate their effects in order to best understand variations that occur.
The factors included below were learned from experiences at the BOTA and Pharr POEs but are illustrative and thus expected to affect data at other POEs. These factors are helpful in both (a) informing users of influences they need to be aware of while interpreting data, and (b) understanding the correlation of as many of these factors as possible during data analysis.
- Time of day and day of week—Commercial vehicles crossing the border follow a temporal trend and show a distinct peak and off-peak volume. Intuitively, a temporal trend of crossing and wait times might follow a similar trend for volumes.
- Approaching volume—Volume of vehicles approaching the Federal inspection facility has a significant impact on crossing and wait times. Approaching volume of vehicles is also a function of time of day and week, special events and holidays, and other factors. The number of transponders read by the RFID readers on the Mexican side can be taken as a proxy to the approaching truck volume.
- Number of inspection lanes open—The number of inspection lanes open during any given time is correlated with crossing and wait times of vehicles. Vehicles that go through the secondary inspection have much higher crossing times than the rest. However, it is not clear what percentage of total vehicles goes through secondary inspection in a day. Also, the number of lanes used at the State inspection facility influences the crossing and wait times of trucks.
- Shipment type—Depending on the type of shipment, crossing and wait times could vary significantly, especially for shipments that are empty and are enrolled in the FAST program.
- Type of commodities—Many POEs experience significantly higher crossing and wait times during seasons when particular agricultural products are imported into the United States from Mexico.
- Flow control—Design of the RFID-based border crossing time and wait time measurement system needs to ensure that commercial vehicles do not leak from the flow. This can happen when commercial vehicles are able to divert from the crossing by exiting a side road after passing the RFID reader station at the head of the queue. It there are multiple RFID readers that segment the trip, this leakage can be detected and accounted for in the data. Leakage can also happen if unanticipated road construction diverts the flow away from readers, diminishing their rate of tag ID capture.
- Flow segmentation—The ability to use additional RFID reader stations to segment travel time increments of a commercial vehicle’s path through the POE, especially its approach to CBP Primary Inspection, can allow greater insight into where congestion is originating. Indeed, the ability to provide wait time is a type of segmentation assuming crossing time is also provided. Segmentation preserves the ability to measure crossing time or wait time. Scope of raw data is directly related to the core capabilities of the deployed system and factors such as those just mentioned.
Obtaining Stakeholder Input for Data Analysis and Dissemination
Stakeholder needs for real-time and archived data help in defining input and output values and algorithms for analyzing the data. To create archived data, including performance measures, input and output variables and algorithms need to be clearly described. While some stakeholders may be able to provide input on the statistical techniques, all need to be interested in the definition of the outputs and measures. It is also important that the scope of underlying data allows for estimation of such performance measures. The implementing agency needs to inform stakeholders of acceptable data analysis techniques (e.g., statistical methods, sampling techniques, error reporting) through the following:
- Ad-hoc and formal meetings with high-level decision makers.
- Literature review on past best practices studies.
The implementing agency needs to also identify applications for which the data analysis is performed. Some of the known applications of the archived data are as follows:[1]
- Monitor current and past trends in crossing time and wait time performance indices.
- Assess deficiencies and potential improvements at border crossings.
- Establish funding and programming priorities.
- Consider alternative improvement measures.
- Calibrate planning models.
- Determine freight cost due to delay.
- Be aware that air quality analysis and fuel consumption use much detailed data.
- Monitor congestion trends at the border using archived information.
- Establish cause-and-effect relationships.
- Use before-and-after analysis to gauge the effect of transportation improvements, policy changes, and resource mobilization at inspection facilities.
- Use non-technical travel-time-based measures to communicate with the public.
1 Border Wait Time Working Group presentation, April 2009, http://www.thetbwg.org/meetings/200904/1_-_border%20wait%20times%20update.ppt ↑