Executive Summary
Background
Cross border movement of people and goods is a vital part of the North American economy. Accurate real-time data on travel times along the US-Mexico border can help generate a range of tangible benefits covering improved operations and security, lower costs for travelers (both personal and commercial, reduced environmental impacts, reduced negative impacts on adjacent communities, and, of course, increased economic activity for both countries.
Congestion creates delays that result in wasted fuel and exacerbate noise and air pollution for communities adjacent to the crossings. Accurate travel time data can provide considerable benefits to the people that use the crossing, and the entities that are charged with managing it and the adjacent transportation network. It can:
- Help travelers make more informed decisions regarding which crossing to use and when to use it, thus saving time and fuel and making it less likely they will encounter congestion delays;
- Help operators, including transportation agencies, customs and immigration agencies, and private crossing operators, make more informed operating decisions such as the assignment of staff (e.g., from secondary inspection to primary inspection), or the opening of additional toll or inspection lanes to accommodate surges in demand;
- Support improved planning both along the border and for the transport network that provides access through Mexico and the US. Planning decisions would include facility design or layout modification that would ease the congestion at a particular crossing;
- More convincingly make the case for needed improvements in areas such as infrastructure upgrades and increased staffing, it can be a powerful planning aid for transportation and compliance agencies, as well as businesses;
- Be a very helpful means to educate border crossing users of the benefits of engaging in better planning, and those associated with expedited crossing programs.
The current quality of data on border crossing delays is mixed. Border agencies often rely on visual observations of the vehicle queue or a manual data collection process (driver surveys or time-stamped cards) to provide an estimate of total wait time. Unfortunately, these approaches are costly, inconsistent over time and from location to location, and do not take advantage of existing technology to monitor traffic movement.
In October 2007 The Federal Highway Administration initiated a three-part assignment to assess technology for the measurement of travel times for trucks through the Otay Mesa international border crossing into the US. The primary goal was to evaluate the ability of one of two technologies to accurately record travel times through the border zone. The three parts of the study were to:
- Examine two candidate technologies for installation and testing at the Otay Mesa crossing, and recommend one for testing;
- Conduct an assessment of the suitability of the selected technology to provide accurate border crossing travel time data; and
- Gather one-year's worth of travel time data at the crossing to establish a historic database for future use.
The Otay Mesa crossing is a truck-only crossing between the US and Mexico south of San Diego, California. At the onset of the project the port served an average of 2,500 vehicles per day inbound into the US. Over the last several decades, the crossing has seen an increase in the amount of traffic, and as a result, the amount of time necessary to cross into the US has been perceived to have increased for the average trucker. Rather than assess the accuracy of that perception, this project was focused on evaluating the ability of a technology solution to accurately measure the time it takes a truck to pass through the border.
The first part of the project involved the comparative examination of two candidate technologies. These technologies were:
- Automatic License Plate Recognition (ALPR). ALPR applications seek to identify, catalog, and track individual truck movements using optical image capture and re-identification. ALPR systems record a combination of registered license plates and USDOT numbers, use optical character recognition (OCR) to resolve images into strings of characters, store these character strings in a central database, and compare them to subsequently captures and resolved character strings in order to re-identify individual vehicles.
- Global Positioning System (GPS). GPS applications, particularly in the form of commercial feet management systems, are becoming more commonplace. Motor carriers typically rely upon such systems to locate individual trucks in order to more effectively manage dispatch operations, and to provide "visibility" regarding shipment status to customers. GPS systems rely upon a long-used navigational technique called triangulation to locate assets.
Based on a careful examination of functional characteristics, deployment requirements, long-term potential for viability, and options related to business models for gaining access to the data, it was determined that GPS technology would be used for this project.
The second part of the project was to capture data over an extended period in order to determine whether it was of sufficient quantity and quality to determine travel time. This task consisted of ongoing statistical analysis of weekly data files provided by a third-party data provider. As additional data was received, it was processed and analyzed, and stored both raw and processed data in a database for future use.
The final component of the project was the archiving for future use of one year's worth of GPS data and associated travel time calculations.
Stakeholder input was an essential component of the success of the project during both the design and execution of the technology assessment. Because it was important to gain national, international and local insight into the operations at the Otay crossing, the study team conducted stakeholder sessions in the San Diego / Otay Mesa area. The sessions were designed to communicate the objectives of the study, to discuss the various information needs of the stakeholders, and to provide information regarding the progress of the study. These stakeholders included motor carriers, and Federal, State, and local agencies from both sides of the border.
The stakeholder sessions offered the study team some valuable insights into the challenges faced by users and administrators at the border. They allowed for a much more comprehensive understanding of not only the conditions as they exist, but also regarding what might be done to improve them.
Stakeholders provided some useful ideas regarding what would be a potential set of functional requirements for any border travel time measurement solution. Table ES-1 contains a brief summary of important input. Most notably, the stakeholders offered information regarding their needs, and the functional requirements that a system that provides travel time information might be expected to meet.
| Stakeholder Group | User Needs (Northbound) |
|---|---|
| FHWA | Provide leadership in the area of automated cross border travel time measurement by testing a technology to provide better quality data, to facilitate better transportation operations in the border region |
| Motor Carriers | Gain access to real-time cross-border total travel time to assist in dispatching and routing decisions and in providing information to customers |
| State and Local Transportation Agencies | Historic travel time data for the assessment of overall system performance and real-time data for use in traffic operations and transportation system management |
| US/MX Customs | Historic and real-time data to assess needs for modifications to crossing infrastructure and to assist in managing resources and facilities during daily operations |
Findings
Technology Assessment
Based on a combination of stakeholder preferences for access to real-time data, as well as the need to establish a focused localized data source, the study team recommended that the best GPS-based alternative for this test was one that included a third-party provider. Stakeholders strongly supported this approach, and the study team procured the services of Calmar Telematics to capture, process, and deliver fleet GPS data for the study.
Data acquisition requirements were broadly prescribed to the data provider. The key requirements were that the sample size be sufficient to adequately characterize travel times and that the participating carriers allow unrestricted access to all available GPS data generated by trucks passing through the Otay Mesa crossing into the US.
In order to meet the requirement for truck GPS data, the data provider needed to identify and recruit motor carriers to participate in the project. The data provider chose to address this requirement by recruiting three carriers that regularly travel the Otay crossing. Initially, the carriers were chosen because they already possessed vehicles with GPS data systems installed.
The data initially provided by the carriers that agreed to participate was generated by devices affixed to semi-trailers. While the position data provided by these systems has proven reliable over a number of years, it became clear as the test progressed that the reporting frequency the carriers had negotiated with the data provider was not sufficient for measuring travel time over such a short distance. Rather than incur the costs associated with increasing the frequency of reports, the participating carriers opted to upgrade their GPS units to devices that are installed in the tractor (as opposed to trailers) and provide a higher reporting rate. The carriers purchased and installed a total of 175 units in trucks.
Crossing Statistics
During the test the study team obtained data from CBP that indicated that the average daily US-bound vehicle count between January 2009 and February 2010 was between 1,900 and 2,400.
In order to assess whether the fleets participating in the project were providing an adequate percentage of overall trips, the study team examined the GPS data to identify two different types of trips. The first was "total trips." For this category, any appearance of multiple points from the same truck within the dataset for a given two-hour period was considered a trip. This was true regardless of where the points were located, as long as they were within the travel time measurement zone (defined as the distance between the point at which stakeholders indicated that trucks typically begin to queue up to cross and the point where trucks exit the California Highway Patrol commercial vehicle inspection station downstream of the US Customs import processing facility), and indicated US-bound movement. The second trip type was "crossed trips." The study team considered a trip a crossed trip if a truck was identified as having been on both sides of the border during an individual trip, and headed US-bound. Hence, the group of total trips included all crossed trips, plus any additional trips for which points could not be identified on one side of the border or the other.
Figure ES-1 contains a plot of the data gathered during the test from January 2009 through March 2010. It illustrates the number of trips for which data was captured during each month.
Figure ES-1. Otay Mesa Data Trips - January 2009 through March
2010
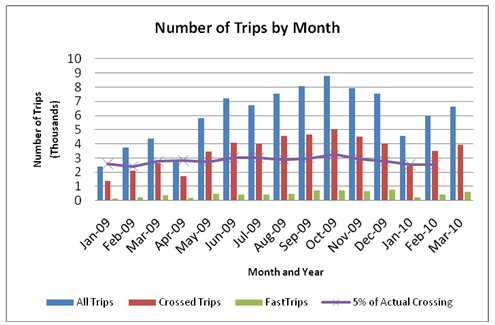
As the data indicate, the number of crossed trips consistently fell between three and five percent of all trips through the border. Based on these figures, the study team felt confident it could rely upon the data from crossed trips to characterize travel time through the crossing.
Border Travel Time Findings
To facilitate calculating border crossing travel time across the full measurement zone and for portions of the trip, the trip length was segregated into a series of consecutive travel zones, or districts, ten in all. The districts were utilized for determining the portion of the total trip travel time that was accumulated on the approach to the US customs primary inspection facility. Figure ES-2 shows the calculated travel times through the measurement zone by the day of the week (DoW) for all trips, trips conducted by trucks participating in the FAST (Free and Secure Trade)1 expedited processing program, and trucks that were not required to pass through the US Customs secondary inspection facility, over the period of a year.
Figure ES-2. Calculated Travel Time Values by Day of the Week
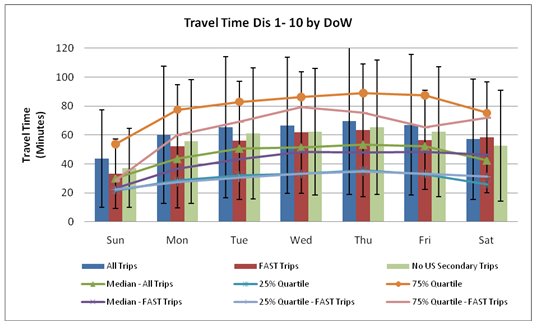
The travel time values calculated from the data indicate that the mean measured travel time across the entire measurement zone for Mondays through Saturdays was approximately 67 minutes. Sundays, which see very limited traffic, showed a mean travel time value of just over 43 minutes. The data suggests that travel times are longest on Thursdays and Fridays, where mean values are approximately 70 minutes.
The data also indicates that FAST trips-at least those that could be identified definitively-take less time for all days except Saturdays. Differences range from values of 15 percent lower on Mondays for FAST trips to just over 10 percent lower on Thursdays.
Among the more notable characteristics of the data is the very large value associated with the standard deviation from the mean (illustrated in the figure by the vertical black lines). The values calculated from the data indicate that the standard deviation ranged from 61 percent to 81 percent of the mean. These values suggest that the carriers that participated in the study experienced very wide fluctuations in travel times. Fluctuations of this magnitude are indicative of low travel time reliability, a characteristic that makes it difficult for border users to anticipate how long a border crossing trip might take.
Because it is less prone to the influence of outliers, the study team also calculated median travel time values for each day of the week. The data indicated that the median values were 15 to 30 percent lower than the mean values, which would place the median travel time for Mondays through Saturdays between 42 and 53 minutes.
The upward bias in mean travel time values is revealed further through the identification of 25% and 75% quartile values. These values form the upper and lower limits of observed travel times for the middle 50% of all observed trips. A comparison of the portions of the standard deviation range outside the middle 50% to those inside reveals that more of the deviation interval lies to the upper side of the range.
The root cause of the high degree of travel time variability is not known for certain. However, the study team suspects that several factors may contribute to it. Fluctuations in demand volume, the opening and closing of primary screening lanes, the proportion of trucks participating in the FAST expedited screening program, variations in screening actions undertaken by US CBP can affect travel time.
Travel time values were also calculated and reviewed on a month of year (MOY) and time of day (TOD) basis. Some of the characteristics of these datasets are summarized in Table ES-2.
| Analysis Timeframe | Characteristics |
|---|---|
| Month of Year (MOY) | Mean and median travel time values peaked in the March-April 2009 and September-October 2009 timeframes. According to CBP crossing statistics, the September-October 2009 period was the busiest period. The mean travel times for FAST trips were lower than the overall average for all but three of the months: January 2009, April 2009, and January 2010. The monthly data is consistent with the daily data in that they show that the median travel time is consistently lower than the mean, and that the middle 50% of trips fall to the lower end of the standard deviation range. |
| Time of Day (TOD) | For the TOD data, because the number of points was exceedingly small, all trips identified as having started between 12 AM (when the border closes) and 6 AM were excluded from the dataset. The study team did this because it did not have confidence in the values provided. Because the border does not open until 8 AM local time, the high travel time values reported between 6 AM and the opening of the border suggest that some vehicles are queuing in advance in order to ensure earlier entry into the US. The increase in volume seen in the peak afternoon/evening travel period does not translate into longer travel times. This is likely due at least in part to higher staffing levels during those periods. |
Data Validation
At the conclusion of the data collection period, the study team contacted carriers that participated in the project to gain some perspective on their operations, and to gather information related to their typical crossing experience. The principal objective was to validate the border crossing travel time findings.
The study team first sought feedback regarding the mix of loaded to unloaded trips and FAST to non-FAST trips for each carrier. The intent was to assess the ability of the GPS devices to discern the various trip types. The participating carriers indicated FAST trip frequencies of between 75 and 90 percent of all northbound trips. This is in contrast to the GPS data that indicated that approximately 30 percent of trips were FAST trips. While neither carrier offered detailed records to indicate that these figures were close to actual numbers, the implication is clear that the use of GPS data to isolate FAST trips was not an accurate method at the Otay Mesa crossing, where vehicles conducting FAST trips are physically separated by a significant distance from non-FAST and empty trips for only a short period. Separation of paths of travel is essential if GPS data is to be relied upon for differentiating trip types.
The study team also sought feedback from the carriers regarding whether their drivers encounter a high degree of travel time variability (i.e., a low level of travel time reliability) when crossing into the US. Representatives from both carriers concurred that there is, in fact, significant variability, and that the degree seen in the data could be accurate.
Finally, the study team asked the carriers about the value they perceive GPS-based technology systems have with respect to their operations. Both carriers indicated that they routinely use the tracking and tracing functions as a means to meet business needs of customers, and both use the data on a continual basis.
Conclusions
Based on the observed results from the full data collection period, the study team is able to draw a number of conclusions regarding the use of truck fleet GPS data for the measurement of travel time across international border crossings, both in general terms and in terms specific to the Otay Mesa Crossing.
With respect to the primary goal, the devices and the processing methods employed to capture and analyze the GPS data succeeded. There are, however, some considerations that must be taken into account as border stakeholders contemplate its use on a regular basis.
First, the figures reflected in this report are based on a marginally representative sample. While the number of trips and their distribution throughout the day consistently exceeded the three to five percent threshold commonly required for probe vehicle-based traffic monitoring, the carriers that participated are similar to only a portion of those that cross the border. Both carriers are highly reputable companies that are C-TPAT2 qualified, and conduct a significant portion of their cross-border trips as FAST trips. As such, the test sample was not random, and may not be representative of the general population.
The second consideration that must be taken into account is the size and placement of the measurement zone. At the onset of the project, carriers indicated to the study team that queues often extend to the Bellas Artes/Calle Doce intersection. However, the data gathered during the test suggests that traffic often flowed quite freely from there to the sorting gate upstream of the Mexican Customs Export screening point.
The implication is that care should be taken in deciding at what point the border crossing travel time clock should start. It is worthwhile to consider beginning measurement of an individual trip after a vehicle has reached the end of the queue waiting to cross. The time from that point until the crossing is completed is probably of more value to a border user.
Finally, consideration must be given to the implications associated with the large values of standard deviation, and the differences between the mean and median values seen in the data. This level of variability does present particular challenges in formulating accurate values for current travel time, such as might be used in a traveler information system.
This is important because high levels of variability in the data can make it difficult to accurately characterize travel time fluctuations associated with non-recurring congestion, which has a profound effect on travel time reliability. A larger number of vehicles, spread across a more diverse set of carriers, should improve the data and lower the degree of variability. From a statistical standpoint, as the sample size increases, the proportion of outliers and their influence on the mean values should diminish. It is not clear at this point the threshold at which that might occur to an acceptable degree.
It is important to remember that some degree of variability will continue to exist simply due to factors such as variations in the proportion of vehicles participating in secure supply chain operations (such as the C-TPAT and FAST programs), fluctuations in the total number of vehicle crossing during a given period, the number of empty trucks versus loaded trucks passing through the crossing, and the application of various enforcement actions.
The capture and use of real-time-or more accurately, near real time-data presents a set of challenges that were not completely addressed during the project, but the experience offers some useful insights. The information exchange and processing mechanisms employed for the project would not be suitable as deployed solutions. These mechanisms would need to be replaced with appropriate communications and processing tools and protocols in order to be usable for applications that rely upon timely information processing, such as traveler information systems that might inform border users of current conditions.
The data model that the data provider applied to access motor carrier data-seeking to obtain it directly from the carriers-is different from that which is typically seen from other fleet data providers. This approach presents both benefits and challenges. One potential benefit is that, because the carrier already owns the data for its fleet, and only its fleet, it may be willing to grant access to the data for a modest sum. Further, by working directly with the carrier while agreeing to protect sensitive information from distribution, a data provider could structure its data agreements to allow for the re-use of information for multiple purposes without incurring additional cost.
Perhaps the most significant challenge to this approach is that which was encountered during the recruitment of carriers for participation in this project. The data provider was forced to endure a lengthy courtship process before the carriers finally agreed to grant access to their data. Ultimately, the carriers became more receptive as they recognized that the devices are useful for other functions, as well. Nonetheless, the level of time and effort necessary to execute agreements with the carriers indicates that this should be factored in whenever GPS fleet data is sought.
Even with the level of variability demonstrated in the data gathered during this project there appears to be significant value associate with GPS fleet data. GPS devices can easily provide data for other movements, and the data processed to quickly multiply its planning and operations value.
For instance, the data provider already possesses raw GPS data for Mexico-bound movements at the Otay crossing. This means that with the completion of some processing logic, travel time for southbound trucks during the same period could be calculated without additional data collection. Further, raw GPS data has already been recorded for movements both within the areas adjacent to and those beyond the Otay border zone. This data could be used not only for travel time calculation, but also for the identification of origins and destinations and route selection. This also underscores the importance of carefully considering the terms of any data agreement to ensure that the maximum value can be obtained.
Finally, modern fleet GPS devices are becoming both more affordable and more capable, opening up additional opportunities to capture valuable information. One example is the capture of device from a vehicle's engine data bus, which would include such information as throttle position, travel speed and fuel use by location. This has potential value for the identification of locations where excessive idling is occurring-important data for carriers to establish mechanisms to improve fleet fuel efficiency and for agencies to examine the potential environmental value of infrastructure upgrades.
Recommendations
While a significant amount of information was captured during the project, the study team recommends that a series of actions be undertaken to establish a complete service for the various potential users of GPS data. These actions will increase the likelihood that the data obtained from a GPS-based system offers the appropriate value and usability to enable the cost of deployment to be spread over a broad set of stakeholders. The team's recommendations are offered below, along with an explanation of the value associated with exercising each of them
Recommendation #1: Use a Larger Number of Reports.
While the rule of thumb threshold of three to five percent of the total population was successfully reached during the project, the data suggests that a larger population of GPS-equipped trucks could significantly enhance the dataset by reducing the effect of outlier trips on the mean travel time value. The relationship between sample size and variability is not known, but an increase in the number of units to 300 (at the same crossing frequency) should yield definitive evidence of it. Of course, such action would need to be balanced against the cost of the additional devices, and the expected value of the (presumably) more precise data.
Recommendation #2: Increase the Variety of Carrier Participants.
The carriers that participated in the project indicated that the overwhelming majority of their US-bound trips are FAST trips. At the very least, that means that the samples gathered for this project under-represent non-FAST trips. If a GPS data solution is to be deployed in a production setting, the team suggests that the trucks from which GPS data is collected conduct non-FAST trips into the US at a representative frequency.
Recommendation #3: Examine Secondary Uses for Data.
The measurement of travel time for vehicles entering the US represents only a small portion of the value to be extracted from GPS data. These devices are typically on when the vehicle is running, offering the opportunity to examine movements, origins and destinations, idling points, and various travel delays throughout a vehicle's duty cycle. Those entities that adopt GPS-based systems should examine these and other secondary uses for the data in order to realize its full value. For instance, a significant volume of data was captured during the project regarding southbound movements, but it was not analyzed because it fell outside the scope of the project. At this point, the value and usefulness of this data is unknown.
Recommendation #4: Use Extended Data Collection to Reinforce Calculations & Diminish Variability.
Much in the way that an increase in the number of trucks using the crossing should reduce variability and enhance confidence in the data, so too should the capture of data over a long period of time. Doing so will likely lend stability and reduce variability in historical travel time data, thereby reducing the effects of outliers. Additionally, external factors such as the level of economic activity will also affect the figures. Collecting data over an extended period offers the opportunity to examine the effects.
Recommendation #5: Examine and Test Near Real Time Data Use.
Although GPS-based traffic monitoring solutions are being used in other locations on a real-time basis (e.g., I-95 Corridor Coalition), the usefulness and usability of similar data in the border environment is still largely unknown. The approach used for this project offers an opportunity to examine whether enough value can be extracted to affect agency and carrier decisions during the course of everyday operations. This could be accomplished through a continuation of data acquisition and analysis activities, with the participation of and interaction with users who have access to a near real time data feed.
Recommendation #6: Pursue Transfer of Data Acquisition Oversight and Funding to State/Local Agencies, Customs Agencies, or Others.
It is understood that FHWA does not have an ongoing operations function at international border crossings, and that its primary role is the conduct of research and support for deployment of solutions that enhance the nation's transportation system. Hence, the funding and use of systems that measure border travel time are the purview of border management agencies, agencies with responsibility over local transportation infrastructure, and the border user community. The results of this project establish the viability of GPS technology for travel time measurement. They also present an opportunity to explore how a transition to a production solution might take place through the leveraging of carrier relationships established during the test, the expansion of data coverage to a comprehensive geographic scale, and the examination of opportunities for secondary data uses.
1 The Free and Secure Trade (FAST) program was established and is operated by US Customs and Border Protection, Mexican Customs, and Canada Border Services Agency as a means to expedite the movement of safe, legal trade movements among the three North American countries. It relies on the comprehensive screening and validation of supply chain security. [ Return to note 1. ]
2 C-TPAT (Customs-Trade Partnership Against Terrorism) is a supply chain security assessment program, participation in which is required in order to access FAST processing lanes. [ Return to note 2. ]