
Advancing Metropolitan Planning for Operations: An Objectives-Driven, Performance-Based Approach – A Guidebook
6.0 Ongoing Monitoring and Evaluation
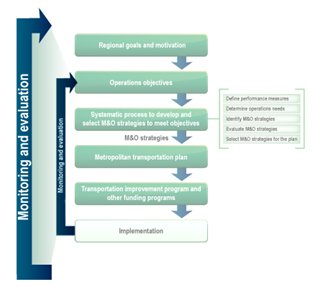
6.1 The Role of Monitoring and Evaluation in the Approach
Monitoring and evaluating performance is an important step, but it is sometimes overlooked in the objectives-driven, performance-based approach to planning for operations. The value of developing operations objectives and performance measures would not be fully realized without an assessment of progress in meeting the objectives. The CMP requires a coordinated program for data collection and system performance monitoring to define the extent and duration of congestion; to help determine the causes of congestion; and to evaluate the effectiveness of implemented actions.
Monitoring and evaluation helps to inform better decisionmaking by transportation planners and operators. These efforts help transportation professionals:
- Better understand the effectiveness of transportation strategies and investments so transportation planners and operators can work together to devise more effective investment strategies to meet regional objectives.
- Fine-tune the operation of projects already implemented and the implementation of ongoing operations programs.
- Provide assistance in calibrating and refining planning tools and models, such as regional travel demand models, so that relationships and traveler responses are properly reflected.
- Spur greater collaboration between planners and operations managers in collecting and monitoring data, which can yield benefits in terms of both developing and refining operations objectives and performance measures as well as in identifying successful strategies.
Tracking Progress – Regional Indicators:The Delaware Valley Regional Planning Commission (DVRPC) uses a systematic framework to monitor the Philadelphia metropolitan area's progress in meeting its MTP goals. Tracking Progress is an ongoing, outcome-based effort to align planning and implementation activities and is intended to guide the region's investment strategy. The effort collects and compiles meaningful time series data that helps regional decisionmaking. The resulting products feed back into future long-range plan updates and subsequent performance measures to provide a valuable interface between the region's investment pattern and evaluative process. See: http://www.dvrpc.org/LongRangePlan/RegionalIndicators/. |
Monitoring and evaluating information also improves the effectiveness of communications with decisionmakers, stakeholders, and the public, enabling them to:
- Understand the current status of transportation system performance more clearly, not just based on anecdotal information but based on valid data.
- More accurately assess what progress has been made in meeting operations objectives in order to see where performance has been improved and where progress still needs to be made.
- Understand the connections between transportation investments and policies and regional transportation system performance, including greater appreciation for the benefits of operational strategies.
Lincoln, Nebraska Signal Timing:The City of Lincoln, Nebraska, provides staff support to the Lincoln MPO. As part of its congestion management efforts, the city conducted travel time runs through designated corridors before and after a set of signal timing modifications were implemented as a congestion strategy. Studies were conducted on 8 corridors and at 46 signalized intersections. See: http://lincoln.ne.gov/city/pworks/engine/traffic/signal/index.htm. Denver Region's Transit Signal Improvement Program:The Denver Regional Council of Governments works with over 30 local jurisdictions on the Traffic Signal System Improvement Program (TSSIP), a combination of M&O strategies designed to time and coordinate traffic signals in the Denver region. The program is updated regularly through a collaborative planning process involving representatives from the region's operating agencies. Each agency identifies critical needs yet understands that the focus of the program is improving signals at regionally significant arterials. The TSSIP serves as a key component of the MPO's congestion mitigation program. Funding is programmed for TSSIP through the TIP. The program has already improved operations at more than 1,000 traffic signals in the region – reducing travel times, fuel consumption, and vehicle emissions. See: http://www.drcog.org/index.cfm?page=TrafficSignalProgram. NCTCOG Thoroughfare Assessment Program:The Thoroughfare Assessment Program (TAP) is a multi-phased program being implemented by the North Central Texas Council of Governments. The purpose is to maximize the capacity of the existing system and improve air quality through advancing traffic operations via signal retiming and implementation of low-cost operational improvements along selected corridors. An extensive data collection and system analysis process occurs for selected thoroughfares by means of assessing operational characteristics; estimating air quality benefits; and using performance measures such as travel time, delay, speed, and number of stops in order to develop and implement improvements. |
6.2 Aspects of Monitoring and Evaluation
Monitoring and evaluating involves three related elements:
- Evaluating the effectiveness of implemented strategies.
- Tracking regional system performance.
- Assessing and refining operations objectives.
Evaluating the Effectiveness of Implemented Strategies
Measuring the performance of implemented strategies:
- Provides documentation of effectiveness, so that transportation agencies can communicate to the public and decisionmakers about the benefits of their investments. This documentation is particularly important for operations strategies, since the strategies themselves (e.g., traffic signal retiming, transit signal priority, etc.) are often less tangible than infrastructure solutions, such as new roads and transit lines.
- Supports more effective decisionmaking by helping transportation agencies to determine which strategies and investments are most effective in helping to attain operations objectives.
- Demonstrates whether operational or policy adjustments are needed to make the current strategies work better, and provides information about how various strategies work to inform future approaches within the region.
Monitoring strategy effectiveness is one of the required elements of the CMP. Federal regulation indicates that the CMP should include "a process for periodic assessment of the efficiency and effectiveness of implemented strategies, in terms of the area's established performance measures."27 This type of evaluation should be conducted for other types of operational improvements outside of the CMP as well.
Measuring results typically requires a plan to collect pre-implementation and post-implementation data. Given the incremental changes in travel associated with many operational strategies, it will be important to select appropriate data, timeframes, and collection procedures to help isolate the changes in system performance that are associated with the strategy implementation.
Wilmington Area Planning Council:WILMAPCO, the metropolitan planning organization for New Castle County, Delaware and Cecil Council, Maryland, recently incorporated crash statistics (e.g., rates, frequency) into its identification of congested corridors. Recognizing that traffic congestion poses a continuing problem for the region, WILMAPCO has developed a regional approach to review the location of areas with highest crash frequencies. As crash data has become more reliable over the years, the agency expects to include it in its next summary publication of its congestion management process. In addition, with reliable historical crash data now available, WILMAPCO has the ability to begin tracking the crash trends in the region. See: http://www.wilmapco.org. |
Monitoring strategy effectiveness can be the most challenging part of the approach. For instance, traffic congestion is the result of multiple factors, including available transportation capacity and the demand for travel, which interplay in complex ways. It can be difficult to identify the effects of a particular strategy from other factors that might influence congestion. As a result, there possibly is less accumulated experience with monitoring strategy effectiveness than other CMP elements. Although many regions now systematically report on congested conditions and performance, fewer focus monitoring efforts on specific CMP strategies to determine whether they have had the predicted or desired effect.
Monitoring approaches can include the following:
- Conduct program evaluation studies. For instance, fund a study to evaluate the effectiveness of a regional transportation demand management program.
- Build data collection into the implementation of specific projects. For instance, conduct a study of a sample of intersections prior to and after implementing traffic signal improvements, or utilize transit ridership data collected through fare collection to determine the implications of adjusting bus schedules and providing real-time transit information signs along specific routes.
- Develop guidelines or incentives for local governments that receive funding to conduct evaluation studies. Although an MPO may not be able to fund studies of individual projects, it can provide guidelines or incentives for cities, counties, and other entities that receive funding to build evaluation into their program efforts. For instance, priority can be given to funding projects that have a data collection element.
Although collecting data to assess individual projects and programs may seem like a daunting challenge, particularly given small project budgets, the costs of data collection do not need to be high.
Collecting data on actual transportation system performance helps to demonstrate the region's status and can show trends identifying whether indicators are moving in the right direction. Performance measures in the MTP can be used by the MPO to report regularly on the performance of the metropolitan transportation system, for instance, as part of a periodic (e.g., monthly, quarterly, biannual) performance report. Periodic performance reports provide an excellent mechanism to make M&O more relevant to the everyday experiences of the public. A number of MPOs, transit operators, and State DOTs use performance reports to open up dialogue with decisionmakers and keep them informed about trends in system performance.
Tracking Regional System Performance
Such reports inform transportation planning in a number of ways to:
- Provide a realistic view of system performance improvements achievable through management and operations investments.
- Provide operations managers with guideposts and goals that provide some measure of how operations programs are contributing to the long-term goals of the system.
- Support policy that is realistic about system constraints and that supports the role of management and operations in maintaining acceptable transportation performance.
Agencies that report performance measures in a periodic performance report encourage a sustained communications link between planning and operations staffs. There are many cases where a particular activity or project requires temporary coordination or exchange between planners and operators, but sustaining such communication is critical for changing the everyday perspective of these departments to routinely consider operations tools within the planning process. Routine, sustained performance reporting is, therefore, particularly valuable.
Assessing and Refining Operations Objectives
A feedback segment is part of the cycle of developing operations objectives, implementing strategies, and evaluating results. Collecting data on system performance can be used to compare the status against specific targets that have been identified in operations objectives. This information in turn can be used to help assess the feasibility of meeting objectives within the stated timeframe and may be used to refine or develop new operations objectives over time. For instance, if trends show difficulty in meeting an objective, it may be necessary to refine the objective or consider alternative strategies to meet the objective.
GPS Technologies to Assess Reliability:The Capital Region Council of Governments (CRCOG) of the Hartford, Connecticut, metro area used a $12,000 Technology and Innovation Funding grant from FHWA to purchase GPS equipment to monitor travel times and speeds during peak hours on arterial roads. CRCOG utilized its own staff to collect data with the GPS units as part of their normal commute routines along several key arterial corridors. Some staff deviated from their normal routes in order to conduct the travel time study. See: http://www.crcog.org/. Aerial Photos:Every 3 years, the Dallas-Forth Worth, Texas MPO conducts a series of aerial photo surveys to assess both system-wide and site-specific freeway system performance. This information helps identify potential locations for freeway bottleneck improvements as well as major corridor needs. The resulting data also enables decisionmakers to compare long-term congestion trends and to evaluate the benefits of the transportation improvement strategies being implemented over the coming years. Data is obtained once an hour for 4 days during peak morning and evening periods of commuter travel. The aerial surveys show heavy truck traffic corridors and locations of peak period traffic bottlenecks. Vehicle type breakdown, vehicle counts, and the corresponding level of service (LOS) estimates are then derived from the data. The LOS ratings are presented in graphical format by highway segment, direction, and time slice. |
6.3 Collecting Data for Evaluation Studies
Data is a necessary component of monitoring and evaluation. The costs and time associated with collecting data are often considered challenges, given limited budgets for implementation, let alone post-evaluation studies. However, there is a wide range of ways to collect data, which vary substantially in terms of resource requirements. In many instances, operations data may be available for use in this process. Table 4 provides some examples of data collection methods for evaluating various types of transportation strategies.
At a regional level, transportation system performance data can be collected from a range of different methods, several of which were noted earlier in section 4.3.
| Strategies Being Evaluated | Performance Measures | Data Collection Methods |
|---|---|---|
| Incident Management |
|
|
| Traffic Management |
|
|
| Traveler Information |
|
|
| Transit Operations |
|
|
| Travel Demand Management |
|
|
| Source: Table adapted from East-West Gateway Coordinating Council, St. Louis Region CMS Congestion Mitigation Handbook, available at: http://www.ewgateway.org/pdffiles/library/trans/cmshandbook.pdf. | ||
27 See the Metropolitan Transportation Planning Regulations, 23 CFR 450.320(c).
 You will need the Adobe
Acrobat Reader to view the PDFs on this page.
You will need the Adobe
Acrobat Reader to view the PDFs on this page.