
Advancing Metropolitan Planning for Operations: An Objectives-Driven, Performance-Based Approach – A Guidebook
4.0 Developing Performance Measures, Assessing Needs, and Selecting Strategies
4.1 Operations Objectives Lead to Performance Measures
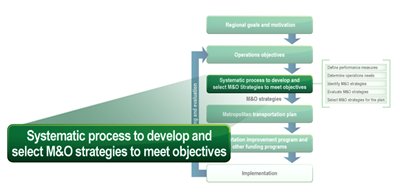
Developing operations objectives is a precursor to the systematic process to identify and select strategies to include in the MTP and corresponding TIP. Developing operations objectives leads to establishing performance measures that can be used to assess and track regional system performance. By establishing specific and measurable performance outcomes, operations objectives also can lead to the development of performance measures that are used at a lower level, for instance, to analyze performance of corridors, road segments, intersections, or transit routes. Collecting and analyzing data on performance, and forecasting future conditions, can then be used to identify and pinpoint areas of deficiencies, which in turn can help to determine the most appropriate strategies to achieve the operations objectives. An example of how operations objectives are applied throughout the planning process is illustrated in Table 3 on the following page.
| Planning Process Stage | Examples |
|---|---|
| Goal(s): Broadly describe what the region wants to accomplish, focused on outcomes. |
|
| Operations Objectives: Specific, measurable statements relating to the attainment of goals. |
|
| Performance Measures: Metric used on a regional basis to track system-wide performance (used in developing a regional objective), or at a corridor, roadway, or intersection level to identify specific deficiencies within the system to address. |
|
| Strategies: Approaches to achieve objectives. Includes system preservation, safety projects, management and operations, capacity expansion. |
|
| Projects/Implementation: Initiatives identified to carry out strategies. |
|
For TMAs, the CMP uses this systematic process in developing performance measures, collecting data, identifying and analyzing congestion problems and deficiencies, and developing strategies and projects. This is followed by monitoring and evaluation that cycles back to refining and re-examining congestion objectives. Even in metropolitan areas that are not required to implement a CMP, this systematic process is valuable as operations objectives related to congestion are considered in the decisionmaking process.
4.2 Develop Performance Measures
Performance measures are indicators of how well the transportation system is performing and are inextricably tied to operations objectives. A range of performance measures may come from developing operations objectives. The performance measures selected should provide adequate information to planners, operators, and decisionmakers on progress toward achieving their operations objectives.
However, this is an iterative process as operations objectives may be refined once performance measures are developed and baseline data has been collected.
Performance measures should be developed based on the individual needs and resources of each agency. For example, transit agencies typically use a number of measures that are of interest to their customers, such as on-time performance, average passenger load, and total ridership. An MPO uses measures of mobility such as facility level-of-service, travel time, and travel delay. These performance measures help planners focus on the day-to-day experience for their users. This provides important balance in settings where planners have focused exclusively on long-term development of the network. With greater focus on the day-to-day characteristics of the system, planners appreciate the issues faced by system operators. The result is that mid- and long-term planning now reflect greater consideration of operations and the associated investment needs.
Examples of Performance Measures
Performance measures may be used either at a system-wide scale or at a corridor or transportation facility level in order to determine where deficiencies exist and to prioritize strategies and funding to the most critical problems. For instance, by identifying locations with the greatest recurrent and non-recurrent traffic congestion using performance measures in the CMP, an MPO can help to target funding toward facilities with the greatest congestion problems and the greatest opportunities to reach operations objectives for congestion management.
Examples of M&O performance measures include:15
- Travel Time: Travel time measures focus on the
time needed to travel along a selected portion
of the transportation system, and can be applied
for specific roadways, corridors, transit lines, or
at a regional level. Common travel time metrics
include:
- Average travel time, which can be measured based on travel time surveys.
- Average travel speeds, which can be calculated based on travel time divided by segment length or measured based on real-time information collection.
- Travel time index: the ratio of peak to non-peak travel time, which provides a measure of congestion.
- Congestion Extent: Congestion measures can
address both the spatial and temporal extent
(duration). Depending on how these measures
are defined and data are collected, these measures
may focus on recurring congestion or
address both recurring and non-recurring congestion.
Examples include:
- Lane miles of congested conditions (defined based on volume to capacity (V/C) ratio, level of service (LOS) measures, or travel time index).
- Number of intersections experiencing congestion (based on LOS).
- Percent of roadways congested by type or roadway (e.g., freeway, arterial, collector).
- Average hours of congestion per day.
- Share of peak period transit services experiencing overcrowding.
- Delay: Delay measures take into account the
amount of time that it takes to travel in excess of
travel under unconstrained (ideal or free-flow)
operating conditions, and the number of vehicles
affected. These measures provide an indication
of how problematic traffic congestion is, and can
address both recurring and non-recurring congestion-
related delay. Examples of delay measures
include:
- Vehicle-hours of recurring delay associated with population and employment growth.
- Vehicle-hours of nonrecurring delay associated with incidents, work zones, weather conditions, special events, etc.
- Incident Occurrence/Duration: Incident duration
is a measure of the time elapsed from the
notification of an incident until the incident has
been removed or response vehicles have left
the incident scene. This measure can be used to
assess the performance of service patrols and
incident management systems. Incident occurrence
also can be used to assess the performance
and reliability of transit services. Example
measures include:
- Median minutes from time of incident until incident has been removed from scene.
- Number of transit bus breakdowns.
- Average number of transit rail system delays in excess of X minutes.
- Travel Time Reliability:16 Travel time reliability
measures take into account the variation in
travel times that occur on roadways and across
the system. Examples of measures include:
- Buffer time, which describes the additional time that must be added to a trip to ensure that travelers will arrive at their destination at, or before, the intended time 95 percent of the time.
- Buffer time index, which represents the percent of time that should be budgeted on top of average travel time to arrive on time 95 percent of the time (e.g., a buffer index of 40 percent means that for a trip that usually takes 20 minutes, a traveler should budget an additional 8 minutes to ensure on-time arrival most of the time).
- Percentage of travel when travel time is X percent (e.g., 20 percent) greater than average travel time.
- Planning time index, defined as the 95th percentile travel time index.
- 90th or 95th percentile travel times for specific travel routes or trips, which indicates how bad delay will be on the heaviest travel days.
- Percentage of weekdays each month that average travel speed of designated facilities fall more than X MPH below posted speed limit during peak periods.
- Travel Demand Management (TDM)17
Travel demand management measures examine
demand on the system as well as the impact of
strategies to manage that demand. Measures of
travel demand and the impact of TDM programs
include:
- Awareness – Portion of potential program participants aware of a TDM program.
- Utilization – Number or percentage of individuals using a TDM service or alternate mode.
- Mode split – Proportion of total person trips that uses each mode of transportation.
- Vehicle Trips or Peak Period Vehicle Trips – The total number of private vehicles arriving at a destination.
- Person Throughput: Examines the number of
people that are moved on a roadway or transit
system. Efforts to improve this measure can are
reflected in efforts to improve the flow of traffic,
increase high occupancy vehicle movement,
or increase transit seat occupancy on transit.
Example measures include:
- Peak hour persons moved per lane.
- Peak hour persons moved on transit services.
- Customer Satisfaction: Examines public perceptions
about the quality of the travel experience,
including the efficiency of system M&O.
Customer satisfaction is typically measured
through surveys and may include measures such
as:
- Percent of the population reporting being satisfied or highly satisfied with travel conditions.
- Percent of the population reporting being satisfied or highly satisfied with access to traveler information.
- Percent of the population reporting being satisfied or highly satisfied with the reliability of transit services.
- Availability of or Awareness of Information: These measures focus on public knowledge of travel alternatives or traveler information.
New Jersey Transportation Planning Authority:The NJTPA selected a reliability index that compares non-recurring delay to total delay. NJTPA uses a special post-processing module to its travel demand model to help produce this measurement. See: http://www.njtpa.org/. Massachusetts Bay Transportation Authority:The MBTA measures peak-period passenger crowding and on-time performance by transit line. Using data collected on the regional transit system, the Boston MPO reports number of passengers per seat on transit lines in the peak period as well as the percentage of trips operating within 5 minutes of scheduled times. |
Defining and Measuring Congestion in the CMP
In areas that implement a CMP, the CMP must define the appropriate performance measures for congestion. How congestion is defined may differ across regions and may relate back to regional visions and goals articulated in the MTP, based on public input.
Many CMPs have relied on volume-to-capacity (V/C) ratios as the measure of congestion. This simple measure is relatively easy to define and to collect data and model future performance. However, some transportation agencies are beginning to use more customer-oriented measures, such as travel time measures, which are easier to understand and communicate to the public. Based on congestion problems in a region, a wide range of measures of congestion may be used, addressing:
- Scope (total delay time experienced by travelers).
- Extent (amount of lane miles experience congestion).
- Duration (hours of congestion per day).
- Intensity (level of service) of congestion.
- Sources of congestion (recurring and non-recurring) and other considerations.
Moreover, if a region's goals and objectives look to improve accessibility and personal mobility, then measuring congestion based solely on vehicle counts may not be the most effective choice for that region. Instead, a region may wish to include other measures that relate to alternatives to driving alone and transportation options in their CMP. These alternatives may include such elements as average vehicle occupancies, person-throughput, or transit mode share. Some regions measure travel conditions for transit, biking, and walking, including whether those modes are available, how much the modes are used, and how the modes perform regarding the traveler experience within their CMP.
Recognizing that the public often finds unexpected delay most aggravating, some MPOs are incorporating performance measures relating to system reliability, incidents, and non-recurrent delay into their CMPs. In selecting congestion performance measures and other operations-related performance measures, agencies should consider the following:
- Ability of the set of measures to track performance for the region overall, the corridors, and for individual transportation facilities.
- Ability of the agency to collect data to track the measure.
- Ability of the measure to relate the data to traveler perceptions in an easily understood way.
- Incorporation of safety-related measures given the role of traffic incidents in non-recurring congestion.
- Opportunities for addressing different aspects of congestion that are important to users of the transportation system, such as non-recurring traffic congestion, impacts of congestion on freight movement, and the availability of alternatives to avoid traffic congestion (e.g., transit, bicycle, and pedestrian options).
Maricopa Performance Measure Framework and CMP Update:The Maricopa Association of Governments (MAG) recently launched a study to develop a performance measurement framework and a congestion management process update for evaluating future planning and programming activities. The three-phase study is being conducted in conjunction with a technical advisory group formed from MAG's member agencies, Arizona DOT, and local FHWA representatives. The idea for developing a common process to assess and evaluate projects was based on integrating the regional transportation plan and congestion management goals and objectives. Following the development of the performance measurement framework and monitoring program, the study will move into its third phase of determining how CMP strategies should be developed based on congestion mitigation outcome measures and effective congestion management techniques. |
4.3 Use Performance Measures to Determine Operational Needs
Identifying Specific Deficiencies and Needs
Operations objectives may lead to the development of not only regional performance measures, but also local performance measures, which may be used for specific local geographic areas or facilities to assess system performance. For instance, in the CMP, a region must define what it means to have unacceptable congestion. Different thresholds can be used to define unacceptable congestion based on location, facility type, and time period, recognizing that the public may find different levels of congestion acceptable for different circumstances.
For example, slower speeds are often expected in a central business district than in a more suburban or rural area. Differentiating between location types recognizes that eradicating congestion may not be the sole community goal in all areas. Higher levels of traffic congestion may be acceptable in downtown areas where there is available transit service and quality pedestrian environments. Operations objectives targeting this congestion would, therefore, be different from objectives addressing congestion in the suburban and rural areas. Once performance measures are established for different types of roadways, these measures can be used at a local scale to identify the areas with the greatest congestion problems and target strategies and investments for these areas to maximize the investment's value.
For instance, as part of its CMP, the Capital Area Metropolitan Planning Organization (CAMPO) in Austin, Texas, utilizes travel-speed-related measures to identify congested locations. For roadway segments, CAMPO has defined minimum threshold acceptable speeds, based on the type of road and the type of area through which that road travels, with lower speeds more acceptable in a central business district location than in a rural area.
The East-West Gateway Coordinating Council (EWGC) in St. Louis, Missouri, used aerial photography with multiple photographs taken during 3-hour a.m. and p.m. peak periods, producing traffic volume and density numbers for several time points at the same location. This information allowed EWGC to track the duration of congestion along congested links, distinguishing links with prolonged congestion from those that are congested over short portions of the peak periods.18
A number of regions have developed systems to provide the public with real-time information on the condition of the transportation system (e.g., location and severity of delays, location and status of accidents, status of the transit network, weather-related traffic problems, and disruptions from special events). Much of this information can be evaluated to identify trends and current variation in system performance and to assess performance on specific sub-elements of the system. Agencies can examine ongoing system monitoring efforts as a starting place for a performance measurement program.
Determine Data Needs
Data is a prerequisite for the use of performance measures. MPOs often struggle between the desire to measure regional performance, data limitations, and cost considerations that place constraints on the extent to which performance measures can be used.
At the same time, a wealth of data is currently being collected in most regions by transportation system operators who run systems that keep track of real-time travel information. Intelligent Transportation Systems (ITS) components, in particular, such as toll tag readers and transponders, video detector systems, and traffic management systems used to provide travelers with real-time travel information, can be used to measure performance of the transportation system on an ongoing basis.
Examples of potential sources of data include:
- ITS Data on Speeds/Reliability: Operators of ITS equipment and traffic management centers (TMCs) rely on continuous collection of vehicle speed and volume data to make their systems work. These large and continuous data sets can provide a much more detailed picture of travel conditions than sampling procedures such as annual counts, if the time and effort are taken to archive them for congestion planning purposes.
- Transit Operations Data: Transit agencies may collect data on bus travel times, speeds, ridership, passenger loadings, and other factors.
- GPS Technologies: Data on travel times are collected in the field using global positioning system technology. Field surveyors drive "probe" vehicles to match traffic flow, recording digitally the time required for each segment of their travel time runs.
- Other Electronic Data: Examples include E-ZPass, Smart Cards, and other automated toll or transit fare collection services. In addition, cell phone location technologies are available. These technologies use cell phone data collected by phone companies along highway corridors to calculate travel speeds.
Central New Jersey Route 1 BRT:With traffic volumes in the New Jersey corridor estimated to increase by 55 percent by 2020 and the lack of transit service availability, several 2006 BRT studies conducted by the New Jersey Transit Corporation (NJ TRANSIT), the Delaware Valley Regional Planning Commission, North Jersey Transportation Planning Authority, and the New Jersey DOT, estimated that a bus rapid transit (BRT) system in the corridor could reduce weekday auto person trips by 11,000 to 12,000. The BRT system would transport 31,200 person trips per weekday, and include several park and rides. The transit share of work trips would more than double present transit use, from 2 – 4 percent to 5 – 9 percent in the core study area. Potential BRT routes would be designed on an exclusive guideway, where possible, to create fast, direct travel from station to station, unhampered by traffic conditions on local roads. To establish this quick and reliable service, an alignment was created to directly connect to major activity centers and only allow access to BRT and supporting feeder route buses at transfer points. This would also separate the buses from auto congestion on U.S. Route 1. The BRT will be a shared right-of-way that numerous different bus routes will use coming from various feeder locations. Instead of one line going from one point to the next, which requires people to walk and use park & ride systems, the BRT will have more flexibility over the long term: different bus routes will provide service for various counties along U.S. Route 1 and travel to many key job center destinations without the need for riders to change buses. See: http://www.dvrpc.org/LongRangePlan/CentralJerseyForum/brt.htm. |
4.4 Identify and Evaluate Strategies
Identifying Strategies
Identifying strategies to achieve operations objectives is best accomplished when transportation planners and system operators collaborate. Planners have access to data on current and future mobility concerns. Operators know best practices to implement based on their experience. When these two groups collaborate and share information, agencies are able to identify the most promising strategies to improve regional system performance.
M&O strategies may be implemented as individual programs or projects, such as a regional incident management system, traveler information system, or transit smart card system. These strategies also can be implemented as part of transportation preservation projects, safety projects, or capacity improvements. For instance, as part of any new highway expansion, it may be useful to consider the role of transportation pricing, high-occupancy vehicle (HOV) lanes, flexible design to accommodate concurrent flows of traffic, or demand management programs during the construction period.
Bringing operations stakeholders to the table with a focus on M&O in the planning process can help to identify strategies that are already being implemented or considered by operating agencies but which may have never before appeared in the MTP.
Congestion management strategies include many M&O strategies, and also may include land use strategies or infrastructure development, where needed. Examples of congestion management strategies that might be included in a CMP are identified here:
- Operating Existing Capacity More Efficiently: Getting
more out of what we have through improvements to system operations:
- Metering traffic onto freeways.
- Optimizing the timing of traffic signals.
- Improving incident response.
- Realigning transit service schedules.
- Improving management of work zones.
- Identifying weather and road surface problems and rapidly targeting responses.
- Installing a transit signal priority system.
- Implementing access management.
- Demand Management: Encouraging changes in travel
mode, time, location, or route:
- Programs that encourage transit use, ridesharing, bicycling, and walking.
- Parking management.
- Employer-based programs.
- Telecommuting programs.
- Congestion pricing.
- Providing real-time information on transit schedules and arrivals.
- Land Use Strategies: Strategies designed to alter
development patterns and design:
- Transit-oriented development.
- Clustering development.
- Urban design.
- Infrastructure Development: New highway, transit,
or bicycle/pedestrian capacity:
- Adding capacity to the transit system (buses, urban rail, or commuter rail).
- Adding travel lanes on major freeways and streets.
- Removing bottlenecks.
- Installing overpasses or underpasses at congested locations.
Example of an M&O Strategy – Boston Silver Line BRT:The Massachusetts Bay Transportation Authority (MBTA) designed the 7-mile Silver Line as a Bus Rapid Transit (BRT) service to provide high frequency and high quality service from Dudley Square and lower Roxbury through the South End, Chinatown, downtown, and on to the South Boston Waterfront and continuing service to Logan International Airport. The Silver Line is intended to increase mobility and support economic development in Boston's neighborhoods. This new line will greatly improve the existing transportation network in the downtown core by providing mobility improvements throughout the system through improving connections to the Red, Orange, and Green subway lines, and providing improved access to the commuter rail system, as well as the intercity Amtrak and intercity bus terminals. The Silver Line also will address existing congestion on both the transit system as well as the roadway network. Several attributes and ITS applications utilized by the Silver Line are fundamental to producing many BRT benefits, significantly improving the system. Silver Line's traffic signal priority technologies improve schedule adherence, reliability, and speed to extend or advance green light times or allow left turn swaps to allow buses that are behind schedule to get back on schedule. Designated (reserved) arterial lanes reduce travel time and improve reliability since a traffic lane within an arterial roadway is set aside for the operation of BRT vehicles. The automated scheduling dispatch system utilizes real-time vehicle data to manage all BRT vehicles in the system and ensure a high level of service for passengers. |
A Toolbox of Solutions
Some regions have developed a "toolbox" of congestion management strategies as part of their CMPs to provide guidance for agencies that are essential partners to MPOs in managing congestion. A toolbox offers MPOs an opportunity to communicate a framework for responding to congestion. For instance, MPOs can suggest that roadway capacity projects be considered only after other strategies, such as demand management or operations, have been exhausted. A toolbox also serves as a guide to inform implementing agencies about issues that may arise in implementing the strategies, such as when strategies require supporting efforts, such as local land use planning, to work most effectively.
Performance measures can be used to help identify, develop, and assess strategies that are best geared toward achieving results. Utilizing operations objectives and related performance measures focused on issues such as reliability, travel delay, and other operating issues often leads to the development of M&O strategies. Use of measurable objectives for a wide range of goals, addressing safety, security, the environment, etc., also can lead to greater attention to M&O strategies since the planning process focuses on performance rather than looking narrowly at categories of projects, such as highways, transit, and bicycle and pedestrian projects.
Data on system performance can highlight the value of investments in programs that minimize incident-related delays, provide information on real-time travel conditions, and improve emergency response times by showing how such investments can improve transportation system reliability and reduce travel times for customers.
Congestion Management Toolbox: Helping Evaluate Strategies:The Southwestern Pennsylvania Commission (SPC) uses a congestion management toolbox that includes 25 different strategies for addressing congestion, all organized around the four major categories of demand management, modal option, operational improvements, and capacity. Each of the 25 strategies is evaluated for suitability and potential benefit with each of the region's CMP corridors. To provide input on strategy evaluations, SPC developed an Internet-based tool. The tool is linked to a database that compiles the input and allows SPC to create a series of matrices for each corridor. These matrices help to identify where the consensus lies on various strategies in that corridor and can help prioritize strategies for each corridor. The prioritization of congestion management strategies can then be used to inform decisionmaking for the long-range plan and the TIP programming process. |
Analyzing Strategies for Prioritization
After a region has identified potential M&O strategies for achieving its operations objectives, the region moves forward with the task of evaluating and prioritizing the strategies that will be selected for funding and implementation. In the objectives-driven, performance-based approach for planning for operations, the prioritization of M&O strategies is founded on the predicted ability to help the region achieve its operations objectives. While this element of the approach is challenging for many regions, it is important for making informed decisions on applying resources to achieve operations objectives.
The ability of MPOs to quantify the performance benefits of M&O strategies is limited by access to quality data and the effort required to use analysis tools appropriate for this task. Analysis tools that can be effectively used for planning for operations is a current area of research and development. However, there are a number of existing tools and methods available to predict the effects of operational strategies on system performance. Partnering with other agencies in the use of analysis tools for evaluating the impacts of M&O strategies can be critical for success and should be considered as a way to overcome the challenges associated with analysis.
The prioritization of M&O strategies for funding and implementation will typically not occur in isolation, but instead within the context of goals and objectives outside of operations. Goals and objectives for safety, environment, system preservation, livability, and others are likely to be included in an MTP. M&O strategies may be evaluated and prioritized for their impact on these other areas as well as their contribution to operations objectives. In some regions, M&O strategies or projects may compete directly with other projects for funding whereas in other regions there is a dedicated pool of funding for operations projects so that operations projects may compete with each other but not with other types of projects such as capacity or preservation improvements.
The following is a brief description of analysis tools that can be used for predicting the impacts of M&O strategies:19
- Sketch planning tools, such as the ITS Deployment Analysis System (IDAS), Screening for ITS (SCRITS), and Surface Transportation Efficiency Analysis Model (STEAM). These tools generally provide order-of-magnitude estimates of travel demand and traffic operations in response to transportation improvements. They can be low cost and require less data than other tools, but are limited in scope and presentation. The IDAS software works with the output of traditional transportation planning models and enables planners to evaluate both the relative costs and benefits of ITS investments.20 SCRITS is similar in that it is intended to allow practitioners to obtain an initial indication of the possible benefits of various ITS applications. It involves a more simplified spreadsheet analysis to expedite a benefit-cost analysis.21 STEAM enables users to assess the net safety and mobility benefits of transportation investments as well as policy alternatives in multimodal urban regions and corridors.
- Simulation tools, which include microscopic,
mesoscopic, and macroscopic applications.
Simulation tools are used by agencies to analyze
the impact of operations strategies as well as to
conduct environmental impact studies, needs
assessments, and alternatives analysis. Tools
within this group can provide detailed results,
an analysis of incidents and real-time diversion
patterns, and useful visualizations of impacts
for presentations. While the tools have several
advantages, they can be costly to use because
of data requirements and necessary computing
capability.22
- Macroscopic simulation models are based on the deterministic relationships of the flow, speed, and density of the traffic stream. The simulation in a macroscopic model takes place on a section-by-section basis rather than by tracking individual vehicles. They are limited because of the lack of detail they can provide and they do not account for trip generation, trip distribution, or mode choice in their simulations.
- Mesoscopic simulation models provide a combination of macroscopic and microscopic simulation model attributes. They use individual vehicles as the traffic flow units but predict travel on an aggregate level and do not factor in the dynamic relationships of speed and volume. They can be used for short-range operations planning including traveler information strategies. DYNASMART-P, DynaMIT-P, TransModeler, and TRANSIMS are examples of mesoscopic simulation models.
- Microscopic simulation models include CORSIM/TSIS, Paramics, AIMSUN, and VISSIM. They model traffic flow at the level of individual vehicles based on car-following and lane-changing theories. These models can produce results beyond other types of tools but require significant computing time and storage, and may be difficult to calibrate. They can be effective, though, in evaluating areas of significant congestion and impacts of proposed transportation improvements at the system level.
- Use of archived data, which allows performance measurement before and after implementation of operations-oriented projects. This data can be also used to calibrate and supply inputs to models. Archived data is often collected by State and local DOTs through roadway detections devices and transit agencies via on-board systems.
15 National Transportation Operations Coalition, Performance Measurement Initiative – Final Report, July 2005. Available at: http://ntoctalks.com/ntoc/ntoc_final_report.pdf, last accessed December 6, 2009.
16 Federal Highway Administration, Office of Operations, "Travel Time Reliability Measures – Operations Performance Measurement." Available at: https://ops.fhwa.dot.gov/perf_measurement/reliability_measures/index.htm, last accessed December 6, 2009.
17 Victoria Transport Policy Institute, TDM Encyclopedia, Performance Evaluation Practical Indicators For Evaluating Progress Toward Planning Objectives at http://www.vtpi.org/tdm/tdm131.htm and Eric Schreffler (2000), "State of the Practice: Mobility Management Monitoring and Evaluation in the United States, MOST: Mobility Management Strategies for the Next Decades"; Work Package 3, D3 Report, Appendix C.
18 For more information, see East-West Gateway Council of Governments, "Transportation." Available at: http://www.ewgateway.org/trans/transportation.htm, last accessed December 6, 2009.
19 U.S. Department of Transportation, FHWA, "Applying Analysis Tools in Planning for Operations," FHWA-HOP-10-001 (Washington, DC: 2009). Available at: https://ops.fhwa.dot.gov/publications/fhwahop10001/index.htm, last accessed February 4, 2010.
20 For more information, see the IDAS information page at: http://idas.camsys.com/.
21 For more information, see the Federal Highway Administration's "STEAM: Screening for ITS" page at: https://www.fhwa.dot.gov/steam/scrits.htm.
22 Federal Highway Administration, Office of Operations, "Traffic Analysis Tools, Types of Traffic Analysis Tools." https://ops.fhwa.dot.gov/trafficanalysistools/type_tools.htm, last accessed February 9, 2010.